HAL Id: tel-01296502
https://tel.archives-ouvertes.fr/tel-01296502
Submitted on 1 Apr 2016
HAL is a multi-disciplinary open access
archive for the deposit and dissemination of
sci-entific research documents, whether they are
pub-lished or not. The documents may come from
teaching and research institutions in France or
abroad, or from public or private research centers.
L’archive ouverte pluridisciplinaire HAL, est
destinée au dépôt et à la diffusion de documents
scientifiques de niveau recherche, publiés ou non,
émanant des établissements d’enseignement et de
recherche français ou étrangers, des laboratoires
publics ou privés.
Three-dimensional infrared imaging for chronic kidney
disease investigation
Hsiang-Hsin Chen
To cite this version:
Hsiang-Hsin Chen.
Three-dimensional infrared imaging for chronic kidney disease investigation.
Chemical Physics [physics.chem-ph]. Université de Bordeaux, 2015. English. �NNT : 2015BORD0448�.
�tel-01296502�
1
THÈ SE PRÉ SENTÉ E
POUR OBTENIR LE GRADE DE
DOCTEUR DE
L’UNIVERSITÉ DE BORDEAUX
É COLE DOCTORALE DES SCIENCES CHIMIQUES
SPÉ CIALITÉ : Chimie Physique
Par Hsiang-Hsin Chen
TITRE
Imagerie IRTF tridimensionnelle pour l’étude de l’insuffisance rénale chronique
Sous la direction de : Cyril Petibois
Soutenue le 16/12/2015
Membres du jury :
M. Laroche, Gaétan Professeur, Université Laval, Quebec, Canada Rapporteur Mme Javerzat, Sophie Professeur, Université de Bordeaux
M. Moenner, Michel Professeur, Université de Bordeaux
Examinateur, présidente Examinateur
2
Titre : Imagerie IRTF tridimensionnelle pour l’étude de
l’insuffisance rénale chronique
Résumé :
L’insuffisance rénale chronique (IRC) et l’une des pires maladies chroniques dans les
pays développés. Les grades de l’IRC sont principalement basés sur la mesure ou
l’estimation du taux de filtration rénale (GFR). Cependant, cette méthode est peu sensible
sur les premiers stades de la pathologie et n’apporte donc pas de valeur diagnostique. La
détection de la pathologie à des stades précoces et son traitement peuvent éviter ou
limiter les effets délétères de la chronicité. Cette thèse se penche sur le développement
de la microscopie IRTF en tant qu’outil diagnostic pour l’identification par histopathologie
à l’échelle du glomérule dans un modèle d’IRC. Nous avons développé la technique de
reconstruction 3D pour l’imagerie IRTF des modifications biochimiques à l’échelle du
glomérule pour déterminer des marqueurs de l’IRC. La déconvolution spectrale et le
clustering sont appliqués après analyses IRTF pour distinguer les modèles sains et
pathologiques. Ensuite, la microvasculature glomérulaire est révélée par agent de
contraste pour en déterminer les anomalies morphologiques. Grâce aux résultats obtenus
en 3D et l’utilisation de méthodes statistiques avancées, la microscopie IRTF est utilisée
comme une technique fonctionnelle pour déterminer les modifications morphologiques et
moléculaires apparaissant au cours du développement de l’IRC.
3
Title : THREE-DIMENTIONSAL INFRARED IMAGING FOR
CHRONIC KIDNEY DISEASE INVESTIGATION
Abstract :
CKD (Chronic Kidney Disease) is one of the worst public diseases in developing countries.
The stages of CKD are mainly based on measured or estimated GFR (Glomerular
Filtration Rate). However, this method is not sensitive enough on early stages of the
pathology and thus do not offer accurate diagnostic value. Early detection and treatment
can often limit or avoid the chronicity effects of the disease. This thesis focuses on the
development of FTIR microscopy as a diagnostic tool for the identification by
histopathology at glomerulus level of the kidney in CKD model. We developed a technique
of 3D reconstruction for the FTIR imaging of biochemical components changes in
glomeruli for identifying the pathological marker of CKD. The curve-fitting and spectral
clustering are applied on the FTIR microscopy analysis to distinguish between healthy
and pathological glomeruli of a kidney. Then, the glomerular microvasculature is
highlighted to reveal the morphological abnormalities by perfusing contrast agents into
blood vessels. With advanced 3D statistical methods and 3D image visualization by
microscopy, FTIR spectro-imaging can be used as a functional technique to determine the
morphological and molecular changes occurring along CKD development.
Keywords : FTIR, CKD, glomeruli, histopathology
Unité de recherche
4
PhD Thesis
PRESENTED AT THE UNIVERSITY OF BORDEAUX
DEPARTMENT OF LIFE SCIENCE
THREE-DIMENTIONAL INFRARED IMAGING FOR CHRONIC
KIDNEY DISEASE INVESTIGATION
by HSIANG-HSIN CHE
N
5
Acknowledgements
This work would not be possible without the support and encouragement of the professors and colleagues in Bordeaux and Taiwan, whose much inspiring presence has deeply enriched my years in the University of
Bordeaux.
Firstly and foremost, I would like to thank my supervisor, Dr. Cyril Petibois, for his support, encouragement, and guidance during my study. His mastery of spectroscopic imaging and his strong enthusiasm for scientific
enterprise have been inspirational role-model to me in the rest of my research path.
I would also like to thank Professor Sophie Lecomet and Andreas Bikfalvi for giving me the opportunity to study my PhD project in CBMN and U1029 research groups, respectively, throughout the period of this work.
Their valuable support is the precious part of my PhD study to be deeply acknowledged.
In particular, I would like to thank Dr. Yeukuang Hwu, the senior researcher of Institute of Physics in Academia Sinica, Taiwan for his precious comments, support and helps during my PhD study. I would like
to say special thanks to the colleagues of his group for their availability, encouragements and helps about my work. I also pay my deepest gratitude to Dr. Ann Chen, Doctor of Tr-iservice Hospital in Taiwan, and his
group members for the collaboration of work and helps in our research by providing the tissue samples.
I would also like to say my deepest thanks to Prof. Gaétan Laroche, Universite Laval, Canada, and Prof. Michel Moenner, Universite de Bordeaux, for generously providing their time and valuable suggestions in
evaluating my thesis as the jury of my thesis defense. I am very grateful to Prof. Sophie Javerzat, Universite de Bordeaux for accepting be the referee, detailed reading my thesis. I would like to say special thanks to
Prof. Chia-liang Cheng for his time out of his busy schedule and suggestions about my thesis.
Sincere thanks to members of my research group for being my loved friends and trusted allies as well as providing their patience and efforts about the experiment preparation and statistical discussions of my data
6 analysis problems.
Special thanks to my friends in Bordeaux whom made my life at the University of Bordeaux richer and livelier.
Finally, I would like to express my sincerest thanks and gratitude to my family in Taiwan who have provided
their deep love and encouragement throughout my PhD work. Despite being thousands of miles away, they have been an integral part of my life and I owe it all to them.
7
Three-dimensional Infrared Imaging for Chronic Kidney Disease
Investigation
Table of Contents
List of Figures ... 9
List of Tables ... 11
List of Abbreviations ... 12
Introduction ... 14
CKD prevalence ... 14
General information about the kidney ... 15
The kidney’s function and body homeostasis ... 16
Defining chronic kidney disease ... 18
Renal failure in CKD ... 19
Glomerular patho-physiology ... 20
Degenerative glomerular efficiency ... 21
Glomerular importance in CKD ... 22
Justification of GFR and other markers of the kidney in clinical and experiment studies
... 23
The clearance rate of endogenous plasma substrates in blood and urine ... 25
Bioimaging approaches for CKD ... 25
X-ray computer tomography ... 26
Magnetic resonance imaging based morphometric analysis of glomeruli in whole
kidney ... 27
Renal ultrasonography morphology ... 29
Microscopy techniques in histology ... 30
Hematoxylin and Eosin (H&E) staining as a basic tool for histopathology ... 30
Fluorescent imaging of glomeruli for functional study ... 31
Alternative method: Morphological visualization of glomerular vasculature by
corrosion casting-based investigation ... 32
Clinical imaging techniques for evaluating renal function in CKD ... 34
Emerging technique: Infrared spectral imaging in biochemical analysis ... 35
General information of IR spectromicroscopy ... 35
8
FTIR imaging system ... 37
Biomedical application of FTIR imaging ... 39
The art of 3D FTIR imaging technique on histopathology... 40
Why combine X-Ray tomography and FTIR imaging for CKD analysis? ... 40
Objectives ... 42
Methodology ... 43
Animal experiments ... 43
Imaging contrast agents ... 43
FTIR imaging ... 44
Data acquisitions ... 44
Spectral interval absorptions ... 45
Statistical analyses on spectra ... 45
Classical cluster analysis ... 46
Curve fitting ... 46
3D FTIR image reconstructions ... 47
Results ... 48
Publication No. 1: ... 49
Title: the future of infrared spectroscopy in biosciences: in vitro, time-resolved, and
3D ... 49
Publication No. 2 (Project): Applying 3D FTIR imaging to CKD investigation ... 58
Title: 3D FTIR imaging of the kidney glomeruli’ micro-environment in chronic kidney
disease ... 60
Publication No. 3 (Participation): ... 79
Title: Very small photoluminescent gold nanoparticles for multimodality biomedical
imaging ... 80
Publication No. 4 (Participation) ... 90
Title: FTIR spectro-imaging of collagen scaffold formation during glioma tumor
development ... 91
Discussion ... 102
Conclusions & Perspectives ... 106
Project of International Associated Laboratory – VascView ... 108
ITEA3.1 European Project – 3Dpathology ... 110
ITEA3.2 European Project – DrugsInOrgans ... 112
9
List of Figures
Figure 1. Schematic overview of the anatomy of a kidney.
... 15
Figure 2. Conceptual framework for the progression of kidney injury..
... 16
Figure 3: Kidney function on body homeostasis.
... 18
Figure 4. Cross-section of a glomerulus.
... 21
Figure 5. Micrographs of micro-CT images in vasculature imaging.
... 27
Figure 6. Micrograph of a 2D projection of 3D MR image of a human kidney
injected with labelling image agent for the visualization of glomeruli ... 28
Figure 7. Ultrasonography of the kidney
... 29
Figure 8. H&E stained micrographs of renal tissue
... 31
Figure 9. Micrograph of fluorescent microangiography of a glomerulus in
kidney ... 32
Figure 10. The reconstructed micrograph of a dissected region of casted
kidney by Nano-CT ... 33
Figure 11. The reconstructed micrograph of a casted glomerulus by Nano-CT
... 33
Figure 12. Electromagnetic spectrum of wavelength and frequency and it
bio-applications ... 36
Figure 13. The typical biological spectrum on the spectral interval of 3000 cm
-1to 800 cm
-1. ... 37
Figure 14. The schematic layout of FTIR spectro-microscopy
... 38
Figure 15. The 2D mapping of the individual formalin-fixed or air-dried cells by
micro-FTIR ... 39
Figure 16. Phase contrast microradiographs of healthy and pathological
kidneys. ... 41
Figure 17. Example of biochemical, molecular and structural parameters found
discriminant between healthy (top) and pathological (bottom) mice kidney
samples by FTIR imaging. ... 41
10
Figure 18. The variation of biochemical content in the kidney of UUO mice.
... 68
Figure 19. Statistical pattern of lipid to protein ratio in renal specimens of UUO
mice ... 70
Figure 20. The unsaturation level of fatty acid chains molecules in kidney of
UUO mice. ... 72
Figure 21. Average infrared spectra from renal specimens treated with or
without BaSO
4perfusion. ... 74
Figure 22. The variation of glomeruli volume in kidney due to UUO
... 75
Figure 23. Spectral feature on the F.A.C. region in UUO mice clusters.
... 76
Figure 24. Stereological variation of spectral feature of glomeruli in UUO mice.
... 77
Figure 25. 3D imaging of morphological structure and spectral feature on
11
List of Tables
Table 1. The stages of chronic kidney disease based on the estimated GFR
value ... 19
Table 2. Renal biomarkers involved with pathological progress
... 24
Table 3. Overview of imaging system performed on renal studies.
... 26
12
List of Abbreviations
ADMD
Asymmetric dimethylarginine
FAC
Fatty acyl chain
AFM
Atomic-force microscopy
AGE
Advanced glycation end product
ANF
Atrial natriuretic factor
ANP
Atrial natriuretic peptide
AOPP
Advanced oxidation protein products
ApoA-IV
Apolipoprotein A-IV
ATR
Attenuated total reflectance
BaSO
4Barium Sulphate
BNP
Brain natriuretic peptide
CaF2
Calcium fluoride
CKD
Chronic kidney disease
CFA
Correspondence factor analysis
CRP
C-reactive protein
CT
Computed tomography
cTnT
Cardiac troponin T
CVD
Cardiovascular disease
ECM
Extracellular matrix
ESRD
End-stage renal disease
FGF
Fibroblast growth factor
FPA
Focal plane array
FTIR
Fourier transforms infrared spectroscopy
Gd
Gadolinium
GFR
Glomerular filtration rate
GGT
γ-glutamyltransferase
H&E
Hematoxyline and eosin
hs-CRP
High-sensitivity-CRP
13
KIM-1
Kidney injury molecule-1
L-FABP
Liver-type fatty acid-binding protein
LN-MRI
Lymphotropic nanoparticle enhanced magnetic
resonance imaging
MDA
Malondialdehyde
MRI
Magnetic resonance imaging
MSCT
Multislice computed tomography
NAG
N-acetyl-β-o-glucosaminidase
NGAL
Neutrophil gelatinase-associated lipocalin
NT-proBNP
N-terminal brain natriuretic peptide
OCLs
Quantum-cascade lasers
OCT
Optical coherence tomography imaging
Ox-LDL
Oxidized low-density lipoproteins
PCA
Principle component analysis
PET
Positron emission tomography
PLS
Partial least square
PTX3
Pentraxin 3
SEM
Scanning electronic microscopy
sTNFrii
Soluble tumor necrosis factor receptor II
TAS
Total antioxidant status
TBARs
Thiobarbituric acid reactive substances
TGF-β1
Transforming growth factor-β1
TIMP-1
Tissue inhibitor of metalloproteinases-1
OCLs
Quantum-cascade lasers
14
Introduction
Chronic kidney disease is a progressive renal dysfunction, which loses renal function over time because of direct and indirect factors. Such as physical obstruction, microorganism infection and thickening renal tubules are the main direct factors; for indirect factors, the increased blood pressure, anemia and poor nutritional supply, mainly attributed to the complication are led by hypertension and diabetes mostly. FTIR imaging technique has been proposed to be a useful tool to characterize the chemical change of
biosamples with pathological conditions. To define the histopathological changes of the kidney with CKD by 3D chemical FTIR imaging is helpful to investigate the molecular information of CKD tissue, especially focusing on the study of the renal unit, glomerulus.
In the present study, the imaging methodology of 3D FTIR imaging provides access to the chemical parameters of mapped tissue specimens of interest. By using several computational algorithm applied on the obtained spectral dataset of renal sample, the samples with different severity of CKD can be
discriminated with the evaluation of lipid-to protein ratio, unsaturation level of F.A.C.s sub-molecules and barium sulfate, reflected to the morphometric change of glomerulus level.
The tasks of this thesis project is as the following:
1) To characterize the chemical change of renal tissue of CKD based on the spectral data obtained by FTIR soectramicroscopy
2) To image the compositional information of pathological renal samples for histopathological purpose by FTIR imaging
3) To discriminate the biochemical parameters of glomerulus level between pathological, its contralateral kidneys of a mouse with CKD and healthy kidneys with traditional and advanced algorithm applied on Spectral data
4) To discriminate the pathological severity of the kidneys during the CKD progression with multivariate data treatment of FTIR 2D dataset
5) To visualize the spatial distribution of chemical/molecular change of glomerulus level for characterizing the histopathological parameters attributed to CKD development.
CKD prevalence
Chronic kidney disease (CKD) becomes one of the major worldwide public health problems, due to its increasing number of afflicted patients as well as the poor prognosis of morbidity and mortality [1, 2]. In the United States, the prevalence of end-stage renal disease (ESRD) progressing from CKD is increasing exponentially [3]. The number of patients enrolled in the ESRD Medicare-funded program has increased from ~ 10,000 in 1973 to 615,899 in 2011. Patients with ESRD consume a disproportionate share of healthcare resources. In the USA, the total cost of the ESRD program reached $49.3 billion in 2011 [2, 3] and overall annual Medicare costs more than $75,000 per person, including expensive cares such as $32,922 for transplant patients and $87,945 for hemodialysis therapy. Despite the magnitude of resources
15
committed to the treatment of ESRD and the substantial improvements in the quality of dialysis therapy, patients continue to experience significant mortality, morbidity and reduced quality of life. The same trend was observed in Europe and certain developed countries in Asia, such as Japan [4].
CKD is particularly serious in Taiwan, where the incidence of ESRD is now the highest in the world. The prevalence of CKD increased from 1.99% in 1996 to 9.83% in 2003. The overall incidence rate during 1997 to 2003 was 1.35/100 person-years. However, the awareness of CKD is low in contrast to its high prevalence in society which increase the difficulty in earlier diagnosis.[5, 6]. The factors compounded with other increasing risk of developing CKD, include older age, diabetes, hypertension, hyperlipidemia, and the female sex [7, 8] , making this progressive disease an even more serious public health issue in Taiwan.
General information about the kidney
The kidney is a complex organ that is composed of a variety of different cellular structures. Its internal anatomy contains three main sections inward: the cortex, the medulla and the pelvis (Figure 1A) [9]. The blood carrying cellular wastes is filtered by renal units called “nephrons” (Figure 1B), located in the cortex, removing water-soluble entities into the urine. This blood filtering process takes place in the glomerulus, the microvasculature of the nephron, through mediating the surface charge of the glomerular basement membrane (GBM) and the pore size in the membrane of the glomerulus barrier [10]
.
Figure 1. Schematic overview of the anatomy of a kidney. (A) Coronal section of the kidney; (B) schematic diagram of a nephron
[9]. The nephron is the functional unit of the kidney. The glomerulus and convoluted tubules are located in the kidney cortex, while collecting ducts are located in the pyramids of the medulla.
16
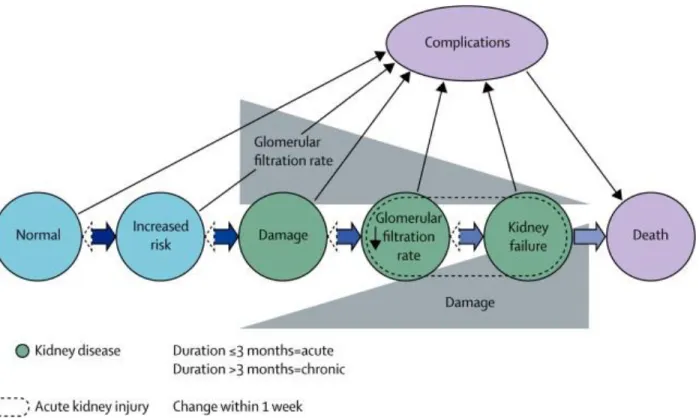
The renal filtering efficiency of the glomerulus declines when it is subjected to stress from different origins or pathological conditions of the organs, which consequently could cause renal failure and further lead to the loss of kidney functions (Figure 2) [10]
.
Figure 2. Conceptual framework for the progression of kidney injury. The risk factors for kidney damage (blue), stages of
progression of kidney disease (green) and the complications and death (purple). Thick horizontal arrowheads represent the transition between the progression of kidney disorder and the outcomes to death. Dashed arrowheads represent the remission of kidney disorder which has less frequency than the progression. Solid black arrow lines represent the complications of kidney injury, which includes nephron disorder and cardiovascular disease. CVD, for example. Glomerular filtration rate (GFR) reduces as the kidney disease progresses, while kidney damage increases in severity [11].
The kidney pathologies often induce secondary pathologies in the body due to the accumulation of toxic entities that have not been properly filtered to be removed by urine [12]. The very complex anatomy-function correlation from macroscopic (organ) to microscopic (glomerulus) levels increases dramatically the difficulty in analyze the kidney pathology.
The kidney’s function and body homeostasis
The kidney has several physiological functions that mediate the interactions of organs within the body, including endocrine secretion, metabolic activities (with glycogen storage for ex.) and the regulation of blood pressure; however, its primary role is the elimination of waste products. There are two ways the kidney controls the homeostasis of the body system: The first is by being the activator through proper functioning,
17
thus supporting systematic balance. The other is by being the target, receiving signals from other organ systems to activate downstream reactions. Consequently, the quality of kidney functions are strongly affected by a variety of disorders, including metabolic syndromes (diabetes, hypertension and obesity), immune-mediated injuries, dysregulation of hormone secretions (impaired balance of erythropoiesis), an impaired respiratory system (lung infiltration) as well as pathological conditions originating from the kidney itself (ex. glomerulonephritis, nephrosclerosis and polycystic kidney disease) [11]. The complications and disorders brought about by renal injury may further contribute to the progression of kidney damage: for example, cardiovascular disease (CVD)-induced chronic kidney disease [13]. On the other hand, the presence of renal disease usually initiates secondary diseases or worsens the progression of existing acute or chronic pathologies in patients. Some examples are given below (Figure 3).
18
Figure 3: Kidney function on body homeostasis. The interactions between the kidney and other organ systems are mediated
properly in order to maintain the systemic balance of body. FGF= fibroblast growth factor. ANF= atrial natriuretic factor [11]
The result from the wide interactions existing between the kidney and other organs is that many pathologies can affect the body’ homeostasis, and thus make the appreciation of the physiological function of the kidney difficult. It is obviously more complex once a pathology occurs, either in the kidney to affect other organs, or from these organs to affect the kidney functions.
Defining chronic kidney disease
When a disease affects the kidney progressive renal injury can occur, and will later be followed by renal inefficiency and an impaired filtering function; this pathological development is referred to as ‘chronic kidney disease’ (CKD) [1, 14]. It is difficult to detect the early symptoms of CKD before the situation of the patient presents comorbid disorders [15]. During the progression of CKD, the disorders induce functional and anatomical alternations in the organ, which both interactively contribute to the complexity of CKD. The decrease in kidney function in CKD is primarily caused by the loss of functional nephrons, the basic units of blood filtration and cleaning [16]. The efficiency of glomerular filtrating activity is tied to the reduced amount of working nephrons, and has thus become a standard of estimating the level of kidney injury in CKD. In 2002, the National Kidney Foundation (NKF) gave a clinical guideline that proposes the definition of CKD based on the level of GFR, and created the classification of 5 stages to characterize the development of CKD (Table 1) [17-19]. In this report, CKD is characterized by a decrease in GFR to a level below 60 ml/min per 1.73 m2 of average body surface area for at least three months’ time, or a significant increase of
biochemical markers in the urine (ex. albuminuria) of the patient. The latter is based on the structural injury of the glomerular membrane barrier, in which the permeability to macromolecules is altered, allowing for the appearance of proteinuria in the CKD patient.
19
Table 1. The stages of chronic kidney disease based on the estimated GFR value [19].
Renal failure in CKD
Numerous studies have confirmed as well as discussed the pathophysiological characteristics and the progression of CKD in human and established animal models [20-22]. The common features include appearance of fibrotic tissue, increased oxidative stress, inflammatory infiltration and cellular shape aberrations, which collectively contribute to the pathogenesis and progression of CKD [23]. Biomolecules - including DNA, protein, lipid, and carbohydrates - are usually subject to oxidative stress, and their alteration leads to dysfunction in cellular functions. Renal fibrosis is the most significant clinical outcome of a severe CKD, and it appears at the end-stage of renal function [24]. Renal fibrosis occurs progressively in either renal interstitium or glomeruli, and alters the renal parenchyma by forming scar tissue, which is mainly composed of collagens [25, 26]. The destruction of normal kidney parenchyma’ tissue due to proliferated fibrotic components leads to a distorted function and structure of glomeruli, renal tubular and also causes microvasculature reductions, all resulting in the decrease of glomerular function. It finally results in the retention of fluids in renal tissue, as well as a hypoxic condition that is induced by impaired oxygen supply from scarred blood vessels [27]. However, the level of pathophysiological features in CKD does not only correlate with the estimated GFR in CKD patients [28]. Existing research indicates that increased oxidative stress and inflammation are observed to be prevalent in patients with CKD earlier in the course of kidney disease than previously recognized by the estimate of GFR, and these observations would not be closely correlated with estimates of GFR. Hence, there is a need to use a reliable methodology with sensitivity and quantitative value for determining the level of each biochemical parameter useful for staging the kidney injury in CKD, which will be especially important in the early detection of disease symptoms [29].
20
Glomerular patho-physiology
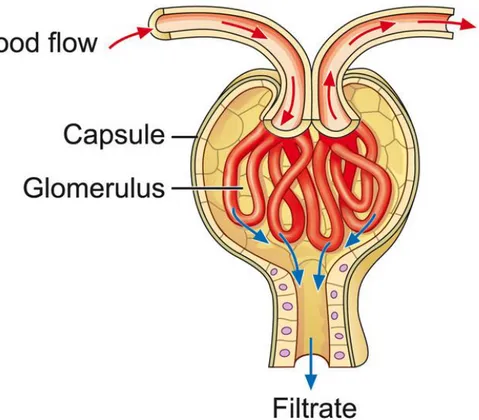
During the progression of CKD in human and animal models, the glomerulus is the most susceptible sub-structure of renal tissue [30]. Capillary-loop glomerulus, with its selective permeability to blood circulation, is the central functional part of nephrons in the kidney. The segmented renal tubule which collects filtered fluid from glomerular capillary is followed by the reabsorption of water and small molecules back to body (Figure 4). Blood filtration takes place in the glomerular part of the capillary tube, selectively transferring water-soluble molecules (urea, glucose, various salts, amino acids, and mineral ions) across the glomerular barrier but retaining high molecular weight plasma components and cells, like albumin and erythrocytes, forming the primary urinary fluid. The portals on glomerular barriers are a cluster of windows with diameters between 60-100 nm, which restrict the cross-traffic of blood-filtrated solutes with the selectivity in size and surface charge. Besides the glomerular capillary, the glomerular vasculature consists of afferent arteriole and efferent arteriole, which serve as the entrance and exit for blood flow in glomerulus, respectively. The ongoing afferent arteriole is of larger diameter than the outgoing efferent arteriole, which mediates glomerular blood pressure as a control system in regulation of GFR [31]. Each kidney holds approximately 900,000 to 1,000,000 nephrons in an adult human [32], depending on age, size, race, gender as well as birth weight [33]. A lower nephron number is considered as a risk factor in CKD, and the overloading of renal filtration in the remaining working nephrons is often a consequence, which further worsens the glomerular injury, and is followed by a loss of more working nephrons [20]. Thus pathologies in the kidney are mostly degenerative or evolutive
.
21
Figure 4. Cross-section of a glomerulus. The glomerulus is a tuft of capillaries located within Bowman's capsule of the kidney. Blood
enters the capillaries of the glomerulus by an arteriole called afferent arteriole and leaves by an efferent arteriole. The capillaries are lined by a layer of endothelium cells that has a unique structure, allowing blood components to be filtered and resulting ultimately in the formation of urine (http://www.fmc-renalpharma.com/the_kidneys.htm).
Degenerative glomerular efficiency
Numerous renal disorders involve glomerular injury, which can be unspecific histopathological features of proliferated scars, thickened glomerular membrane, macrophage infiltration and cell proliferation in the renal parenchyma [34]. Most evaluating methods rely on histological or fluorescent staining on prepared tissue specimen. The pathogenesis of glomerular lesions refers to the fibrotic scarred or hyaline-deposited glomerular vasculature in glomerulosclerosis (ref). The inflammation of the glomerulus refers to glomerulonephritis, characterized with hyper-cellularity. Under the conditions of injury, the thickening of the impaired Bowman’s capsule membrane causes the decreased diameter of the vascular pole of glomeruli, or the urinary pole of Bowman’s capsule. The glomerular function impairment thus represents the outcomes of the filtration inefficiency, proteinuria, and uremia.
The activated signal pathway responding to increased oxidative stress, inflammation and fibrosis in renal degeneration promotes the renal functional deterioration that triggers abnormal cell growth, cellular death of necrosis and apoptosis as well as alternates the selective binding capability or permeability of regulator protein in mediating cellular processes. Abnormality of fibroblast growth may occur in the renal tubule, glomeruli and the renal artery or veins, which in turn affect the reabsorption and blood circulation within the
22
kidney, reducing glomerular efficiency. The transformed cellular shape may exhibit a different structure due to increased oxidative stress, causing abnormal tissue architecture. A report from the study of urinary obstruction-induced renal damage has indicated elevated levels of oxidative stress and a diminished amount of anti-oxidant catalases within the kidney. On the other hand, increasing oxidative stress and inflammation in turn promotes the progression of renal dysfunction.
In histopathology, glomerular lesions have several categories based on the patterns of glomerular injury, either in geometry or in origin site, such as the extent of injured glomeruli in the kidney (focal or diffused), the pathological level of injured glomeruli (segmental or global) and whether the lesion originated from glomeruli, or was spread into glomeruli (glomerulonephritis or glomerulopathy). The geometric pattern of glomerular injury is thus much reliant on the examination of morphological change on a large amount of individual glomeruli in the kidney, to differentiate the glomerular pathology.
Glomerular importance in CKD
Most research studies the level of kidney injury through the examination of molecular change, via genetic and cellular experiments in biopsies and structure alternation. This is done through optical microscopic imaging in 2-dimensions (2 D). Histopathological approaches to evaluate renal pathology have performed well in clinical trials and medical studies by providing contrast between signal visualization evidence with staining, and preliminary quantitation of renal specimens. A variety of highly specialized types of cells are in charge of maintaining renal homeostasis in the kidney, and the structural change as well as the functional variation of these types of cells are tightly integrated to generate the net extent of kidney function. However, the structural complexity of glomeruli and its associated glomerular filtration remains the barrier for the incomplete conclusion of glomerular injury, which is strongly correlated with renal function in traditional approaches. The score of renal tubule lesions and interstitial injuries examined in the histopathological results represent the limited correlation with glomerular conditions.
The reports show that the glomerular volume in the kidney represents an indicator of glomerular injury, as the glomerular disorder does not exhibit symptoms in the histopathological level at the beginning of renal impairment. The change of size, shape, and microstructure of glomeruli thus makes a great contribution to the examination of glomerular injury, especially in some glomerular diseases. Therefore, reaching a more accurate reflection of renal function via scoring the glomerular injury comes down to the requirements of morphometric information of glomeruli provided by imaging approaches. In facilitating the exploration of glomerular architecture within visualization artwork, the task of reconstructing the full 3D characteristics of anatomic and functional alternations is turning to be the key target of current bioimaging methodologies.
23
Justification of GFR and other markers of the kidney in clinical and experiment
studies
As the increasing prevalence of CKD has been observed in the developed countries of the world, the new pathological methodology for detecting CKD in its early stages as well as its severity is becoming an important issue concerned by nephrologists. Current histological protocols used widely in clinics are usually assigning GFR tests and urine assays for proteinuria [35, 36]. In the evaluation of CKD severity, GFR value is the most common indicator of renal function, but not tightly related to the early structure alternations in the kidney which would identify the subtle damage [37]. Many aspects of physiological factors about glomerular, tubular, and interstitial tissue can contribute to the occurrence of proteinuria, and the significant structure damage of renal tissue usually appears before the proteinuria is measureable [38]. The GFR estimation for diagnosing renal function typically measures the variance of the many molecules involved with the system disorder, which are usually associated with renal function. Several molecular studies also contributed to the finding of potential biomarkers related to kidney disease with some desirable properties [39]. Table 2 lists the molecules that have been discussed for the involvement with renal disorders [40]. The category of biomarkers listed is on the basis of pathological mechanism.
24
Biomarker
Kidney function (GFR) Cystatin C
β-Trace protein
Tubulointerstitial injury NGAL
KIM-1
NAG
L-FABP
Glomerular injury Podocin
Nephrin
Podocalyxin
Endothelial dysfunction ADMA Oxidative stress Ox-LDL
AOPP
TBARS
Plasma and urinary F2-isoprostanes
MDA
Protein reduced thiols
TAS
Protein carbonyls
AGE
Urinary 8-hydroxydeoxy guanosine
4-hydroxy-nonenal
Antioxidant enzyme activities (e.g., superoxide dismutase, glutathione peroxidase, catalase)
GGT Inflammation CRP and hs-CRP PTX3 sTNFrii IL-18 Tenascin TIMP-1 Fibrosis TGF-β1
Cardiovascular dysfunction ANP
BNP and NT-proBNP
cTnT
Adrenomedullin
Metabolic disorders Adiponectin
FGF-23
ApoA-IV
Table 2. Renal biomarkers involved with pathological progress [40]. Abbreviations: ADMA, asymmetric dimethylarginine; AGE,
advanced glycation end product; ANP, atrial natriuretic peptide; AOPP, advanced oxidation protein products; ApoA-IV, apolipoprotein A-IV; BNP, brain natriuretic peptide; CRP, C-reactive protein; cTnT, cardiac troponin T; FGF-23, fibroblast growth factor-23; GFR, glomerular filtration rate; GGT, γ-glutamyltransferase; hs-CRP, high-sensitivity-CRP; IL-18, interleukin-18; KIM-1, kidney injury molecule-1; L-FABP, liver-type fatty acid-binding protein; MDA, malondialdehyde; NAG, N-acetyl-β-o-glucosaminidase; NGAL, neutrophil gelatinase-associated lipocalin; NT-proBNP, N-terminal brain natriuretic peptide; Ox-LDL, oxidized low-density lipoproteins; PTX3, pentraxin 3; sTNFrii, soluble tumor necrosis factor receptor II; TAS, total antioxidant status; TBARS, thiobarbituric acid reactive
25
substances; TGF-β1, transforming growth factor-β1; TIMP-1, tissue inhibitor of metalloproteinases-1.
The clearance rate of endogenous plasma substrates in blood and urine
Analyzing body matrices like blood and urinary biopsies in order to evaluate the amount of plasma substances provides a flexible and easy access point to quantify the variations of global renal function from the two kidneys of patients. Several biomolecular clearances rates such as creatine and insulin are evaluated within 24 hours, with the standard method for estimating GFR serving as the estimation indicator when considering acceptable applications in hospitals for most patients, as well as the preliminary assay in laboratory studies. However, the goal of pursuing more accurate analysis representing detailed information of the renal function still remains. The poorer quantitative measurement of determining GFR value represented by standard equation is attributed to the heterogeneity of race, sex, and the nature of the individuals as well as age of the patient. The other issues in performing standard biopsy methods include the time-consuming nature of analysis procedures, the limited availability in obtaining biopsies of some patients as well as emerging cases of the patient.
Bioimaging approaches for CKD
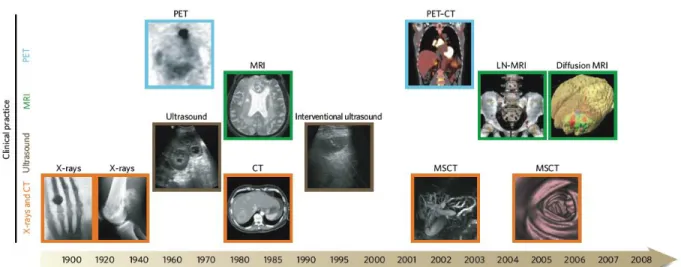
Different imaging modalities provide a way to monitor the complexity, diversity and the distribution of systematic disorders of the patients on the respect of morphology and function (Figure 7) [41]. Methods such as X-ray CT [42], magnetic resonance imaging (MRI) [9, 43], positron emission tomography (PET) [44], optical microscopic imaging (confocal fluorescent imaging, two-photon imaging [45], optical coherence tomography imaging (OCT) [46]), ultrasonography [47] and scanning electron microscopic (SEM) imaging are applied to visualize the renal parenchyma in the examination of glomeruli, renal tubules, renal arteries/veins and other renal tissue. Table 3 illustrates a comparison of the imaging techniques, performed on the kidney. The advantage of these imaging modalities is the ability to provide detailed structural and functional information on tissues and organs. The noninvasive characteristics of some imaging techniques exhibits the capability of visualizing full 3D reconstructions of renal vasculature, with or without additive imaging agents depending on imaging instruments.
26
Figure 7. Imaging techniques used in biomedical research. Many macroscopic imaging technologies (shown above the timeline)
are in routine clinical use, and there have been huge advances in their capabilities to obtain anatomical and physiological information since the beginning of the twentieth century. Shown here are some examples of bones (X-rays), soft tissue (ultrasound, MRI and CT rows), 3D organs (CT and MRI rows) and physiological imaging (MRI and PET rows) [41]. MSCT= Multislice computed tomography. LN-MRI= Lymphotropic nanoparticle enhanced magnetic resonance imaging.
Technique Resolution Time Depth Multi channel
Imaging agent used
Clinical use Reference
X-ray CT 50 µm Minutes No limit No Iodinated molecules, Barium particles, Carbon dioxide
Yes [42, 48]
MRI 10-100 µm Minutes to hours
No limit No Magnetic chelates, Magnetic particles Yes [9, 43] Ultrasound 50 µm Seconds to minutes cm No Microbubbles Yes [49] PET 1-2 mm Minutes to hours
No limit No 18F-, 64Cu- , 68Ga- or 11C-labelled compounds Yes [44] Multiphoton fluorescenc e imaging 1 µm Seconds to minutes 200 µm Yes Photoproteins, Fluorochromes No [45] Intravital microscopy 1 µm Seconds to minutes < 1 cm Yes Photoproteins, Fluorochromes Not yet [50] OCT 5-10 µm Seconds to minutes
1-2 mm No No need Not yet [46]
Table 3. Overview of imaging system performed on renal studies.
X-ray computer tomography
CT, equipped with an X-ray light source, is an imaging tool that has the high penetration capabilities to create 3D reconstruction visualizations of imaged subjects in clinical and medical research [51-54]. The interior structure of a sample examined by X-ray CT is globally extracted to differentiate the anatomic features of soft tissue and hard tissue (ex. bone skeleton) via phase-contrast signal, due to the difference of refractive index between cellular components of tissues [55]. For example, in bone imaging, X-ray CT is used as an accurate tool to precisely measure changes in bone stereology, volume and micro-architecture. Thanks to the 3D information extracted from biosamples while using micro-CT imaging, CT provides a feasible access to quickly and effectively assess phenotypic parameters of soft tissue [56].
27
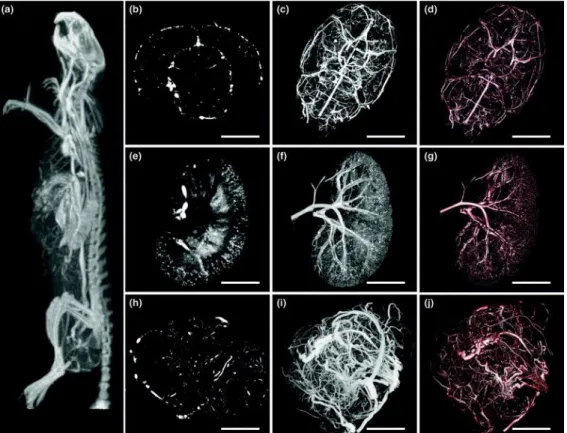
Vascular imaging in small animal is also made possible by either injecting blood contrast agents for in vivo imaging microvascular anatomy (Figure 5), or by in vitro casting vasculature with silicon-based
compounds [57, 58]. 3D volumetric imaging of microvasculature within the organ or the tumor allows for statistical examinations of the physical parameters within blood vessels in a quantitative manner, as well as the ability to observe the 3D architecture of vascular system while the organ remains intact. Hence, X-ray micro CT technology provides a means to explore the microvascular network, even with disease conditions in development.
Figure 5. Micrographs of micro-CT images in vasculature imaging. (A) A micro-CT projection through a clinical CT image of the
intact rat. A mammary fat pad tumor of 1.5 cm was developed in this animal. The visualization of microvascular network in the brain (B-D) and kidney (E-G), and abnormal vessels within the tumor (H-J) [59]. (B, E and H) are the projections of multiplanar reformatted images. (A, C, F and I) are the maximum intensity projections. (D, G and J) are the projections of volume rendering. Scale bar is 0.5 cm.
Magnetic resonance imaging based morphometric analysis of glomeruli in whole kidney
Recent renal studies using MRI imaging techniques show significant achievements in the examination of glomerular morphology and functional information [60-62]. Highly biocompatible MRI contrast agents are perfused into vasculature for in situ and in vivo bioimaging, followed by the quick elimination of contrast agents in 24 hours; which makes the later observations with other experiments workable without destruction damage [63-65]. The advantage of MRI imaging is that it holds the capability of creating a 3D quantitative
28
visualization of glomeruli, via labeling with MRI contrast agents against GBM in small animal models and human kidneys [62, 66].
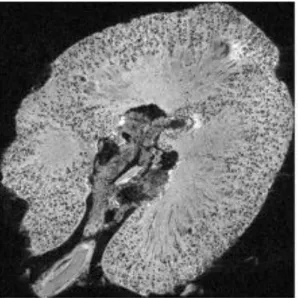
Figure 6. Micrograph of a 2D projection of 3D MR image of a human kidney injected with labelling image agent for the visualization of glomeruli. The MR image exhibited dark spots throughout the renal cortex of the agent-labeled kidneys. Each dark
spot in the cortex is ∼50–80% darker than the surrounding cortex [43]. Field of view = 6 × 10.5 cm3
Quantification of glomeruli in normal or diseased kidneys entails the examination of glomerular size, the total number and the pattern of distribution in a whole kidney of a dog, a rat and a human, respectively, based on in situ measurement of MRI data. This includes each glomerulus in kidney, and not the estimation used in stereology performed in histology [43, 62, 67]. Though there is a difference in afore mentioned information between MRI and stereology [68], it is important to note that the bias of estimation or measurement in different methodologies, and the heterogeneous nature of each kidney from the individuals [69]. The perfusion efficiency and leaking level of the MRI contrast agent within glomeruli is further examined to describe the histopathological change of correlation with glomerular morphology in some reports [61]. Architecture disorders of glomerular capillary, epithelial podocytes and glomerular basement membrane somehow contribute to protein leakage, reflecting on MRI image data by the distribution of the imaging contrast agent in the examined kidney.
Image processing and statistical analysis of the MRI signal should be preprocessed to eliminate noise inference and set a proper threshold for digital data computing, which may need supporting information acquired by other methodologies. The reports also indicated the concern of separating MRI signal changes from the blood- or the MRI contrast agent- artifacts that reduce false signals of glomeruli. The reconstructive digital data based on nondestructive sample preparation represents quantitative analysis in micrometer resolution, and takes significantly shorter time than that of the stereological method.
29
Renal ultrasonography morphology
Ultrasound (US) imaging in clinical use as well as medical studies has been frequently used to
visualize the interior structure of many organs, and also to monitor the stage of disease
progression in small animal models and human [70]. The advantages of US imaging is that it is an
inexpensive and noninvasive imaging modality that can be used in clinical diagnosis. Renal
ultrasonography is a feasible modality in diagnosis and prognosis for evaluating renal size, renal
mass, and symmetry (shape) of the kidney in the patients (Figure 7) [47, 71, 72]. Another
advantage of ultrasonography for bioimaging is the usage of contrast agents such as microbubbles
to compensate for the limitation of low sensitivity in small blood vessels (< 2 mm in diameter), and
provide an access point to perform serial examinations of the patient’s target disease [73]. Using
contrast agents in ultrasonography prevents the interference from any movement of examined
objectives, which may cause artifacts recorded in the data [74]
.
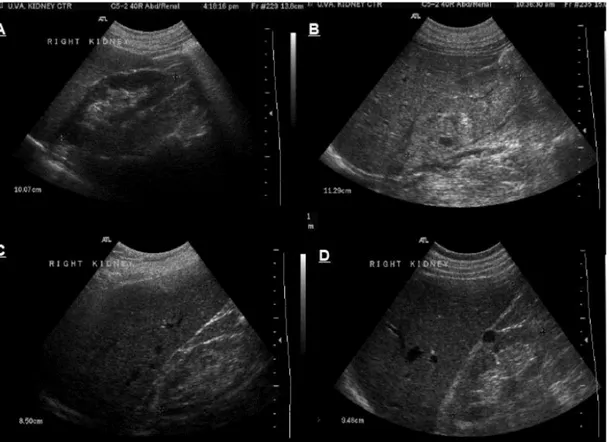
Figure 7. Ultrasonography of the kidney. (A) normal kidney, (B) enlarged and echogenic kidney with loss of differentiation between
cortical, medullary and sinus fat compartments in a case with acute kidney injury, (C) small, slightly echogenic kidney with thin cortex in a patient with chronic kidney disease and (D) normal size but echogenic kidney with a single simple cyst in a patient with chronic kidney disease secondary to diabetic nephropathy. [47]
High blood flow in the kidneys make US imaging quite suitable to be applied in the examination of renal vasculature. The morphological information of the whole renal vascularity, including the renal artery,
sub-30
capillary as well as renal hemorrhage can be revealed by the enhanced-Doppler signals of US imaging, and provides a fast and easy way to identify of vascular disorders and lesions in the kidney [49]. The global quantification work of renal vasculature is possible to reach in 3D US imaging with contrast agent-enhanced US imaging [75, 76]. The accessibility of US imaging coupled with physical microbubbles in clinical use has been why it has been proposed to study kidney impairment, but the renal function should be taken into concern, and not without regard to patient’s renal condition. However, lower resolutions, sensitivity and specificity of US imaging either in laboratory work or clinical use remain the barriers of fine examination in kidney studies. No report of US imaging shows the glomerular anatomy and function, though there are some studies that claim the supplementary role in diagnosing glomerular disease [77]. Exposure to mechanical ultrasound in the kidney can cause capillary hemorrhage of nephrons, leading to the consequence of nephron injury, observed in some reports [78, 79].
Microscopy techniques in histology
Hematoxylin and Eosin (H&E) staining as a basic tool for histopathology
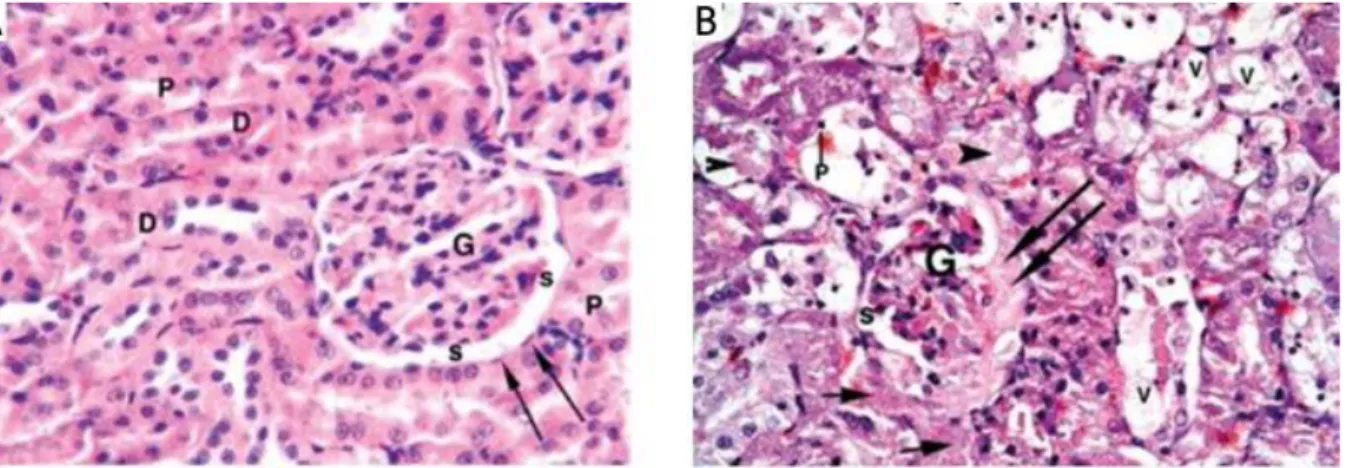
Using the H&E method to stain biosamples is the most common method, routinely used in histology to identify cellular components of tissue, and also to distinguish tissue morphology. The advantage of the H&E method in histopathology is to provide a well-acceptable standard by well-trained pathologists for determining the presence of disease, disease grading and the measurement of disease progression. As of recently, there are proposals of using automated computational methods in detecting and segmenting image datasets to perform the histological identification of shapes and topology on a series of 2D images, to be used in reconstructed image work [80, 81].
With the counterstaining of the nucleus in purple, and the eosinpholic structure in a different grade of red with chemical dyes, the classification of cellular components and the identification of the anatomic features of the tissue is aimed towards discriminating the markers for the pathological state, on the basis of the relevant analysis through light microscopy. Figure 8 exhibits the architecture of glomeruli and the renal tubules of the healthy kidney, and a pathological kidney damaged by the uptaking of mercuric chloride (HgCl2), examined by histopathological H&E staining [82].
31
Figure 8. H&E stained micrographs of renal tissue. (A) Normal glomerulus (G), parietal layer of Bowman's capsule (arrows) and
urinary spaces (s) in a control rat. Note: normal proximal convoluted tubules (P) and distal convoluted tubule (D) (H + E; 400×). (B) Interstitial exudate (short arrows), shrunken glomerulus (G) with fluid exudate (long arrows) filling the urinary spaces. Note: Cytoplasmic vacuolation (V); pyknotic nucleus (p) with intra-luminal cast formation (arrowhead) of the tubular epithelium in a rat fed with HgCl2 [82]. Fold= 400X
Fluorescent imaging of glomeruli for functional study
Through usage of fluorescent probing in the various molecules participating in structural organization and physiological processes, the mechanism and morphology involved can be examined with quantitation and visualization. Very specific labeling, with fluorescent probes directly against the molecules provides a reliable indication for representing the inherent information of biological samples. Thanks to the innovations of optical and physical developments in imaging modality, multiphoton image data is collected in sharp, high resolution, and with deep optical imaging capabilities greater than ten micrometers, which is the limited thickness for confocal laser imaging. When applied to in vivo animal imaging, the optical depth of imaging is demonstrated to be up to 150 μm below the surface, while imaging dissected thick specimens is around 1 mm via optical dissecting in z-axis with optimized focal depth step. To our understanding, multiparametric analysis of physiology and anatomy in biopsies offers a practical way to build 3D visualization of physiology in glomeruli via various labeling markers imaged by multiphoton microscopy. As another way, a simple fluorescent imaging without specific recognition can be performed to represent a glomerular structure by injecting fluorescent material into blood vasculature system (Figure 9) [83].
32
Figure 9. Micrograph of fluorescent microangiography of a glomerulus in kidney. The kidney was perfused with the mixture of
agarose and fluorescent microspheres before imaged by confocal fluorescent microscopy. The image represents of a 3D reconstructed projection of a glomerulus [83]. Scale bar = 100 m
Alternative method: Morphological visualization of glomerular vasculature by corrosion
casting-based investigation
Corrosion casting methods coupled with optical microscopic instruments have been used to study the microvascular architecture of biosamples such as tumor tissue, the brain, liver and kidney [84-88]. By perfusing resin particles that preserve the shape of blood vessels within the biosamples, the morphological variation of vasculature related to pathological states is stereologically examined to verify the grading of the disease, and locate the distorted vascular position. The reconstructed imaging of blood vessel networks of the casted biosamples is established by a variety of imaging modalities, such as SEM and X-ray microscopy [87, 89]. Recent studies indicate that the corrosion casting method, coupled with ultrahigh resolution Nano-CT X-ray microscopy, have shown improved imaging quality, with sub-micron resolution in the 3D geometric visualization of renal microvasculature (Figure 10) and glomerular capillary loop(Figure 11) [90].
33
Figure 10. The reconstructed micrograph of a dissected region of casted kidney by Nano-CT. The capillaries of the glomeruli
were resolved (large arrow) as well as peritubular capillaries (small arrow) which were irregular in shape and surrounded blank spaces normally are occupied by the proximal and distal tubules of the kidney [90]. Voxel resolution is 0.77 m.
Figure 11. The reconstructed micrograph of a casted glomerulus by Nano-CT. Branched capillaries were clearly resolved (Left).
34
Clinical imaging techniques for evaluating renal function in CKD
Medical imaging with proper tracing compounds are considered to be helpful in identifying the causes of CKD, as well as being able to characterize the features of CKD patients (Table 4) [91]. The method of measuring the kinetic curve of gadolinium (Gd) chelates contrast agent by MRI is used to trace glomeruli in certain studies [92, 93]. The time-density signals of contrast tracers by MRI could be useful for the estimation of functional imaging, with the statistical analysis of quantification of perfusion, quantification of glomerular filtration rate, estimation of tubular function. These measurements could parameterize renal function and/or renal morphology while using such contrast agents injected into kidney. With real-time 3D visualization of kidney morphometry, it is possible to access the activity of a single kidney on the basis of intrarenal tracer kinetics and differentiation between the global GFR of each kidney within patients. The examination of an MRI agent’s clearance in a specific kidney may feasibly allow for a more accurate diagnosis of renal disease, for both clinical management and reference information.
Similar to kinetic MRI measurement, another imaging option used to estimate the GFR value in a single kidney is the X-ray tomography, with a contrast agent for monitoring dynamic glomerular function based on tissue and vasculature density kinetics. The Renal Mass Index gathered by CT scanning acts as a potential indicator of GFR value, which exhibits high correlation with the measurement through clearance of iopromide. Absolute quantitative measurement of the concentration of a CT contrast agent in a perfused kidney allows for real time monitoring in GFR over time, as well as providing the anatomic information through angiography.
The potential limitation of imaging modalities in estimating GFR is the injection of contrast agents into the patients in clinics. Allegory response and nephrotoxicity induced by injected contrast agents may result in negative effects of renal disorder, especially those with poor renal efficiency.
35
Table 4. Imaging options in chronic kidney disease.
Emerging technique: Infrared spectral imaging in biochemical analysis
General information of IR spectromicroscop
y
Electromagnetic waves of infrared (IR) radiation span between the red end of the visible light, to the starting end of microwaves (780 nm to 1000 μm wavenumber), and is composed of three parts, recognized as near-IR, far-IR and mid-near-IR, respectively (Figure 12). For IR spectral investigation in biological specimens, the most commonly useful region is the mid-IR region between the wavelength 2.5 μm to 25 μm, corresponding to the frequency region in the unit of reciprocal centimeters, from 4000 cm-1 to 400 cm-1. In the mid-IR region,
the IR vibrational spectrum observed on biosamples contain many unique features of organic contents, which absorb a specific frequency of mid-IR radiation to enter the resonant state. The energy absorbed by intra- or inter- molecular bonds generates the periodic motion, resulting in a net charge in the dipole of electron density between the atoms of chemical groups within molecules, which is in turn related to atomic masses and the strength of chemical bonds. Therefore, this spectral variation is useful in the differentiation
36
of disease disorders through the analyzing of collected IR spectra signals. The advantage of Fourier transform (FT) IR spectrometers, coupled with microscopy for biomedical studies are thus becoming an analysis method with reproducible measurements on the sample, with spatial analytical capabilities of biochemical components of specimens, free-labeling from tracers in samples, and most importantly, the ability to acquire structural or functional signals of the biological components in their natural state.
Figure 12. Electromagnetic spectrum of wavelength and frequency and it bio-applications. Here is a classical electromagnetic
spectrum aligned with its common and established biomedical imaging application. IR region is located between visible and microwave regions with indication of red arrow [94].
FTIR spectral information in biological samples
The vibrational models of the molecular family of the biosamples can be quantitatively measured by mid-FTIR spectroscopy. For biological specimens, the most useful spectral regions are 1200-900 cm-1 for
carbohydrates, 1700-1480 cm-1 for protein and 3050-2800 cm-1 for lipids (Figure 13) [95, 96]. The recorded
wavenumber of specific molecules families of biosamples are quietly constant but the overlapping of the absorptions between different molecular families is observed because various molecules existed within the biosamples. Proteins mainly contribute to the absorption on Amide I region which peak is basically around 1650 cm-1 (the most vibrational mode is C=O stretching plus C–N stretching and N–H bending) and Amide
II region which peak is basically around 1540 cm-1 (N–H bending and C–N stretching). Lipids majorly
37
interval of 3050-2800 cm-1; another is for C=O stretching vibration peaked around 1740 cm-1. The absorption
of glycogen is majorly around 1030 cm-1. The PO-2 stretching vibrations attributed from nucleic acids are
peaked around 1080 cm-1 for symmetric vibration referring to s (PO2-) and around 1225 cm-1 for asymmetric
vibration referring to as (PO2-) [97]. Position and intensity of the absorption spectra (or bands) are
determined by the molecular and/or conformational structure (ex. -helix, -sheet, -turn and random coils of protein secondary structure [98]) of these components within the biosamples. These unique fingerprints of absorption spectra are useful to identify biochemical compositions of the biosamples and provide the information about the nature, the content, and microenvironment of the bio-components [99].
Figure 13. The typical biological spectrum on the spectral interval of 3000 cm-1 to 800 cm-1. Major biochemical components of
biosamples are assigned in their proper position on the spectrum. for stretching vibration; for bending vibration; s for symmetric vibration; as for asymmetric vibration [95].
FTIR imaging system
Modern FTIR spectro-microscopy has three major components: the IR light source, the interferometer and the detector to couple with the computer, in order to save the large data acquisitions composed of the whole of spectral information (Figure 14). A thermal light source such as a tungsten carbide Glowbar is a
38
convenient bench-top source of IR, providing continuous polychromatic IR radiation, which generates a wide range of frequencies spanning broad bands from 500 to 4000 cm-1. A monochromic laser IR source focuses
on a narrow range or a single frequency. Other available choices for IR light source are quantum-cascade lasers (QCLs) [100, 101] and synchrotron X-rays [102, 103] with the benefit of improved imaging quality [104]. For the imaging purposes of IR instruments, a detector with multi-channels arrays and a focal panel array (FPA) is equipped to perform microscopy for the faster collection of data, with over 4096 (64x64) pixels and more with each data acquisition [105]. These types of IR sensitive detectors are composed of a large number of small detectors arranged on a grid-like pattern, similar to the mapping system. For a sample model using IR spectromicroscopy, transmission, reflection and attenuated total reflection (ATR) are generally available for the users depending on the experiment requirements and sample characteristics.
Figure 14. The schematic layout of FTIR spectro-microscopy. The instrumentation of this FTIR modality represents the general
purposes, which includes transmission and the reflection model of sample configurations (only the transmissions model is shown in the layout), dual detectors for point mapping and imaging mapping, external interference and computer for data acquisition and processing [106] .
During the data acquisition of pixel spectra obtained from each grid point of a setting pattern by IR spectro-microscopy, equipped with a FPA detector, the individual spectral pixel renders the images corresponding to each wavenumber of a selected region. This presents a spectral work in term of FTIR imaging, which combines the spectral multiplexing and multichannel detection of optical microscopy (Figure 15) [107]. For bioscience, FTIR imaging on biosamples provides a resolved information pool specifically supported by the chemical characteristics examined from the spectra of complex tissue or cells [108, 109].
39
Figure 15. The 2D mapping of the individual formalin-fixed or air-dried cells by micro-FTIR. The FTIR images of the cells are
plotted by representing the integration of spectral intervals from a series of spectra, collected point by point scanning a selected area [107]. For the spectral range of 3000-2800 cm-1, the plot represents of the lipid intensity by the ratio of CH
3 to CH2 groups in lipids; for the interval between 1690 cm-1 and 1640 cm-1, the protein content is represented by the integration of amide I and amide II region.
Biomedical application of FTIR imaging
Since several decades ago, IR spectroscopic technique has been extensively used as an analytical tool in biological studies, the usage includes biofluids and complex tissue. In a few early studies, non-imaging IR works on the differentiation of tumor markers and the DNA features of cell lines. Xenografted tumor cells and tumor tissues gave examples of identifying pathological state [110, 111]. The development of microscopy allows this IR technique to not only be an alternative optical platform for histopathology in the laboratory, but also a promising technique in clinics [112, 113]. FTIR imaging modality is becoming able to routinely and rapidly provide high-quality data for experiment use, as well as be easily accessible to users [114].
Thanks to the technique innovations for IR modality, the improvements such as better sensitivity and spatially resolved information for chemical characterization of the biosamples as well as high throughput data recording makes this imaging approach be receiving an address for diagnostic and prognostic purposes. FTIR image data provides the morphological and biochemical information of the biosamples, which was thought to be useful in clinics. IR measurement on biofluids is also an ideal approach with the advancement of fast and non-invasive sample collection potential biomarkers for clinical purposes [115]. By using such methods, spectral fingerprint data of biofluids is available for histological classification by
![Figure 1. Schematic overview of the anatomy of a kidney. (A) Coronal section of the kidney; (B) schematic diagram of a nephron [9]](https://thumb-eu.123doks.com/thumbv2/123doknet/14446408.517827/16.918.119.807.683.1016/figure-schematic-overview-anatomy-coronal-section-schematic-diagram.webp)
![Table 1. The stages of chronic kidney disease based on the estimated GFR value [19].](https://thumb-eu.123doks.com/thumbv2/123doknet/14446408.517827/20.918.110.531.119.441/table-stages-chronic-kidney-disease-based-estimated-value.webp)
![Table 2. Renal biomarkers involved with pathological progress [40]. Abbreviations: ADMA, asymmetric dimethylarginine; AGE, advanced glycation end product; ANP, atrial natriuretic peptide; AOPP, advanced oxidation protein products; ApoA-IV, apolipoprotein](https://thumb-eu.123doks.com/thumbv2/123doknet/14446408.517827/25.918.100.817.123.971/biomarkers-pathological-abbreviations-asymmetric-dimethylarginine-glycation-natriuretic-apolipoprotein.webp)