HAL Id: hal-02964784
https://hal-univ-tlse3.archives-ouvertes.fr/hal-02964784
Submitted on 12 Oct 2020
HAL is a multi-disciplinary open access archive for the deposit and dissemination of sci-entific research documents, whether they are pub-lished or not. The documents may come from teaching and research institutions in France or abroad, or from public or private research centers.
L’archive ouverte pluridisciplinaire HAL, est destinée au dépôt et à la diffusion de documents scientifiques de niveau recherche, publiés ou non, émanant des établissements d’enseignement et de recherche français ou étrangers, des laboratoires publics ou privés.
Common Wall Lizard, Podarcis muralis, on Islands at Its
Northern Range
Sozos Michaelides, Nina Cornish, Richard Griffiths, Jim Groombridge, Natalia
Zajac, Graham Walters, Fabien Aubret, Geoffrey While, Tobias Uller
To cite this version:
Sozos Michaelides, Nina Cornish, Richard Griffiths, Jim Groombridge, Natalia Zajac, et al.. Phylo-geography and Conservation Genetics of the Common Wall Lizard, Podarcis muralis, on Islands at Its Northern Range. PLoS ONE, Public Library of Science, 2015, 10 (2), pp.e0117113. �10.1371/jour-nal.pone.0117113�. �hal-02964784�
Phylogeography and Conservation Genetics
of the Common Wall Lizard, Podarcis muralis,
on Islands at Its Northern Range
Sozos Michaelides1*‡, Nina Cornish2‡, Richard Griffiths3, Jim Groombridge3,
Natalia Zajac1, Graham J. Walters4, Fabien Aubret5, Geoffrey M. While1,6, Tobias Uller1,7*
1 Edward Grey Institute, Department of Zoology, University of Oxford, OX1 3PS, Oxford, United Kingdom, 2 States of Jersey, Department of the Environment, Howard Davis Farm, La Route de la Trinite, Trinity, Jersey, JE3 5JP, Channel Islands, United Kingdom, 3 Durrell Institute of Conservation and Ecology (DICE), School of Anthropology and Conservation, University of Kent, Canterbury, Kent, CT2 7NR, United Kingdom, 4 International Institute for Culture, Tourism and Development, London Metropolitan University, 277–281, Holloway Road, London, N7 8HN, United Kingdom, 5 Station d’Ecologie Expérimentale de Moulis, CNRS, 09200, Saint-Girons, France, 6 School of Biological Sciences, University of Tasmania, PO Box 55, Hobart, Tas, 7001, Australia, 7 Department of Biology, Lund University, Sölvegatan 37, SE 223 62, Lund, Sweden ‡ SM and NC are joint first authors on this work.
*sozos.michaelides@zoo.ox.ac.uk(SM);tobias.uller@zoo.ox.ac.uk(TU)
Abstract
Populations at range limits are often characterized by lower genetic diversity, increased ge-netic isolation and differentiation relative to populations at the core of geographical ranges. Furthermore, it is increasingly recognized that populations situated at range limits might be the result of human introductions rather than natural dispersal. It is therefore important to document the origin and genetic diversity of marginal populations to establish conservation priorities. In this study, we investigate the phylogeography and genetic structure of peripher-al populations of the common European wperipher-all lizard, Podarcis murperipher-alis, on Jersey (Channel Islands, UK) and in the Chausey archipelago. We sequenced a fragment of the mitochondri-al cytochrome b gene in 200 individumitochondri-als of P. murmitochondri-alis to infer the phylogeography of the island populations using Bayesian approaches. We also genotyped 484 individuals from 21 populations at 10 polymorphic microsatellite loci to evaluate the genetic structure and diversity of island and mainland (Western France) populations. We detected four unique haplotypes in the island populations that formed a sub-clade within the Western France clade. There was a significant reduction in genetic diversity (HO, HEand AR) of the island
populations in relation to the mainland. The small fragmented island populations at the northern range margin of the common wall lizard distribution are most likely native, with genetic differentiation reflecting isolation following sea level increase approximately 7000 BP. Genetic diversity is lower on islands than in marginal populations on the mainland, po-tentially as a result of early founder effects or long-term isolation. The combination of restric-tion to specific localities and an inability to expand their range into adjacent suitable
locations might make the island populations more vulnerable to extinction.
OPEN ACCESS
Citation: Michaelides S, Cornish N, Griffiths R, Groombridge J, Zajac N, Walters GJ, et al. (2015) Phylogeography and Conservation Genetics of the Common Wall Lizard, Podarcis muralis, on Islands at Its Northern Range. PLoS ONE 10(2): e0117113. doi:10.1371/journal.pone.0117113
Academic Editor: Jesus E. Maldonado, Smithsonian Conservation Biology Institute, UNITED STATES Received: July 23, 2014
Accepted: December 18, 2014 Published: February 6, 2015
Copyright: © 2015 Michaelides et al. This is an open access article distributed under the terms of the
Creative Commons Attribution License, which permits unrestricted use, distribution, and reproduction in any medium, provided the original author and source are credited.
Data Availability Statement: All relevant data are within the paper and its Supporting Information files. Funding: TU is supported by the Royal Society of London and the Knut and Alice Wallenberg Foundations. GMW was supported by an FP7 Marie Curie Fellowship. SM is supported by the Biotechnology and Biological Sciences Research Council (BBSRC) and the AG Leventis Foundation Trust. The funders had no role in study design, data collection and analysis, decision to publish, or preparation of the manuscript.
Introduction
There is a growing interest in the patterns and processes associated with geographical variation in population genetic structure across species’ ranges since these often shift, expand and con-tract over time [1–4]. Historical and contemporary changes to population size and gene flow influence genetic diversity and population differentiation [3,5]. These changes are particularly important in populations at geographical range limits, since these populations experience more rapid cycles of extinction, recolonization (with the associated founder events), severe popula-tion bottlenecks and asymmetric gene flow [3]. As a consequence, marginal populations tend to show greater than expected isolation by distance and have lower genetic diversity than popu-lations located within the species’ range [3]. They are therefore often of particular conservation interest [6,7].
To complicate matters, it is increasingly recognized that isolated populations at the edge of species’ distributions might not have dispersed, or become isolated, naturally but instead might have been assisted by humans. This has the potential to result in genetic admixture when ani-mals are introduced from multiple source populations. As a consequence of human-mediated dispersal and resulting admixture, marginal populations might actually show higher genetic diversity than geographically more central populations [8,9]. Therefore, it is important to es-tablish the origin of marginal populations to be able to assign conservation priorities. This is well exemplified by the changing status of the pool frog (Pelophylax lessonae) in Britain. Ini-tially considered to be present solely as a result of human introductions the native status of pool frogs was confirmed just in time to witness its extinction [10]. The species is now the focus of an active reintroduction program [11].
The common wall lizard (Podarcis muralis) exhibits a wide distribution across central and southern Europe. It also occurs in peripheral populations in Northern Europe where its status as a native species is debated. For example, while populations of wall lizards are known to be non-native in England [12] and parts of Germany [13], some isolated populations at the northern range limit in France, the Netherlands, and in Eastern Europe are of uncertain origin [14]. Of particular interest are populations on islands in the Golfe Normand-Breton, which were previ-ously part of the French continental landmass and have been separated following climate and sea level changes about 7,000 BP [15,16]. Jersey, the largest of Channel Islands (11,630ha) [17] and the Chausey archipelago (a group of islands, totaling 59ha) are now 25.5 and 17 km west of Nor-mandy Coast, respectively [17,18]. The presence and distribution of wall lizards on Jersey has been described by a number of authors [19–21] and it has been widely assumed that P. muralis is native to these islands. However, the species distribution on Jersey is noticeably patchy and re-stricted to old walls and ramparts on the north-eastern and eastern coast of the island [22], which suggests that they could have been introduced following the construction of the forts. Indeed, a population on the south east coastline of Jersey, cut off from the rest of the Island at high tide, is known to be a more recent introduction, although the origin of those animals is unknown [23].
The origin and genetic diversity of populations of P. muralis on the Channel Islands is of much interest as they are currently considered threatened and enjoy full protection status, de-spite that its present distribution is indicative of more recent introductions. Natural coloniza-tion of islands could have occurred from southern refugia, following climatic warming at the end of the Pleistocene and before the rising sea level, followed by separation from the main-land. Alternatively, colonization could have occurred subsequent to island isolation via rafting or the quarrying of granite. The aim of this study was to infer the origin of P. muralis popula-tions on Jersey and Chausey Island and investigate the population genetic structure and diver-sity in relation to mainland populations. Based on our results we discuss conservation implications for these peripheral populations.
Competing Interests: The authors have declared that no competing interests exist.
Materials and Methods
Study species
The European wall lizard, Podarcis muralis (Laurenti, 1768) has a wide distribution in central and southern Europe [24] and shows a strong phylogeographic structure with several genetical-ly and geographicalgenetical-ly distinct clades [25,26]. This genetic structure is likely to have originated during isolation in southern glacial refugia in Italy on the Apennine Peninsula [25], the Balkans and on the Iberian Peninsula [24,26]. The postglacial recolonization of western Europe ex-pands to the northwest along the French coast of the English Channel, across southern Belgium and southernmost Netherlands towards south-western Germany [24].
Sampling, sequencing and genotyping
We sampled 484 individuals from 21 populations between 2008 and 2013 (seeTable 1and Fig. 1in results section). We sampled lizards from all four locations on Jersey (St. Aubin Fort, Mont Orgueil Castle and Gorey, L’Etacquerel Fort and Fort Leicester, see Table C inS1 Filefor more information), from the Chausey archipelago (where the lizard is more widespread, see Table C inS1 Filefor more information) and from 19 populations in France (see Table C inS1 Filefor more information). We focused on mainland populations at the northwestern margin of the species distribution, i.e., close to the Channel Islands, but also included a number of pop-ulations in south-western France to compare the observed divergence between island popula-tions with divergence across the entire western France lineage.
Ethics Information
Lizards were captured by noosing, and a small (ca 5mm) part of the tail was removed by inducing tail release with a pair of tweezers or, when the tail was regrown, using surgical scis-sors to provide tissue for genetic analysis. All lizards were released at the site of capture follow-ing samplfollow-ing. The research was approved by the UK Home Office Ethical License PPL30/56 and all work and procedures during fieldwork were carried out under annual licenses and per-mits from the States of Jersey Government (Department of the Environment) and the French Government (Direction Régionale de l’Environnement, de l’Aménagement et du Logement).
DNA extraction, sequencing and genotyping
We extracted genomic DNA from tail tissue preserved in ethanol (70–90%) with DNeasy 96 plate kit (Qiagen, Valencia, CA) following manufacturer’s instructions (with overnight lysis). For the phylogenetic analysis we amplified a 656bp region of mitochondrion cytochrome b gene by polymerase chain reaction (PCR) using the primer pair LGlulk [50-AACCGCCTGTT GTCTTCAACTA-30] and Hpod [30-GGTGGAATGGGATTTTGTCTG-50] [12,26–28]. Am-plifications were carried out in a total volume of 15μl consisting of 7.5μl of MyTaq HS Mix (Bioline), 0.45μl (8pm) of each primer (Eurofins), 4.6μl PCR grade H2O and 2μl template
DNA. PCR conditions were as follows: an initial denaturation step at 94oC for 1 min, followed by 35 cycles at 94oC for 1 min, 53oC for 45sec and 72oC for 1 min and a final extension step at 72oC for 10min. PCR products were purified using the MinElute 96 UF PCR Purification Kit (Qiagen, Valencia, CA).
Sequencing reactions were carried out with BIGDye Terminator v3.1 Ready Reaction kit (Applied Biosystems, Warrington, UK) in both directions. Products were precipitated in iso-propanol and analysed on an ABI 3130 automated capillary sequencer (Applied Biosystems, Warrington, UK). Mitochondrial DNA sequences from both directions were corrected by eye and aligned to obtain a consensus sequence. Accepted sequences were then aligned using
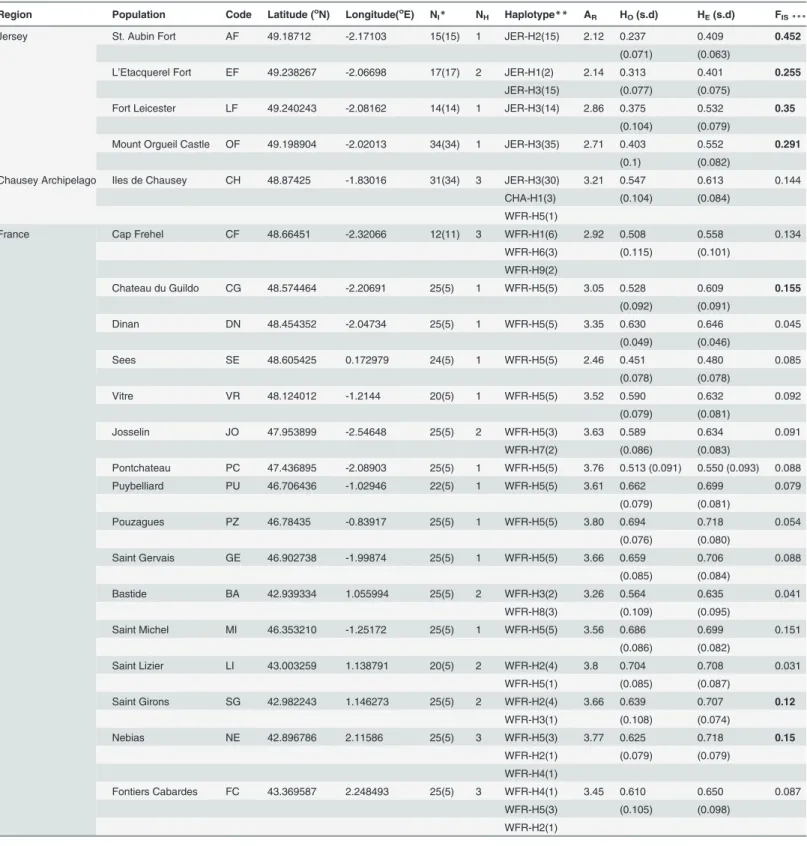
Table 1. Results from mtDNA and microsatellite analyses.
Region Population Code Latitude (oN) Longitude(oE) NI* NH Haplotype** AR HO(s.d) HE(s.d) FIS***
Jersey St. Aubin Fort AF 49.18712 -2.17103 15(15) 1 JER-H2(15) 2.12 0.237 0.409 0.452
(0.071) (0.063)
L’Etacquerel Fort EF 49.238267 -2.06698 17(17) 2 JER-H1(2) 2.14 0.313 0.401 0.255
JER-H3(15) (0.077) (0.075)
Fort Leicester LF 49.240243 -2.08162 14(14) 1 JER-H3(14) 2.86 0.375 0.532 0.35
(0.104) (0.079)
Mount Orgueil Castle OF 49.198904 -2.02013 34(34) 1 JER-H3(35) 2.71 0.403 0.552 0.291 (0.1) (0.082)
Chausey Archipelago Iles de Chausey CH 48.87425 -1.83016 31(34) 3 JER-H3(30) 3.21 0.547 0.613 0.144
CHA-H1(3) (0.104) (0.084)
WFR-H5(1)
France Cap Frehel CF 48.66451 -2.32066 12(11) 3 WFR-H1(6) 2.92 0.508 0.558 0.134
WFR-H6(3) (0.115) (0.101) WFR-H9(2) Chateau du Guildo CG 48.574464 -2.20691 25(5) 1 WFR-H5(5) 3.05 0.528 0.609 0.155 (0.092) (0.091) Dinan DN 48.454352 -2.04734 25(5) 1 WFR-H5(5) 3.35 0.630 0.646 0.045 (0.049) (0.046) Sees SE 48.605425 0.172979 24(5) 1 WFR-H5(5) 2.46 0.451 0.480 0.085 (0.078) (0.078) Vitre VR 48.124012 -1.2144 20(5) 1 WFR-H5(5) 3.52 0.590 0.632 0.092 (0.079) (0.081) Josselin JO 47.953899 -2.54648 25(5) 2 WFR-H5(3) 3.63 0.589 0.634 0.091 WFR-H7(2) (0.086) (0.083) Pontchateau PC 47.436895 -2.08903 25(5) 1 WFR-H5(5) 3.76 0.513 (0.091) 0.550 (0.093) 0.088 Puybelliard PU 46.706436 -1.02946 22(5) 1 WFR-H5(5) 3.61 0.662 0.699 0.079 (0.079) (0.081) Pouzagues PZ 46.78435 -0.83917 25(5) 1 WFR-H5(5) 3.80 0.694 0.718 0.054 (0.076) (0.080) Saint Gervais GE 46.902738 -1.99874 25(5) 1 WFR-H5(5) 3.66 0.659 0.706 0.088 (0.085) (0.084) Bastide BA 42.939334 1.055994 25(5) 2 WFR-H3(2) 3.26 0.564 0.635 0.041 WFR-H8(3) (0.109) (0.095) Saint Michel MI 46.353210 -1.25172 25(5) 1 WFR-H5(5) 3.56 0.686 0.699 0.151 (0.086) (0.082) Saint Lizier LI 43.003259 1.138791 20(5) 2 WFR-H2(4) 3.8 0.704 0.708 0.031 WFR-H5(1) (0.085) (0.087) Saint Girons SG 42.982243 1.146273 25(5) 2 WFR-H2(4) 3.66 0.639 0.707 0.12 WFR-H3(1) (0.108) (0.074) Nebias NE 42.896786 2.11586 25(5) 3 WFR-H5(3) 3.77 0.625 0.718 0.15 WFR-H2(1) (0.079) (0.079) WFR-H4(1) Fontiers Cabardes FC 43.369587 2.248493 25(5) 3 WFR-H4(1) 3.45 0.610 0.650 0.087 WFR-H5(3) (0.105) (0.098) WFR-H2(1)
* Number of individuals used in microsatellite analysis and in parenthesis the number of individuals used in mtDNA analysis. ** Number of individuals sharing the same haplotype is shown in parenthesis
*** Values in bold indicate significant deviation from Hardy-Weinberg equilibrium after correcting for multiple tests at the nominal level (5%), p>0.00024. NI(number of individuals), NH(number of haplotypes), AR(allelic richness), HO(observed heterozygosity), HE(expected heterozygosity) and FIS
(inbreeding coefficient). doi:10.1371/journal.pone.0117113.t001
MAFFT [29] implemented in GENEIOUS6.1.7 [30] and trimmed into a uniform length of 656 base pairs (bp). We translated the sequenced cyt-b region to amino acid sequences, to verify that no premature stop codons disrupted the reading frame. Unique sequences were submitted to GenBank under the accession numbers KP118978-KP118990.
To infer the genetic structure and diversity of our populations we genotyped 484 individuals at 10 polymorphic microsatellite loci; four described by Richard et al. [31] and six recently de-veloped by Heathcote et al.[32] (Table A inS1 File). Multiplexed PCRs were carried out in a total volume of 11μl reaction mix containing 1μl of genomic DNA, 5μl of Qiagen MasterMix, 0.2μl of each primer (forward and reverse in equal concentrations) and 3.8μl (for multiplex 1 and 2) or 3.6μl (for multiplex 3) of PCR grade dH2O. PCR conditions were as follows: 15min
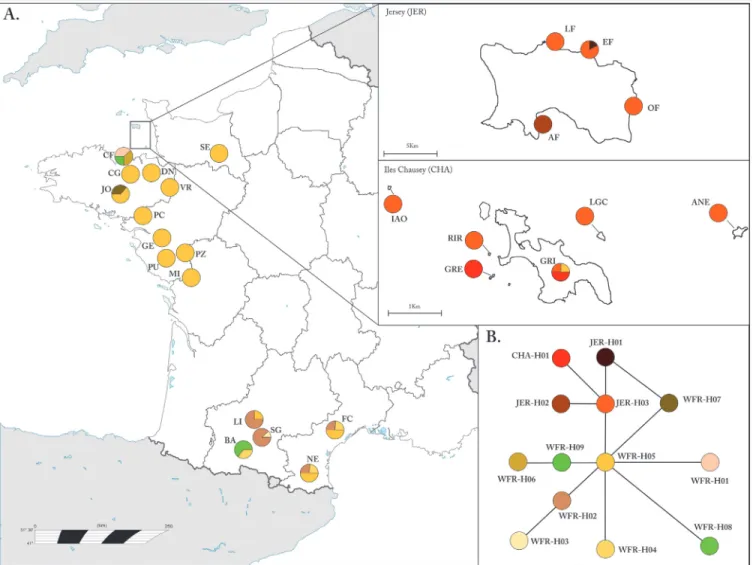
of initialization step at 95oC, 26 cycles of 30sec at 94oC, 90sec at 57oC (for multiplex 1 and 2) or 55oC (for multiplex 3) and 1min at 72oC and a final extension step of 20min at 60oC. The 5’-end of each forward primer was labeled with a fluorescent dye either 6-FAM, HEX or NED. PCR products were run with an internal ladder (red ROX-500), on an ABI 3130 genetic Fig 1. Distribution of sampled sites and haplotype network. (A) Pie charts indicate the percentage of sampled individuals matched to a specific haplotype (for population abbreviations seeTable 1). (B) Parsimonious phylogenetic network reconstructed from 13 unique haplotypes sampled in our populations using a median-joining algorithm.
analyser (Applied Biosystems Inc.) We scored alleles in GENEIOUS6.1.7 and any ambiguous peaks were repeated to confirm genotype.
Phylogenetic analyses
We used the phylogenetic tree approach to assign haplotypes to known lineages by combining our sequences with 68 sequences (of varying lengths), obtained from GenBank, across the native distribution of the species (see Table B inS1 File[13,25,26,33–36]). Three sequences belonging to P. siculus (AY185095) [37], P. liolepis (JQ403296) [38] and P. melisellensis (AY185097) [37] were used as outgroups in the phylogenetic analysis using Bayesian Inference (BI). We implemented BI analyses in MRBAYES[39] under the GTR+G+I nucleotide substitu-tion model as selected by the best-fit model applying the Akaike Informasubstitu-tion criterion (AIC) in MEGA5.2 [40]. The BI analysis was run with four chains of 1,000,000 generations and sampling every 100 trees. We discarded (burn-in-length) the first 10% of the trees after checking for con-vergence of the chains and the posterior probability branch support was estimated from the 50% majority-rule consensus tree.
To investigate evolutionary relationships of our sequences, we constructed a parsimonious phylogenetic network using a median—joining algorithm in Network v.4.6.12 [41]. The meth-od uses median vectors as a hypothetical ancestral sequence required to connect existing se-quences within the network with maximum parsimony.
Population genetics analyses
We checked the microsatellite data in MICROCHECKERV.2.2.3 [42] for null-alleles, large allele dropouts and scoring errors. Basic genetic diversity indices, observed and expected heterozy-gosities (HO, HE) were calculated with GENALEX6.5 [43] and allelic richness (AR) with FSTAT
v.2.9.3 [44,45]. Inbreeding coefficient (FIS) and deviations from Hardy-Weinberg equilibrium
were also evaluated at the 0.05 nominal level for multiple tests using sequential Bonferroni corrections in FSTATv.2.9.3 [44,45]. We compared HO, HE, ARin island versus mainland popu-lations with a Welch Two Sample t-test and evaluated the correlation between expected hetero-zygosity and latitude with a Spearman’s rank correlation test in R [46].
To infer population structure, we implemented a Bayesian analysis in STRUCTUREv.2.3.4 [47] using the admixture model [48]. The simulations were run with a burn-in of 100,000 iterations and a run length of 106iterations from K = 1 through 5. Runs for each K were replicated 10 times and the true K was determined according to the method described by Evanno et al [49] in the online software STRUCTUREHARVESTERv.0.6.93 [50]. We tested the level of genetic di-versity within populations, among populations and among groups (as defined by the structure clustering analysis) by hierarchical analysis of molecular variance (AMOVA, [51]) in ARLEQUIN 3.5.1.3 [52]. Population differentiation was assessed by calculating the FSTvalues and visualized
with a Principle Coordinate Analysis (PCoA) in GENALEX6.5 [43].
Results
Phylogeography
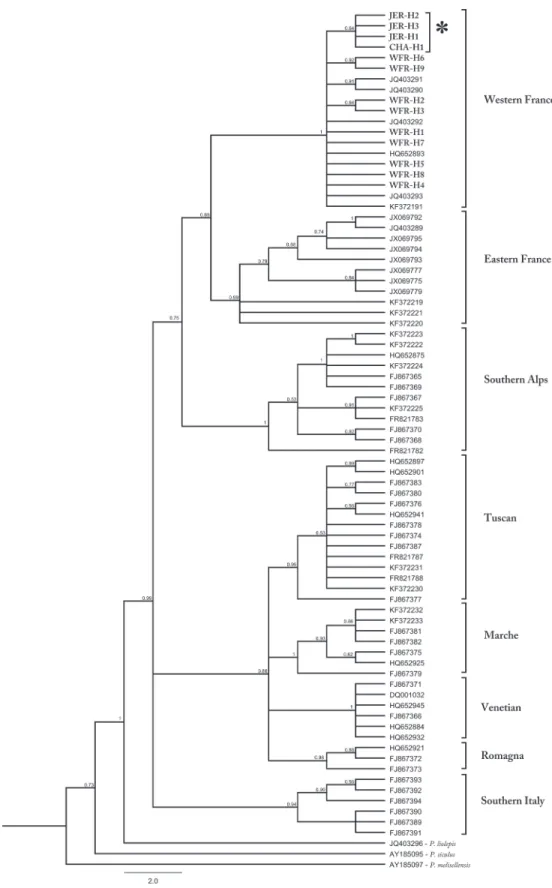
Analysis of mtDNA sequences of 192 individuals revealed 13 unique haplotypes all nested within the Western France Clade (Fig. 2). The most common haplotype on the mainland (France) was WFR-H5, which was also present on Chausey (one individual) but not on Jersey (Fig. 1A). The parsimony network showed that WFR-H5 has a central position among French haplotypes and JER-H3 forms the centre of the cluster of Jersey and Chausey haplotypes, which are distinct from the rest of the mainland populations (Fig. 1B).
Fig 2. Bayesian inference consensus tree derived from mitochondrial cyt-b sequences. Posterior probabilities (>0.5) are indicated above nodes. Haplotypes analyzed in this study are shown in bold and all were assigned to the Western France Clade. Haplotypes from Jersey and Chausey islands are indicated with an asterisk (*). For information on locality of the sequences see Table B inS1 File.
Population genetics
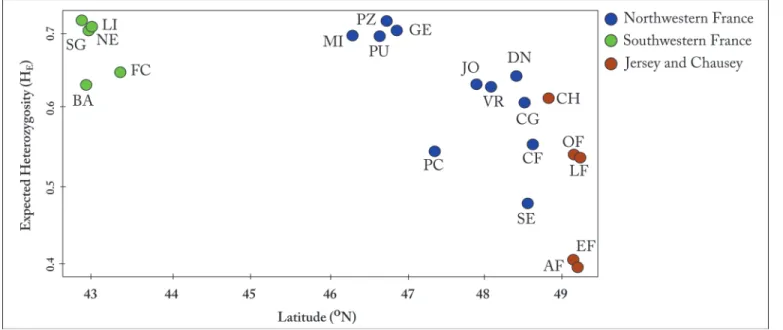
All 484 individuals were genotyped at 10 polymorphic loci, ranging from 10 to 56 alleles with mean number of 20.3 alleles per locus across all populations. Evidence of null alleles was ob-served in several loci but none were consistent across all populations, therefore we did not ex-clude them for further analysis (Table D inS1 File). Allelic richness, expected and observed heterozygosities (Table 1) were all significantly lower (p<0.05) in the island populations of Jer-sey and ChauJer-sey than in mainland France populations (Figure B inS1 File). There was a signif-icant negative correlation (r = -0.84, p <0.05) between latitude and expected heterozygosity (Fig. 3).
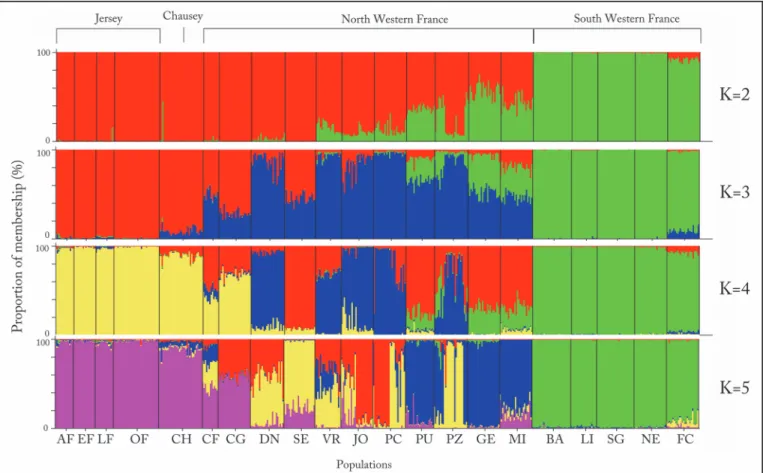
The Bayesian clustering approach implemented in STRUCTURE suggested K = 3 best-fit the genetic data (Fig. 4, see also Figure A inS1 File). The Principle Coordinate Analysis (PCoA) based on FSTvalues (see Table E inS1 File) between populations confirmed the results
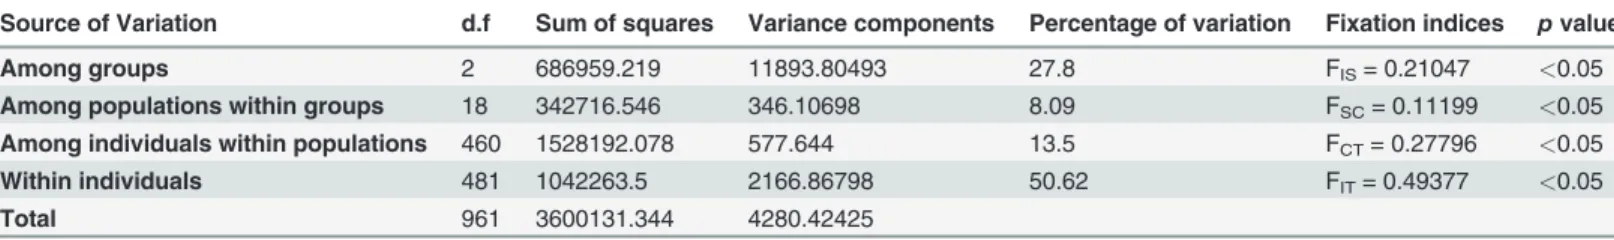
from STRUCTURE, identifying three clear groups corresponding to the samples from the Is-lands, North Western France and South Western France (Fig. 5). Analysis of Molecular Vari-ance (AMOVA) revealed that 28% of the genetic variation was found among the three groups (clusters) and 50% was found within individuals (Table 2).
Discussion
Our data provides strong evidence that the wall lizard populations on the islands in the English Channel belong to a single origin. Furthermore, the analyses suggest that this mtDNA clade has been isolated from the mainland for a long period of time and should be considered native. The most parsimonious explanation for the origin of the common wall lizard on Jersey and Chausey Islands appears to be that the increasing sea levels 7000 BP isolated island populations from the mainland and from each other, resulting in independent population histories and hence divergence. It remains possible, however, that there is occasional gene flow between is-lands. For example, the presence of lizards on very small islets in the Chausey archipelago [18], which are unlikely to be large enough to sustain populations for thousands of years, might Fig 3. Correlation between expected heterozygosity (HE) and latitude. There was a significant negative correlation (r = -0.84, p <0.05).
indicate that dispersal occasionally occurs between islands. In addition, the presence of the WFR-H5 haplotype on the island of Chausey, which is the most common haplotype on the mainland, might also provide evidence of occasional gene flow between mainland France and the islands. However, it could also be explained by retention of ancestral genetic variation or a more recent introduction. It is worth noting that a single isolated population on the coast of mainland France (Cap Frehel, CF;Fig. 1) also exhibits unique haplotypes, nevertheless it clus-ters with other mainland populations in all analyses.
Anecdotal evidence suggested that human mediated dispersal might be the most likely ex-planation for one of the four current locations in Jersey, the population on St. Aubin Fort [23]. Although our mtDNA data revealed a different haplotype from other Jersey populations, the nucDNA clusters all Jersey populations together. This suggests that the source population was most likely animals from other Jersey populations and that the difference in haplotype repre-sents a founder effect.
Overall, these results confirm the suspected native status of Jersey and Chausey wall lizards. Thus, the lower genetic diversity of island populations compared to the mainland populations is expected given the lack of gene flow. This might have significant implication for the long-term persistence of the species on Jersey and Chausey Islands. However, since our data suggests that the species have been present on the islands for thousands of years it might have already been subject to a severe bottleneck that purged deleterious recessives [53]. The species might also have undergone a substantial reduction in abundance more recently. Historical references Fig 4. Structure analysis (K = 2 to K = 5) for all individuals (n = 484). Each individual is represented by a vertical line partitioned into K coloured segments according to the proportion of membership (%) in each cluster. For population abbreviations seeTable 1.
to the species on Chausey, dated in 1842 [54], and subsequently work recorded the species as very common [55–58]. Despite this, the current distribution of the species on Jersey is very re-stricted [23]. One partial explanation for this is that lizards on Jersey were part of a wider pet trade, with lizards being sent from Jersey to England as far back as 1761[21]. Indeed, by 1947 the pet trade in lizards had reached such proportions that the local government (States of Jersey) passed the Wildlife Protection (Jersey) Law 1947, which prohibited the buying, selling, exportation or killing of all reptiles and amphibians of Jersey, as a measure to control the Fig 5. Principle Coordinate Analysis (PCoA) based on FSTvalues. Three population groups can be identified; the island populations on Jersey and
Chausey (bottom right), the north-western French populations (top cluster) and the south-western populations (bottom left). doi:10.1371/journal.pone.0117113.g005
Table 2. Hierarchical analysis of molecular variance (AMOVA)
Source of Variation d.f Sum of squares Variance components Percentage of variation Fixation indices p value
Among groups 2 686959.219 11893.80493 27.8 FIS= 0.21047 <0.05
Among populations within groups 18 342716.546 346.10698 8.09 FSC= 0.11199 <0.05
Among individuals within populations 460 1528192.078 577.644 13.5 FCT= 0.27796 <0.05
Within individuals 481 1042263.5 2166.86798 50.62 FIT= 0.49377 <0.05
Total 961 3600131.344 4280.42425
increased trade for these animals as pets destined for England (however, none of the contempo-rary non-native populations in England originate from Jersey [12]). Not only might this ex-plain the current patchy distribution of lizards on Jersey, it might also have contributed to their relatively low genetic variation.
Geographically peripheral populations are often representatives of relatively widespread species within different political boundaries [59]. Their conservation value depends upon their genetic divergence from other conspecific populations because of the synergetic effects of isola-tion, genetic drift, and natural selection. Whether these range-edge populations merit the con-servation effort that they are often subject to has been widely debated [6,60,61]. As this study clarified the native status of the wall lizard population on Jersey, it validates its current full pro-tection status under the Conservation of Wildlife (Jersey) Law 2000 (as amended). The law prohibits the unlicensed taking, sale, keeping, injury and destruction of places for shelter (e.g. nest, dens or burrows) and disturbance of any resident animals. Given our results, it is impor-tant that Jersey conservation planners recognize the wall lizard’s restricted distribution, vulner-ability to future inbreeding depression, susceptibility to disease, predation and the island’s ever-increasing urban development when developing species management strategies. For in-stance, should the granite walls and ramparts of historic fortresses where they are in highest abundance be developed or destroyed, the population’s continued survival could be placed at risk. The lizard’s long-term conservation status will depend upon increasing habitat connectivi-ty, especially via coastline protection to connect their north-eastern and eastern coast popula-tions on the island.
Supporting Information
S1 File. Table A, Details for the ten loci used in the study. Multiplexes one (1) and two (2) were developed by Heathcote et al. (2014) and multiplex three (3) was developed by Richard et al. (2012). Table B, List of sequence data used in the phylogenetic analysis. Information on sampling location, GenBank accession numbers and the reference study. Table C, Historical in-formation on the island populations of the wall lizard. Table D, Table of null alleles per popula-tion per locus. Bold values indicated significant deviapopula-tion from Hardy-Weinberg equilibrium (p<0.05). Table E, Matrix of pairwise FSTvalues. Figure A, Plot of Delta K (ΔΚ). Calculated as
in Evanno et al. (2005) from K = 2 to K = 4. Highest Delta K for K = 3. Figure B, Plots of genetic diversity indexes between island (group 1) and mainland populations (group 2). Genetic diver-sity is expressed as HO, HEand AR. Differences in the mean numbers were compared with a
Welch Two Sample t-test. (DOCX)
Acknowledgments
We would like to thank Hannah MacGregor for assisting in the field. We also thank Tod Reeder and one anonymous reviewer for useful comments that improved the manuscript.
Author Contributions
Conceived and designed the experiments: NC RG JG TU. Performed the experiments: SM NZ. Analyzed the data: SM. Contributed reagents/materials/analysis tools: TU RG JG. Wrote the paper: SM NC RG JG NZ GJW FA GMW TU. Sample and data collection: SM NC NZ GJW FA GMW TU.
References
1. Davis MB, Shaw RG (2001) Range shifts and adaptive responses to Quaternary climate change. Sci-ence 292: 673–679. PMID:11326089
2. Brown JH, Stevens GC, Kaufman DM (1996) THE GEOGRAPHIC RANGE: Size, Shape, Boundaries, and Internal Structure. Annual Review of Ecology and Systematics 27: 597–623.
3. Eckert CG, Samis KE, Lougheed SC (2008) Genetic variation across species' geographical ranges: the central-marginal hypothesis and beyond. Molecular Ecology 17: 1170–1188. doi: 10.1111/j.1365-294X.2007.03659.xPMID:18302683
4. Sexton JP, McIntyre PJ, Angert AL, Rice KJ (2009) Evolution and Ecology of Species Range Limits. Annual Review of Ecology, Evolution, and Systematics 40: 415–436.
5. Vucetich JA, Waite TA (2003) Spatial patterns of demography and genetic processes across the spe-cies’ range: Null hypotheses for landscape conservation genetics. Conservation Genetics 4: 639–645. 6. Lesica P, Allendorf FW (1995) When Are Peripheral Valuable Populations for Conservation?
Conserva-tion Biology 9: 753–760.
7. Hampe A, Petit RJ (2005) Conserving biodiversity under climate change: the rear edge matters. Ecolo-gy letters 8: 461–467. doi:10.1111/j.1461-0248.2005.00739.xPMID:21352449
8. Roman J, Darling JA (2007) Paradox lost: genetic diversity and the success of aquatic invasions. Trends in Ecology & Evolution 22: 454–464. doi:10.1136/sextrans-2014-051631PMID:25564675
9. Uller T, Leimu R (2011) Founder events predict changes in genetic diversity during human-mediated range expansions. Global Change Biology 17: 3478–3485.
10. Beebee TJC, Buckley J, Evans I, Foster JP, Gent AH, et al. (2005) Neglected native or undesirable alien? Resolution of a conservation dilemma concerning the pool frog Rana lessonae. Biodiversity and Conservation 14: 1607–1626.
11. Buckley J, Foster J (2005) Reintroduction Strategy for the Pool Frog Rana Lessonae in England. Peterborough.
12. Michaelides S, While G, Bell C, Uller T (2013) Human introductions create opportunities for intra-specif-ic hybridization in an alien lizard. Biologintra-specif-ical Invasions 15: 1101–1112.
13. Schulte U, Thiesmeier B, Wayer W, Schweiger S (2008) Allochthone Vorkommen der Mauereidechse (Podarcis muralis) in Deutschland. Zeitschrift für Feldherpetologie 15: 139–156. doi:10.1107/ S0108767309007235PMID:19349661
14. Schulte U (2008) Die Mauereidechse. Bielefeld, Germany: Laurenti Verlag. PMID:25506952
15. Jones RL (1993) Late Devensian and Flandrian environmental changes. In: Keen DH, editor. The Qua-ternary of Jersey: Field Guide. London: QuaQua-ternary Research Association. pp. 35–48.
16. Livory A (1997) « La flore de Chausey: un archipel sous la loupe des botanistes ». 87. 17. Berry RJ (2009) Islands. London: HarperCollins.
18. Walters GJ, Ineich I (2006) Insular populations of the lizard Podarcis muralis at the northwestern limit of its range Bulletin de la Societe zoologique de France 131.
19. Ansted DT, Latham RG (1865) The Channel Islands. London: Wm. H. ALLEN & CO. PMID:20744550
20. Sinel J (1908) The reptilia, batrachia and mammalia of the Channel Islands—their origin and modifica-tion by isolamodifica-tion. Transacmodifica-tions of La Société Guernesiaise 4: 466–472.
21. Le Sueur F (1976) A Natural History of Jersey. London & Chichester: Phillimore & Co. Ltd. 221 p. PMID:25032409
22. Avery RA, Perkins CM (1989) The use of faecal counts for estimating populations of wall lizards (Podar-cis muralis). Journal of the Zoological Society London 217: 73–84.
23. Cornish N (2011) Genetic Diversity and Conservation of Wall Lizards (Podarcis muralis) in Jersey, Brit-ish Channel Islands. 76 p.
24. Gruschwitz M, Böhme W (1986) Podarcis muralis (Laurenti, 1768)—Mauereidechse. Handbuch der Amphibien und Reptilien Europas Bandll/2, Echsen (Sauria) III (Lacertidae lIl; Podarcis). Aula-Verlag, Wiesbaden. pp. 155–208.
25. Giovannotti M, Nisi-Cerioni P, Caputo V (2010) Mitochondrial DNA sequence analysis reveals multiple Pleistocene glacial refugia for Podarcis muralis (Laurenti, 1768) in the Italian Peninsula. Italian Journal of Zoology 77: 277–288.
26. Schulte U, Hochkirch A, Loetters S, Roedder D, Schweiger S, et al. (2012) Cryptic niche conservatism among evolutionary lineages of an invasive lizard. Global Ecology and Biogeography 21: 198–211. 27. Deichsel G, Schwiger S (2004) Podarcis muralis (common wall lizard). Herpetological Review 35:
28. Podnar M, Haring E, Pinsker W, Mayer W, Ballantine WJ (2007) Unusual origin of a nuclear pseudo-gene in the Italian wall lizard: intergenomic and interspecific transfer of a large section of the mitochon-drial genome in the genus Podarcis (Lacertidae). Journal of molecular evolution 64: 308–320. PMID:
17225967
29. Katoh K, Misawa K, Kuma K, Miyata T (2002) MAFFT: a novel method for rapid multiple sequence alignment based on fast Fourier transform. Nucleic acids research 30: 3059–3066. PMID:12136088
30. Drummond AJ, Ashton B, Buxton S, Cheung M, Cooper A, et al. (2011) Geneious v6.1.7. pp. Available:
http://www.geneious.com/.
31. Richard M, Stevens VM, Hénanff ML, Coulon A (2012) Fourteen new polymorphic microsatellite loci for the wall lizard Podarcis muralis (Sauria: Lacertidae). Molecular Ecology Resources: 1–5.
32. Heathcote RJP, Dawson DA, Uller T (2014) Characterisation of nine European wall lizard (Podarcis muralis) microsatellite loci of utility across sub-species. Conservation Genetics Resources. 33. Gassert F, Schulte U, Husemann M, Ulrich W, Rodder D, et al. (2013) From southern refugia to the
northern range margin: genetic population structure of the common wall lizard, Podarcis muralis. Jour-nal of Biogeography 40: 1475–1489.
34. Salvi D, Harris DJ, Kaliontzopoulou A, Carretero Ma, Pinho C (2013) Persistence across Pleistocene ice ages in Mediterranean and extra-Mediterranean refugia: phylogeographic insights from the com-mon wall lizard. BMC evolutionary biology 13: 147. doi:10.1186/1471-2148-13-147PMID:23841475
35. Bellati A, Pellitteri-Rosa D, Sacchi R, Nistri A, Galimberti A, et al. (2011) Molecular survey of morpho-logical subspecies reveals new mitochondrial lineages in Podarcis muralis (Squamata: Lacertidae) from the Tuscan Archipelago (Italy). Journal of Zoological Systematics and Evolutionary Research 49: 240–250.
36. Podnar M, Haring E, Pinsker W, Mayer W (2007) Unusual origin of a nuclear pseudogene in the italian wall lizard: Intergenomic and interspecific transfer of a large section of the mitochondrial genome in the genus Podarcis (Lacertidae). Journal of molecular evolution 64: 308–320. PMID:17225967
37. Podnar M (2004) Mitochondrial phylogeography of the Dalmatian wall lizard, Podarcis melisellensis (Lacertidae). Organisms Diversity & Evolution 4: 307–317. doi:10.1371/journal.pgen.1004811PMID:
25569806
38. Schulte U, Gassert F, Geniez P, Veith M, Hochkirch A (2012) Origin and genetic diversity of an intro-duced wall lizard population and its cryptic congener. Amphibia-Reptilia 33: 129–140.
39. Huelsenbeck JP, Ronquist F (2001) MRBAYES: Bayesian inference of phylogenetic trees. Bioinformat-ics 17: 754–755. PMID:11524383
40. Tamura K, Peterson D, Peterson N, Stecher G, Nei M, et al. (2011) MEGA5: Molecular Evolutionary Genetics Analysis using maximum likelihood, evolutionary distance, and maximum parsimony meth-ods. Molecular Biology and Evolution 28: 2731–2739. doi:10.1093/molbev/msr121PMID:21546353
41. Bandelt HJ, Forster P, Rohl A (1999) Median-joining networks for inferring intraspecific phylogenies. Molecular biology and evolution 16: 37–48. PMID:10331250
42. Van Oosterhout C, Hutchinson WF, Wills DPM, Shipley P (2004) Micro-Checker: Software for Identify-ing and CorrectIdentify-ing GenotypIdentify-ing Errors in Microsatellite Data. Molecular Ecology Notes 4: 535–538. 43. Peakall R, Smouse PE (2012) GenAlEx 6.5: genetic analysis in Excel. Population genetic software for
teaching and research—an update. Bioinformatics (Oxford, England) 28: 2537–2539. PMID:
22820204
44. Goudet J (1995) FSTAT (Version 1.2): A computer program to calculate F-statistics. Journal of Heredity 86: 485–486.
45. Goudet J (2001) FSTAT, a program to estimate and test gene diversities and fixation indices (version 2.9.3). Available:http://www.unil.ch/izea/softwares/fstat.html. 2.9.3 ed.
46. R Development Core Team (2011) R: A language and environment for statistical computing. Vienna, Austria: R Foundation for Statistical Computing. doi:10.1080/17437199.2011.587961PMID:
25473706
47. Pritchard JK, Stephens M, Donnelly P (2000) Inference of population structure using multilocus geno-type data. Genetics 155: 945–959. PMID:10835412
48. Falush D, Stephens M, Pritchard JK (2003) Inference of population structure using multilocus genotype data: Linked loci and correlated allele frequencies. Genetics 164: 1567–1587. PMID:12930761
49. Evanno G, Regnaut S, Goudet J (2005) Detecting the number of clusters of individuals using the soft-ware STRUCTURE: a simulation study. Molecular Ecology 14: 2611–2620. PMID:15969739
50. Earl Da, vonHoldt BM (2011) STRUCTURE HARVESTER: a website and program for visualizing STRUCTURE output and implementing the Evanno method. Conservation Genetics Resources 4: 359–361.
51. Excoffier L, Smouse PE, Quattro JM (1992) Analysis of molecular variance inferred from metric dis-tances among DNA haplotypes: application to human mitochondrial DNA restriction data. Genetics 131: 479–491. PMID:1644282
52. Excoffier L, Lischer HEL (2010) Arlequin suite ver 3.5: a new series of programs to perform population genetics analyses under Linux and Windows. Molecular Ecology Resources 10: 564–567. doi:10. 1111/j.1755-0998.2010.02847.xPMID:21565059
53. Leberg PL, Firmin BD (2008) Role of inbreeding depression and purging in captive breeding and resto-ration programmes. Molecular Ecology 17: 334–343. doi:10.1111/j.1365-294X.2007.03433.xPMID:
18173505
54. Quatrefages AD (1842) L'Archipel de Chausey. Souvenirs d'un naturaliste. La revue des deux mondes. 1–35.
55. Joseph-Lafosse P (1891) Le lezard vivipare et le lezard des murailles en Normandie. Bull Soc Linn Nor-mandie 5: 169–172.
56. Gadeau de Kerville H (1897) Faune de la Normandie. Fascicule 4. Reptiles, batraciens et poissons. 1–672.
57. Gadeau de Kerville H (1894) Recherches Sur Les Faunes Marine Et Maritime de la Normandie. Pre-mier voyage: egion de Granville et iles Chausey (Manche), juillet-aout 1893. 1–181.
58. Gibon Cd (1919) Un Archipel Normand: les Iles Chausey et leur histoire. L'ancre de marine. 541. 59. Bunnell FL, Campbell RW, Squires KA (2004) Conservation priorities for peripheral species: the
exam-ple of British Columbia. Canadian Journal of Forest Research. pp. 2240–2247.
60. Millar CI, Libby WJ (1991) Strategies for Conserving Clinal, Ecotypic, and Disjunct Population Diversity in Widespread Species. Genetics and Conservation of Rare Plants. pp. 149–170.
61. Hunter ML, Hutchinson A (1994) The Virtues and Shortcomings of Parochialism: Conserving Species That Are Locally Rare, but Globally Common. Conservation Biology 8: 1163–1165.