HAL Id: hal-02917133
https://hal.univ-lorraine.fr/hal-02917133
Submitted on 18 Aug 2020HAL is a multi-disciplinary open access archive for the deposit and dissemination of sci-entific research documents, whether they are pub-lished or not. The documents may come from teaching and research institutions in France or abroad, or from public or private research centers.
L’archive ouverte pluridisciplinaire HAL, est destinée au dépôt et à la diffusion de documents scientifiques de niveau recherche, publiés ou non, émanant des établissements d’enseignement et de recherche français ou étrangers, des laboratoires publics ou privés.
Multi-proteomic approach to predict specific
cardiovascular events in patients with diabetes and
myocardial infarction: findings from the EXAMINE trial
Joao Pedro Ferreira, Abhinav Sharma, Cyrus Mehta, George Bakris, Patrick
Rossignol, William White, Faiez Zannad
To cite this version:
Joao Pedro Ferreira, Abhinav Sharma, Cyrus Mehta, George Bakris, Patrick Rossignol, et al.. Multi-proteomic approach to predict specific cardiovascular events in patients with diabetes and myocardial infarction: findings from the EXAMINE trial. Clinical Research in Cardiology, Springer Verlag, 2020, �10.1007/s00392-020-01729-3�. �hal-02917133�
1 Multi-Proteomic approach to predict specific cardiovascular events in patients with diabetes and myocardial infarction: findings from the EXAMINE trial
João Pedro Ferreira, MD, PhD1; Abhinav Sharma, MD, PhD2; Cyrus Mehta, PhD3,4; George Bakris, MD5; Patrick Rossignol, MD, PhD1; William B. White, MD6; Faiez Zannad, MD, PhD1
1
Université de Lorraine, Centre d'Investigation Clinique- Plurithématique Inserm CIC-P 1433, Inserm U1116, CHRU Nancy Brabois, F-CRIN INI-CRCT (Cardiovascular and Renal Clinical Trialists), Nancy, France.
2
Division of Cardiology, McGill University Health Centre, Montreal, Quebec, Canada.
3
Cytel Corportation, Cambridge, Massachusetts, USA
4
Harvard T.H. Chan School of Public Health, Boston, Massachusetts, USA.
5
Department of Medicine, American Heart Association Comprehensive Hypertension Center, University of Chicago.
6
Calhoun Cardiology Center, University of Connecticut School of Medicine, Farmington, Connecticut.
Word-count: 3198 words (excluding abstract and references)
Correspondence to: Dr João Pedro Ferreira
Centre d'Investigation Clinique 1433 module Plurithématique CHRU Nancy - Hopitaux de Brabois
Tel : +33 (0) 3 83 15 73 15 Mail: jp7ferreira@hotmail.com
2 Abstract
Background: Patients with diabetes who had a recent myocardial infarction (MI) are at high-risk of
cardiovascular events. Therefore, risk assessment is important for treatment and shared-decisions. We used data from EXAMINE trial to investigate whether a multi-proteomic approach would provide specific proteomic signatures and also improve the prognostic capacity for determining the risk of cardiovascular death, MI, stroke, heart failure [HF], all-cause death, and combinations of these outcomes.
Methods: 93 circulating proteins (92 from the Olink® CVDII plus troponin) were assessed in 5,131
patients. Cox, competing-risks, and reclassification measures were applied.
Results: The clinical model showed good discrimination and calibration for all outcomes. On top of a
well calibrated clinical model that included age, sex, smoking, diabetes duration, history of MI (prior to the index MI of inclusion), history of HF hospitalization, history of stroke, atrial fibrillation, hypertension, systolic blood pressure, statin therapy, estimated glomerular filtration rate, and study treatment (alogliptin or placebo), troponin and BNP added prognostic information to the composite of cardiovascular death, MI, or stroke (∆C-index +5%) and cardiovascular death alone (∆C-index +7%). Troponin, BNP, and TRAILR2 added prognostic information on all-cause death and the composite of cardiovascular death or HF-hospitalization. HF-hospitalization alone was improved by adding BNP and Gal-9. For MI, troponin, FGF23, and AMBP added prognostic value, whereas for stroke only troponin added prognostic value (multi-proteomics improved C-index >3% [p<0.001] for all the studied outcomes). The addition of the final biomarker selection to the clinical model improved event reclassification (cNRI from +23% to +64%). Specifically, the addition of the biomarkers allowed a better classification of patients at low risk (as having “true” low risk) and patients and high risk (as having “true” high risk). These results were consistent for all the studied outcomes with even more marked differences in the fatal events.
Conclusions: The addition of multi-proteomic biomarkers to a clinical model in this population with
diabetes and a recent MI, allowed a better risk prediction and event reclassification, potentially helping for better risk assessment and targeted treatment decisions.
3
4 Background
The prevalence of type 2 diabetes is increasing worldwide; currently over 500 million adult people may have diabetes and this number will likely increase in the next decades1. Per year over 5 million people die due to complications of diabetes1. Beyond the fatal complications, diabetes is an important risk factor for the occurrence of non-fatal major adverse cardiovascular events (MACE), such as myocardial infarction (MI), stroke, and heart failure (HF)2. The occurrence of these events increases the risk of subsequent death and impairs quality of life, frequently accompanied by significant disability.
In patients with diabetes, intensive intervention with drug combinations and behavioural changes reduced cardiovascular complications and death3. Strategies for improving event prediction may be useful to implement preventive measures tailored to patients at higher risk for specific events; to attain this purpose one requires a better classification of risk. For example, knowing which patients are more likely to develop events such as HF, MI, or stroke may help in implementing strategies such as a more strict blood-pressure control, use of use of sodium-glucose cotransporter-2 inhibitors4-6, aggressive statin therapy and/or PCSK9 inhibitors7, 8, and/or non-VKA anticoagulants9, 10.
The addition of biomarkers (e.g., natriuretic peptides and troponin) to patients` clinical features has proven to add relevant prognostic information in many populations, including in patients with diabetes and coronary artery disease11-14. However, the application of a large proteomics
multimarker panels (including BNP and troponin) to study the occurrence of specific cardiovascular events in patients with type 2 diabetes and a recent MI is yet to be performed. Such approach may add relevant (clinical and research) information, about the prognosis and mechanisms associated with specific cardiovascular events.
The Examination of Cardiovascular Outcomes with Alogliptin versus Standard of Care (EXAMINE) trial sought to determine whether alogliptin was noninferior to placebo with respect to major cardiovascular events in patients with type 2 diabetes with recent acute coronary syndrome15, 16.
We used the EXAMINE trial data to investigate whether a multi-proteomic approach comprising 93 circulating proteins would: 1) present different proteomic signatures for each
5 cardiovascular outcome, and 2) if these proteins could improve the discrimination of the outcomes (cardiovascular death, MI, stroke, HF) and death on top of a well calibrated risk model.
Methods Study design
Details of the EXAMINE study design were previously published15, 17. A total of 5380 patients were randomized to either alogliptin or placebo. The median age was 61 years, 68% were male, the mean body mass index was 29 Kg/m2, and the median estimated glomerular filtration rate was 71
ml/min/1.73m2. In the overall population, alogliptin significantly reduced glycated hemoglobin without increasing the rates of major adverse cardiovascular events.
For the present analysis 5131 patients (95% of the total population) who had biomarker measurements were included.
The steering committee, consisting of academic members and three nonvoting representatives of the sponsor (Takeda Development Center Americas), designed and oversaw the conduct of the trial. An independent data and safety monitoring committee monitored the trial and had access to the unblinded data. The appropriate national and institutional regulatory authorities and ethics committees approved the study design, and all participants provided written informed consent.
Data and Resource Availability
The datasets generated during and/or analyzed during the current study are available from the corresponding author upon reasonable request.
Study patients
Patients were eligible for enrolment if they had received a diagnosis of type 2 diabetes mellitus, were receiving antidiabetic therapy (other than a DPP-4 inhibitor or GLP-1 analogue), and had had an acute coronary syndrome within 15 to 90 days before randomization. Further criteria for the diagnosis of type 2 diabetes included a glycated hemoglobin level of 6.5 to 11.0% at screening, or if the
antidiabetic regimen included insulin, a glycated hemoglobin level of 7.0 to 11.0%. Acute coronary syndromes included acute myocardial infarction and unstable angina requiring hospitalization. Major exclusion criteria were a diagnosis of type 1 diabetes, unstable cardiac disorders (e.g., New York
6 Heart Association class IV heart failure, refractory angina, uncontrolled arrhythmias, critical valvular heart disease, or severe uncontrolled hypertension), and dialysis within 14 days before screening.
Institutional Review Board approval was obtained and all patients provided informed consent to participate in the trial. The EXAMINE trial is registered in ClinicalTrials.gov with the number NCT00968708.
Study treatment
Patients were randomly assigned to receive alogliptin or placebo, administered in a double-blind fashion, in addition to standard-of-care treatment for type 2 diabetes mellitus. Throughout the study, patients were required to receive standard-of-care treatment for type 2 diabetes and cardiovascular risk factors according to regional guidelines.
End points
The primary endpoint was a composite of death from cardiovascular (CV) causes, nonfatal MI, or nonfatal stroke. For the present analysis we also studied HF endpoints, including a composite of CV death or HF hospitalization, and each individual component of the primary outcome, as well as all-cause mortality (ACM). The endpoint of hospital admission for heart failure (HF) was defined as an inpatient admission or an emergency department visit of more than 12h with clinical manifestations of HF. An independent central adjudication committee adjudicated all suspected primary endpoint events and other cardiovascular endpoints, as well as all deaths. The median follow-up time was 1.6 (1.0-2.2) years.
Clinical and biomarker measurements
Medical history and a physical examination were all recorded at baseline.
A large protein biomarker panel with 92 biomarkers from a wide range of pathophysiological domains was measured (Olink® CVDII panel) at baseline (randomisation). We selected this panel because it contains known human cardiovascular and inflammatory markers as well as some exploratory human proteins which may have potential as new markers of cardiovascular disease. These proteins are involved in multiple disease processes such as immune/inflammatory response, angiogenesis, coagulation and cell adhesion, for example. An overview of biomarkers, their full names, and Uniprot ID are presented in the supplemental table 1. In short, the biomarkers were
7 measured using a high-throughput technique using the Olink Proseek® Multiplex CVD II 96x96 kit, which measures 92 manually-selected cardiovascular-related proteins simultaneously in 1μl plasma samples. The kit uses a proximity extension assay (PEA) technology, where 92 oligonucleotide-labeled antibody probe pairs are allowed to bind to their respective target present in the sample. PEA is a homogeneous assay that uses pairs of antibodies equipped with DNA reporter molecules. When binding to their correct targets, they give rise to new DNA amplicons each ID-barcoding their
respective antigens. The amplicons are subsequently quantified using a Fluidigm BioMark™ HD real-time PCR platform. The platform provides Log2 normalized protein expression (NPX) data wherein a high protein value corresponds to a high protein concentration, but not an absolute quantification. For further details please see the supplemental Olink® addenda. In addition to the above referenced Olink® biomarkers, high-sensitivity troponin I (hsTnI; troponin) was measured on the ARCHITECT i2000SR analyser (Abbott Laboratories) for a total of 93 circulating biomarkers.
Statistical considerations
The selection of the variables to include in the clinical model was based on their clinical relevance and previous publications from the EXAMINE dataset18-20, and included age, sex, smoking, diabetes duration, previous MI, previous HF hospitalization, previous stroke, atrial fibrillation (AFib),
hypertension, systolic blood pressure, statin therapy, estimated glomerular filtration rate (eGFR based on the CKD-EPI formula21), and study treatment (alogliptin or placebo) allocation. These variables were used for adjustment in all the models (i.e. “forced” in the models) and the strength of their association with the study primary outcome is depicted in the Table 2, where the variables are ordered by their z-score (from higher to lower) after fitting a Cox model. The clinical model was well
calibrated (goodness of fit test p-value >0.10 for all the studied outcomes; supplemental figure 1) and showed moderate to good discrimination for all the outcomes (c-index ranging from 0.66 to 0.79 as described in the legend of the Table 2). On top of the clinical model we assessed the prognostic association of each individual biomarker correcting for false discoveries with a “false discovery rate” (FDR) of 0.01 as described by Benjamini and Hochberg22. Only the biomarkers that passed this 1% threshold (plus clinical covariate adjustment) were taken forward to the next steps. These results are fully shown in the supplemental tables 3 to 9. Taking the FDR1% biomarker selection, we then
8 performed a multivariable stepwise forward selection model with a p-value set at 0.05 for the
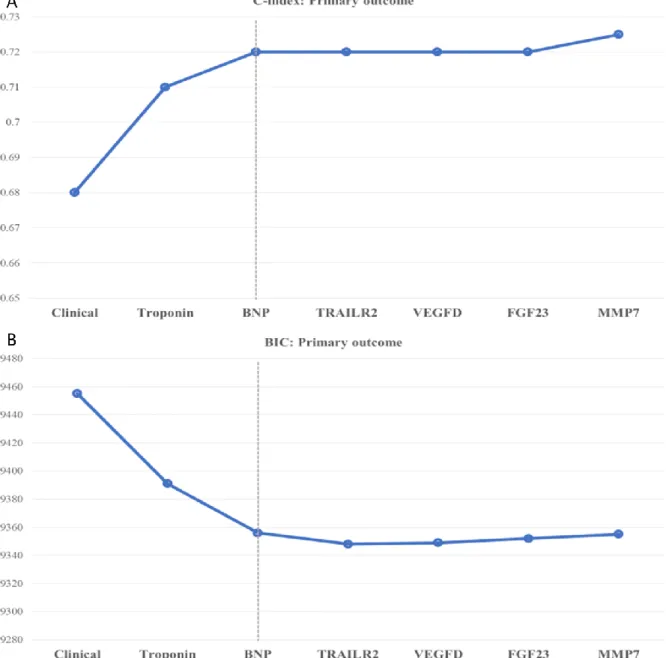
biomarkers to stay in the model (with the clinical variables “forced” in the model). These results are shown in the Table 3, where the biomarkers are ordered by decreasing value of their z-score. These selected biomarkers were poor to moderately correlated (Spearman Rho ≤0.5, with exception of TRAILR2 and AMBP with a Spearman Rho =0.6. Supplemental table 10). To further select which biomarkers added prognostic information of top of the clinical model, we assessed the Harrel`s C-statistics (“c-index”) and the Bayesian Information Criterion (BIC) for each biomarker in a sequential fashion starting with a clinical model alone and adding each biomarker by descending order of its prognostic strength (z-score) i.e. clinical model + biomarker 1, then clinical model + biomarker 1 + biomarker 2, etc. The C-statistic gives the probability that a randomly selected patient who
experienced an event had a higher risk score than a patient who had not experienced the event23. When fitting a model, it is possible to increase its likelihood by adding parameters (e.g. biomarkers), but doing so may result in overfitting; the BIC attempts to resolve this problem by introducing a penalty term for the number of parameters in the model, where the model with the lowest BIC is considered the best24. We then plotted the C-index and the BIC for each outcome by sequentially adding each biomarker and stopping when the C-index no longer improved and the BIC was at a minimum i.e. when the addition of more biomarker did not improve the c-index nor the BIC at a p-value threshold of 0.05. These results were consistent for all the outcomes and are presented in the Figure 1, supplemental figure 2, and Table 3 (blue cells). We then assessed the Net Reclassification Improvement (NRI) added by this “final” biomarker selection biomarkers on top of the clinical model by performing a 10-fold cross-validation with 1000x bootstrap NRI statistics. The NRI attempts to quantify how well the new model (e.g. clinical+biomarker) correctly reclassifies patients compared with the old model (e.g. clinical only). The NRI is composed of two components: 1) events and 2) no-events. Patients with (and without) events who were correctly reclassified by the new model are assigned a +1, and those who were incorrectly classified are assigned a -1. The sum of these two values is the NRI25. These results are presented in the Table 4 (a concrete example of NRI
interpretation is given in the legend of the Table 3). We then built a risk model derived from the linear predictor of each model (clinical or clinical plus biomarker) for each outcome, where each dependent
9 variable is multiplied by its β coefficient and then divided in quintiles with similar number of patients. Events and event rates per 100 patient-years were assessed by each quintile of risk based on the clinical risk model and the clinical plus biomarker model, independently. These results are presented in the Table 5 and plotted as a continuous function in the Figure 2. The patients` characteristics by quintiles of risk are presented in the supplemental table 11. Survival analysis were performed using Cox (for the primary outcome, CV death or HF hospitalisation, CV death and all-cause death) and competing-risk models (for HF hospitalizations, MI, and stroke) as described by Fine and Gray26, using death as competing risk. We have also performed the analysis of the top biomarkers stratified by sex to assess whether the prognostic values of these markers could vary by sex. For internal validation purposes we have also performed Least Absolute Shrinkage and Selection Operator (LASSO) with 10-fold cross validation model using 70% of the sample as training and 30% as test for the study primary outcome. All statistical analyses were performed with STATA (version 15).
Results
Patient characteristics
A total of 5131 patients were included in this study. The mean age was 61±10 years, 68% were male, the mean eGFR was 71±21 ml/min/1.73m2, the mean systolic blood pressure was 129±17 mmHg, and 30% were treated with insulin.
The study primary outcome occurred in 590 (11.5%) of the patients, the composite of CV death or HF hospitalization in 377 (7.3%), all-cause death in 302 (5.9%), CV death in 226 (4.4%), non-fatal MI in 345 (6.7%), non-fatal stroke in 60 (1.2%), and HF hospitalization in 185 (3.6%).
Supplemental table 2.
Patients who had an event were older, had longer diabetes duration, hypertension, prior MI, HF, stroke, peripheral artery disease, and atrial fibrillation more often, lower eGFR, and higher total and LDL cholesterol. Table 1.
Clinical model
The clinical model presented in the Table 2 was well calibrated (supplemental figure 1) and showed good discrimination for most of the studied outcomes: c-index =0.68 for the primary outcome of CV
10 death, MI, or stroke; c-index =0.75 for CV death; c-index =0.74 for all-cause death; c-index =0.76 for CV death or HFH; c-index =0.79 for HFH; c-index =0.66 for MI; and c-index =0.70 for stroke. Biomarker selection
The biomarker associations with the study outcomes is shown in the supplemental tables 3 to 9. Of these, troponin, BNP (brain natriuretic peptide), TRAILR2 (trail receptor 2 or death receptor 5), VEGFD (vascular endothelial growth factor D), FGF23 (fibroblast growth factor 23), and MMP7 (matrix metalloproteinase 7) were independently associated with the primary outcome after the stepwise selection; with troponin and BNP adding relevant prognostic information to the multivariable model (∆C-index +5%, p<0.001). For CV death the biomarkers with independent prognostic association were, BNP, troponin, TRAILR2, CEACAM8 (carcinoembryonic antigen related cell adhesion molecule 8) and VEGFD (vascular endothelial growth factor D); with BNP and troponin adding prognostic value (∆C-index +7%, p<0.001). For all-cause death the biomarkers with independent prognostic association were, BNP, troponin, TRAILR2, CEACAM8, ADAMTS13 (a disintegrin and metalloproteinase with a thrombospondin type 1 motif, member 13) and TF
(transferrin); with BNP, troponin and TRAILR2 adding prognostic value (∆C-index +6%, p<0.001). For the composite of CV death or HF hospitalization the biomarkers with independent prognostic association were, BNP, troponin, TRAILR2, VEGFD, and Gal-9 (galectin-9); with BNP, troponin and TRAILR2 adding prognostic value (∆C-index +4%, p<0.001). For the outcome of HF hospitalization alone the biomarkers with independent prognostic association were, BNP, Gal-9, VEGFD, FGF23, troponin, SCF (stem cell factor), GIF (gastric intrinsic factor); with BNP and Gal-9 adding prognostic value (∆C-index +17%, p<0.001). For the outcome of MI, the biomarkers with independent
prognostic association were, troponin, FGF23, AMBP, and MMP7; with troponin, FGF23 and AMBP adding prognostic value (∆C-index +3%, p<0.001). For the outcome of stroke, the biomarkers with independent prognostic association were, troponin and ADAMTS13; with troponin adding prognostic value (∆C-index +3%, p<0.001). Table 3, Figure 1, and supplemental figure 2. No biomarker-by-sex interaction was present (p for interaction >0.1 for all the studied outcomes).
11 Adding LDL cholesterol and c-reactive protein to the adjustment variables provided similar results, as did a 10-fold cross-validation LASSO for the primary outcome with 70% of the population as training and 30% test sets (supplemental appendix).
Event reclassification
The addition of the final biomarker selection (biomarkers marked “blue” in the Table 3) to the clinical model, held significant event reclassification, where both events and non-events were better classified by adding the selected biomarkers, with continuous NRI global improvement ranging from 23% to 64%. Table 4.
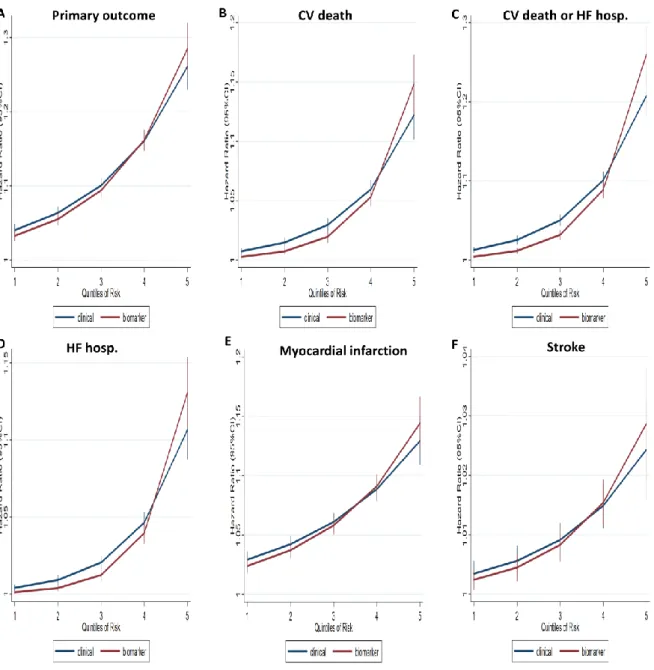
Events and clinical utility
Aligned with the above, the addition of the biomarkers allowed a better classification of patients at low risk (as having “true” low risk) and patients and high risk (as having “true” high risk). Table 5. For example, by diving the patients` risk in quintiles of risk the primary outcome event rate was of 2.6 and 4.4 events per 100py for the lowest 2 quintiles of risk (i.e. “low” risk) in the clinical model, compared with 2.0 and 3.5 events per 100py by adding the selected biomarkers. On the other hand, patients in the highest risk quintile had 18.6 events per 100py using the clinical model vs. 19.9 events per 100py by adding the selected biomarkers. These results were consistent for all the studied
outcomes with even more marked differences in the fatal events. This prognostic improvement can be visualized in the Figure 2.
By using the biomarker models (as compared with the clinical models alone), younger
patients and with less co-morbid conditions could be classified as “high risk”. Supplemental table 11. The summary of these findings in depicted in the Graphical Abstract.
Discussion
Our study shows that different CV outcomes may have different proteomic signatures and that BNP and troponin (the most widely used and validated biomarkers) were not retained in all the studied outcomes. Moreover, the addition of biomarkers to the clinical model in a population with diabetes and a recent MI, allows a better risk prediction and event reclassification, potentially identifying younger patients and with less comorbidities that are at higher risk than what would be apparent if one
12 would only use the clinical variables. These findings may have clinical implications by identifying patients with a greater margin for aggressive treatment with potential life-saving implications. To the best of our knowledge this is also the first large outcome study in among post-MI patients with diabetes using a large panel of biomarkers potentially related to cardiovascular disease.
A previous analysis of the EXAMINE trial demonstrated that troponin (baseline and seriated) has independent prognostic value in this population20. Troponin had a linear relationship with the studied cardiovascular outcomes, whereby even small elevations in this biomarker should raise alert. The strong and independent prognostic value of troponin in patients with and without diabetes and/or coronary artery disease has been extensively replicated and supports both the internal and external robustness of our findings14, 27. Troponin added prognostic value to all the studied outcomes, except HF hospitalization. Along with troponin, BNP was the other biomarker that showed a linear, strong and independent association with all the studied outcomes, except for MI and stroke where troponin was clearly more relevant; on the other hand, BNP was strongly associated with the occurrence of HF hospitalizations. In a previous report from the EXAMINE data, NT-pro BNP was the biomarker with the strongest association with HF hospitalization28. One may then suggest that these two biomarkers (BNP/NT-pro BNP and troponin) should be measured in all patients with diabetes with a MI. These two markers refined the prognosis in all the studied cardiovascular outcomes and also for all-cause death. Moreover, along with troponin, the strong and independent associations of natriuretic peptides with outcomes, have been replicated in patients with and without diabetes and/or coronary artery disease, adding important consistency to our findings13, 16, 29. On top of troponin and BNP, TRAILR2 came out as a strong and independent prognosticator for all-cause death and the composite of HF hospitalization or CV death. The TRAILR2 protein (otherwise known as death receptor 5) is a member of the TNF superfamily encoded by the TNFSF10 gene and is a receptor that preferentially induces apoptosis after binding of its ligand TRAIL30, 31. Increased levels of TRAILR2 have been associated with fatal events in patients with MI, possibly due to intensified apoptotic activity driven by TRAIL/TRAILR232, 33. It was recently found that TRAILR2 was also strongly associated with new-onset HF via mechanisms linked to inflammation and apoptosis34, once again reinforcing the robustness of these findings. Additionally, we also found that Gal-9 was strongly and independently
13 associated with HF hospitalizations, and FGF23 plus AMBP with MI, improving the prognostic models of the respective outcomes. Gal-9 is produced by the extracellular matrix and may be
increased in patients with ischemic cardiovascular disease35. Gal-9 has also been previously identified as strongly associated with new-onset HF34, via mechanisms linked to fibrosis and extra-cellular matrix remodelling. FGF23 is released by the osteocytes and is essential for the regulation of the metabolism of phosphate, calcium and vitamin D. Importantly, FGF23 promotes myocardial fibrosis and has been associated with coronary heart disease and HF34, 36, 37. Increased expression of AMBP has been associated with atherosclerotic cardiovascular disease and increased levels of c-reactive protein in patients with diabetes38, 39.
Troponin and/or BNP consistently added prognostic value across all the studied outcomes (BNP and troponin for the primary outcome, CV death and all-cause death; BNP alone for HF hospitalization; troponin alone for non-fatal MI and stroke), meaning that ischemia and myocardial stretch/heart failure are major drivers of cardiovascular outcomes in post-MI patients with type 2 diabetes. Therefore, strategies to reduce the burden of ischemia and myocardial stretch may improve outcomes in this population. These findings are supported by recent trials in patients with diabetes, where SGLT2-inhibitors and GLP-1 agonists reduced cardiovascular events possibly mediated by volume depletion and by myocardial ischemia reduction, respectively40, 41.
Beyond the prognostic and mechanistic implications of our findings, the use of biomarkers allowed a better reclassification of the outcomes. These findings are of particular relevance, because the use of biomarkers (on top of the clinical variables) allowed the classification of younger patients and with less comorbidities as “high-risk”; these younger patients may thrive more long-term benefit from aggressive treatment of diabetes and other cardiovascular conditions (e.g. hypertension,
dyslipidaemia). Current risk stratification strategies and guidelines do not routinely incorporate biomarkers, such as troponin and NT-pro BNP, for improving the prediction of risk in patients with diabetes42, 43. Our findings support a more widespread use of biomarkers for allowing a better risk prediction and event reclassification.
14 Several limitations should be acknowledged in this analysis. First, this is a post-hoc analysis of a prospective randomized trial, therefore all limitations inherent to such analysis are applied herein, including the inability to infer causality. Second, with exception of troponin, these biomarkers are expressed in arbitrary Log2 normalized NPX units (as detailed in the methods section and
supplemental material), therefore the inference of a ready-to-use clinical score is not possible at this stage, and the hazard ratios for each protein estimate the increase in the hazards of outcome associated with a doubling in the protein concentration. Third, we measured only one panel (CVDII) of 92 circulating proteins plus troponin; hence, we cannot ascertain whether a wider set of circulating proteins would provide additional information. Fourth, we did not perform external validation of our findings because we did not have access to a database/population with similar characteristics and with the same biomarkers. Despite not having such a replication cohort, we did random sampling and bootstrap analysis with internally consistent results. More importantly, all the biomarkers we found have been replicated in other studies, including cohorts with patients with and without diabetes. Notwithstanding, the absence of formal external replication is a limitation in our study44. Fifth, comparing our findings with a cohort of patients with a recent MI but without diabetes could also provide important insights on the disease processes, but such a dataset was not available to us. Sixth, left ventricular ejection fraction could provide important information but it is not available in the dataset. Lastly, only baseline (randomisation) Olink® samples were available and a biomarker follow-up determination could not be performed.
Conclusions
The addition of multi-proteomic biomarkers to a clinical model in this population with diabetes and a recent MI, showed that ischemia and myocardial stretch are major outcome drivers in this population, and allowed a better risk prediction and event reclassification, potentially helping for better risk assessment and targeted treatment decisions.
Availability of Data and Materials
15 Funding
None.
Disclosures
A.S is supported by a research grant from the Fonds de Recherche Sante – Quebec Junior Award, Alberta Innovates Health Solution Clinician Scientist fellowship, the European Society of Cardiology Young Investigator research grant, and has received research support from Roche Diagnostics, Boeringer-Ingelheim, Takeda, Akcea, and the Canadian Cardiovascular Society Bayer Vascular award. G.L.B., has received personal fees from Takeda Development Center, is a consultant for Merck, Relypsa, and is on the steering committee for international renal/CV outcomes trials for Janssen, Bayer, Vascular Dynamics. W.B.W has received research support from the National Institute of Aging (NIH) and personal fees from Takeda Development Center (Deerfield, IL, USA) during the conduct of the EXAMINE trial (Steering Committee Chair). F.Z has received fees for serving on the board of Boston Scientific; consulting fees from Novartis, Takeda, AstraZeneca, Boehringer
Ingelheim, GE Healthcare, Relypsa, Servier, Boston Scientific, Bayer, Johnson & Johnson, and Resmed; and speaking fees from Pfizer and AstraZeneca. No other potential conflicts of interest relevant to this article were reported.
Acknowledgments
EXAMINE is a clinical trial sponsored by Takeda Global Research and Development Center, Inc., Deerfield, IL. The authors are solely responsible for the design of the study, all study analyses, and the drafting and editing of the manuscript and its final contents.
Clinical trials identifier: Clinicaltrials.gov-NCT00968708.
JPF, PR, FZ are supported by a public grant overseen by the French National Research Agency (ANR) as part of the second “Investissements d’Avenir” programme (ANR-15-RHU-0004). All the other authors have nothing to disclose with regards to this manuscript.
16 JPF wrote the manuscript, performed the statistical analysis and made critical revisions; AS
contributed to discussion and reviewed/edited the manuscript; CM contributed to discussion and reviewed/edited the manuscript including the revision of the statistical methods and analysis; GB reviewed/edited the manuscript; PR reviewed/edited the manuscript; WBW reviewed/edited the manuscript; FZ contributed to discussion and reviewed/edited the manuscript.
Dr. João Pedro Ferreira is the guarantor of this work and, as such, had full access to all the data in the study and takes responsibility for the integrity of the data and the accuracy of the data analysis.
Bibliography
1. Ogurtsova, K.; da Rocha Fernandes, J. D.; Huang, Y.; Linnenkamp, U.; Guariguata, L.; Cho, N. H.; Cavan, D.; Shaw, J. E.; Makaroff, L. E., IDF Diabetes Atlas: Global estimates for the prevalence of diabetes for 2015 and 2040. Diabetes Res Clin Pract 2017, 128, 40-50.
2. Haffner, S. M.; Lehto, S.; Ronnemaa, T.; Pyorala, K.; Laakso, M., Mortality from coronary heart disease in subjects with type 2 diabetes and in nondiabetic subjects with and without prior myocardial infarction. N Engl J Med 1998, 339 (4), 229-34.
3. Gaede, P.; Lund-Andersen, H.; Parving, H. H.; Pedersen, O., Effect of a multifactorial intervention on mortality in type 2 diabetes. N Engl J Med 2008, 358 (6), 580-91.
4. Ettehad, D.; Emdin, C. A.; Kiran, A.; Anderson, S. G.; Callender, T.; Emberson, J.; Chalmers, J.; Rodgers, A.; Rahimi, K., Blood pressure lowering for prevention of cardiovascular disease and death: a systematic review and meta-analysis. Lancet 2016, 387 (10022), 957-67.
5. Fitchett, D.; Zinman, B.; Wanner, C.; Lachin, J. M.; Hantel, S.; Salsali, A.; Johansen, O. E.; Woerle, H. J.; Broedl, U. C.; Inzucchi, S. E., Heart failure outcomes with empagliflozin in patients with type 2 diabetes at high cardiovascular risk: results of the EMPA-REG OUTCOME(R) trial. Eur Heart J 2016, 37 (19), 1526-34.
6. Sharma, A.; Cooper, L. B.; Fiuzat, M.; Mentz, R. J.; Ferreira, J. P.; Butler, J.; Fitchett, D.; Moses, A. C.; O'Connor, C.; Zannad, F., Antihyperglycemic Therapies to Treat Patients With Heart Failure and Diabetes Mellitus. JACC Heart Fail 2018, 6 (10), 813-822.
17 7. Smolina, K.; Wright, F. L.; Rayner, M.; Goldacre, M. J., Determinants of the decline in
mortality from acute myocardial infarction in England between 2002 and 2010: linked national database study. Bmj 2012, 344, d8059.
8. Sabatine, M. S.; Giugliano, R. P.; Keech, A. C.; Honarpour, N.; Wiviott, S. D.; Murphy, S. A.; Kuder, J. F.; Wang, H.; Liu, T.; Wasserman, S. M.; Sever, P. S.; Pedersen, T. R., Evolocumab and Clinical Outcomes in Patients with Cardiovascular Disease. N Engl J Med 2017, 376 (18), 1713-1722. 9. Ferreira, J. P.; Girerd, N.; Alshalash, S.; Konstam, M. A.; Zannad, F., Antithrombotic therapy in heart failure patients with and without atrial fibrillation: update and future challenges. Eur Heart J 2016.
10. Cameron, C.; Coyle, D.; Richter, T.; Kelly, S.; Gauthier, K.; Steiner, S.; Carrier, M.; Coyle, K.; Bai, A.; Moulton, K.; Clifford, T.; Wells, G., Systematic review and network meta-analysis comparing antithrombotic agents for the prevention of stroke and major bleeding in patients with atrial fibrillation. BMJ Open 2014, 4 (6), e004301.
11. Pocock, S. J.; Ariti, C. A.; McMurray, J. J.; Maggioni, A.; Kober, L.; Squire, I. B.; Swedberg, K.; Dobson, J.; Poppe, K. K.; Whalley, G. A.; Doughty, R. N., Predicting survival in heart failure: a risk score based on 39 372 patients from 30 studies. Eur Heart J 2013, 34 (19), 1404-13.
12. Voors, A. A.; Ouwerkerk, W.; Zannad, F.; van Veldhuisen, D. J.; Samani, N. J.; Ponikowski, P.; Ng, L. L.; Metra, M.; Ter Maaten, J. M.; Lang, C. C.; Hillege, H. L.; van der Harst, P.; Filippatos, G.; Dickstein, K.; Cleland, J. G.; Anker, S. D.; Zwinderman, A. H., Development and validation of multivariable models to predict mortality and hospitalization in patients with heart failure. Eur J
Heart Fail 2017.
13. Wolsk, E.; Claggett, B.; Pfeffer, M. A.; Diaz, R.; Dickstein, K.; Gerstein, H. C.; Lawson, F. C.; Lewis, E. F.; Maggioni, A. P.; McMurray, J. J. V.; Probstfield, J. L.; Riddle, M. C.; Solomon, S. D.; Tardif, J. C.; Kober, L., Role of B-Type Natriuretic Peptide and N-Terminal Prohormone BNP as Predictors of Cardiovascular Morbidity and Mortality in Patients With a Recent Coronary Event and Type 2 Diabetes Mellitus. J Am Heart Assoc 2017, 6 (6).
18 14. Everett, B. M.; Brooks, M. M.; Vlachos, H. E.; Chaitman, B. R.; Frye, R. L.; Bhatt, D. L., Troponin and Cardiac Events in Stable Ischemic Heart Disease and Diabetes. N Engl J Med 2015, 373 (7), 610-20.
15. White, W. B.; Cannon, C. P.; Heller, S. R.; Nissen, S. E.; Bergenstal, R. M.; Bakris, G. L.; Perez, A. T.; Fleck, P. R.; Mehta, C. R.; Kupfer, S.; Wilson, C.; Cushman, W. C.; Zannad, F., Alogliptin after acute coronary syndrome in patients with type 2 diabetes. N Engl J Med 2013, 369 (14), 1327-35.
16. Zannad, F.; Cannon, C. P.; Cushman, W. C.; Bakris, G. L.; Menon, V.; Perez, A. T.; Fleck, P. R.; Mehta, C. R.; Kupfer, S.; Wilson, C.; Lam, H.; White, W. B., Heart failure and mortality outcomes in patients with type 2 diabetes taking alogliptin versus placebo in EXAMINE: a multicentre,
randomised, double-blind trial. Lancet 2015, 385 (9982), 2067-76.
17. White, W. B.; Bakris, G. L.; Bergenstal, R. M.; Cannon, C. P.; Cushman, W. C.; Fleck, P.; Heller, S.; Mehta, C.; Nissen, S. E.; Perez, A.; Wilson, C.; Zannad, F., EXamination of cArdiovascular outcoMes with alogliptIN versus standard of carE in patients with type 2 diabetes mellitus and acute coronary syndrome (EXAMINE): a cardiovascular safety study of the dipeptidyl peptidase 4 inhibitor alogliptin in patients with type 2 diabetes with acute coronary syndrome. Am Heart J 2011, 162 (4), 620-626.e1.
18. Hwang, Y. C.; Morrow, D. A.; Cannon, C. P.; Liu, Y.; Bergenstal, R.; Heller, S.; Mehta, C.; Cushman, W.; Bakris, G. L.; Zannad, F.; White, W. B., High-sensitivity C-reactive protein, low-density lipoprotein cholesterol and cardiovascular outcomes in patients with type 2 diabetes in the EXAMINE (Examination of Cardiovascular Outcomes with Alogliptin versus Standard of Care) trial. Diabetes
Obes Metab 2018, 20 (3), 654-659.
19. White, W. B.; Jalil, F.; Cushman, W. C.; Bakris, G. L.; Bergenstal, R.; Heller, S. R.; Liu, Y.; Mehta, C.; Zannad, F.; Cannon, C. P., Average Clinician-Measured Blood Pressures and
Cardiovascular Outcomes in Patients With Type 2 Diabetes Mellitus and Ischemic Heart Disease in the EXAMINE Trial. J Am Heart Assoc 2018, 7 (20), e009114.
19 20. Cavender, M. A.; White, W. B.; Jarolim, P.; Bakris, G. L.; Cushman, W. C.; Kupfer, S.; Gao, Q.; Mehta, C. R.; Zannad, F.; Cannon, C. P.; Morrow, D. A., Serial Measurement of High-Sensitivity Troponin I and Cardiovascular Outcomes in Patients With Type 2 Diabetes Mellitus in the EXAMINE Trial (Examination of Cardiovascular Outcomes With Alogliptin Versus Standard of Care). Circulation 2017, 135 (20), 1911-1921.
21. Ferreira, J. P.; Girerd, N.; Pellicori, P.; Duarte, K.; Girerd, S.; Pfeffer, M. A.; McMurray, J. J.; Pitt, B.; Dickstein, K.; Jacobs, L.; Staessen, J. A.; Butler, J.; Latini, R.; Masson, S.; Mebazaa, A.; Rocca, H. P.; Delles, C.; Heymans, S.; Sattar, N.; Jukema, J. W.; Cleland, J. G.; Zannad, F.; Rossignol, P., Renal function estimation and Cockroft-Gault formulas for predicting cardiovascular mortality in population-based, cardiovascular risk, heart failure and post-myocardial infarction cohorts: The Heart 'OMics' in AGEing (HOMAGE) and the high-risk myocardial infarction database initiatives. BMC
Med 2016, 14 (1), 181.
22. Green, G. H.; Diggle, P. J., On the operational characteristics of the Benjamini and Hochberg False Discovery Rate procedure. Stat Appl Genet Mol Biol 2007, 6, Article27.
23. Harrell, F., Regression modeling strategies: with applications to linear models, logistic
regression, and survival analysis. New York, Springer: 2001
24. Zhu, H.; Ibrahim, J. G.; Chen, Q., Bayesian Case-deletion Model Complexity and Information Criterion. Stat Interface 2014, 7 (4), 531-542.
25. Leening, M. J.; Vedder, M. M.; Witteman, J. C.; Pencina, M. J.; Steyerberg, E. W., Net reclassification improvement: computation, interpretation, and controversies: a literature review and clinician's guide. Ann Intern Med 2014, 160 (2), 122-31.
26. JP, F.; RJ, G., A proportional hazards model for the subdistribution of a competing risk. J Am
Stat Assoc 1999, 94 :496–509. .
27. de Lemos, J. A.; Drazner, M. H.; Omland, T.; Ayers, C. R.; Khera, A.; Rohatgi, A.; Hashim, I.; Berry, J. D.; Das, S. R.; Morrow, D. A.; McGuire, D. K., Association of troponin T detected with a
20 highly sensitive assay and cardiac structure and mortality risk in the general population. Jama 2010,
304 (22), 2503-12.
28. Sharma, A.; Vaduganathan, M.; Ferreira, J. P.; Liu, Y.; Bakris, G. L.; Cannon, C. P.; White, W. B.; Zannad, F., Clinical and Biomarker Predictors of Expanded Heart Failure Outcomes in Patients With Type 2 Diabetes Mellitus After a Recent Acute Coronary Syndrome: Insights From the EXAMINE Trial. J Am Heart Assoc 2020, 9 (1), e012797.
29. Huelsmann, M.; Neuhold, S.; Resl, M.; Strunk, G.; Brath, H.; Francesconi, C.; Adlbrecht, C.; Prager, R.; Luger, A.; Pacher, R.; Clodi, M., PONTIAC (NT-proBNP selected prevention of cardiac events in a population of diabetic patients without a history of cardiac disease): a prospective randomized controlled trial. J Am Coll Cardiol 2013, 62 (15), 1365-72.
30. Ramamurthy, V.; Yamniuk, A. P.; Lawrence, E. J.; Yong, W.; Schneeweis, L. A.; Cheng, L.; Murdock, M.; Corbett, M. J.; Doyle, M. L.; Sheriff, S., The structure of the death receptor 4-TNF-related apoptosis-inducing ligand (DR4-TRAIL) complex. Acta Crystallogr F Struct Biol Commun 2015,
71 (Pt 10), 1273-81.
31. Hymowitz, S. G.; Christinger, H. W.; Fuh, G.; Ultsch, M.; O'Connell, M.; Kelley, R. F.; Ashkenazi, A.; de Vos, A. M., Triggering cell death: the crystal structure of Apo2L/TRAIL in a complex with death receptor 5. Mol Cell 1999, 4 (4), 563-71.
32. Skau, E.; Henriksen, E.; Wagner, P.; Hedberg, P.; Siegbahn, A.; Leppert, J., GDF-15 and TRAIL-R2 are powerful predictors of long-term mortality in patients with acute myocardial infarction.
Eur J Prev Cardiol 2017, 24 (15), 1576-1583.
33. Ridker, P. M.; Luscher, T. F., Anti-inflammatory therapies for cardiovascular disease. Eur
Heart J 2014, 35 (27), 1782-91.
34. Ferreira, J. P.; Verdonschot, J.; Collier, T.; Wang, P.; Pizard, A.; Bar, C.; Bjorkman, J.; Boccanelli, A.; Butler, J.; Clark, A.; Cleland, J. G.; Delles, C.; Diez, J.; Girerd, N.; Gonzalez, A.; Hazebroek, M.; Huby, A. C.; Jukema, W.; Latini, R.; Leenders, J.; Levy, D.; Mebazaa, A.; Mischak, H.; Pinet, F.; Rossignol, P.; Sattar, N.; Sever, P.; Staessen, J. A.; Thum, T.; Vodovar, N.; Zhang, Z.
21 Y.; Heymans, S.; Zannad, F., Proteomic Bioprofiles and Mechanistic Pathways of Progression to Heart Failure. Circ Heart Fail 2019, 12 (5), e005897.
35. He, X. W.; Li, W. L.; Li, C.; Liu, P.; Shen, Y. G.; Zhu, M.; Jin, X. P., Serum levels of galectin-1, galectin-3, and galectin-9 are associated with large artery atherosclerotic stroke. Sci Rep 2017, 7, 40994.
36. Panwar, B.; Judd, S. E.; Wadley, V. G.; Jenny, N. S.; Howard, V. J.; Safford, M. M.; Gutierrez, O. M., Association of Fibroblast Growth Factor 23 With Risk of Incident Coronary Heart Disease in Community-Living Adults. JAMA Cardiol 2018, 3 (4), 318-325.
37. Hao, H.; Li, X.; Li, Q.; Lin, H.; Chen, Z.; Xie, J.; Xuan, W.; Liao, W.; Bin, J.; Huang, X.; Kitakaze, M.; Liao, Y., FGF23 promotes myocardial fibrosis in mice through activation of beta-catenin.
Oncotarget 2016, 7 (40), 64649-64664.
38. Liu, H.; Luo, D.; Qiu, Y.; Huang, Y.; Chen, C.; Song, X.; Gao, L.; Zhou, Y., The Effect of AMBP SNPs, Their Haplotypes, and Gene-Environment Interactions on the Risk of Atherothrombotic Stroke Among the Chinese Population. Genet Test Mol Biomarkers 2019, 23 (7), 487-494.
39. Wan, X.; Zhang, L.; Gu, H.; Wang, S.; Liu, X., The Association of Serum hsCRP and Urinary Alpha1-Microglobulin in Patients with Type 2 Diabetes Mellitus. Biomed Res Int 2019, 2019, 6364390.
40. Inzucchi, S. E.; Zinman, B.; Fitchett, D.; Wanner, C.; Ferrannini, E.; Schumacher, M.; Schmoor, C.; Ohneberg, K.; Johansen, O. E.; George, J. T.; Hantel, S.; Bluhmki, E.; Lachin, J. M., How Does Empagliflozin Reduce Cardiovascular Mortality? Insights From a Mediation Analysis of the EMPA-REG OUTCOME Trial. Diabetes Care 2018, 41 (2), 356-363.
41. Hernandez, A. F.; Green, J. B.; Janmohamed, S.; D'Agostino, R. B., Sr.; Granger, C. B.; Jones, N. P.; Leiter, L. A.; Rosenberg, A. E.; Sigmon, K. N.; Somerville, M. C.; Thorpe, K. M.; McMurray, J. J. V.; Del Prato, S., Albiglutide and cardiovascular outcomes in patients with type 2 diabetes and cardiovascular disease (Harmony Outcomes): a double-blind, randomised placebo-controlled trial. Lancet 2018, 392 (10157), 1519-1529.
22 42. Cosentino, F.; Grant, P. J.; Aboyans, V.; Bailey, C. J.; Ceriello, A.; Delgado, V.; Federici, M.; Filippatos, G.; Grobbee, D. E.; Hansen, T. B.; Huikuri, H. V.; Johansson, I.; Juni, P.; Lettino, M.; Marx, N.; Mellbin, L. G.; Ostgren, C. J.; Rocca, B.; Roffi, M.; Sattar, N.; Seferovic, P. M.; Sousa-Uva, M.; Valensi, P.; Wheeler, D. C., 2019 ESC Guidelines on diabetes, pre-diabetes, and cardiovascular diseases developed in collaboration with the EASD. Eur Heart J 2020, 41 (2), 255-323.
43. 10. Cardiovascular Disease and Risk Management: Standards of Medical Care in Diabetes-2020. Diabetes Care 2020, 43 (Suppl 1), S111-s134.
44. Cooney, M. T.; Dudina, A. L.; Graham, I. M., Value and limitations of existing scores for the assessment of cardiovascular risk: a review for clinicians. J Am Coll Cardiol 2009, 54 (14), 1209-27.
23 Table 1. Characteristics of the study population with vs. without a primary outcome event
Variable Primary outcome p-value No Yes N. 4541 590 Age, years 60.6 ± 9.9 63.8 ± 9.8 <0.001 Male sex 3107 (68.4%) 379 (64.2%) 0.041
Diabetes duration, years 6.8 (2.5, 13.3) 10.1 (4.7, 16.3) <0.001
Body mass index, Kg/m2 29.5 ± 5.5 29.7 ± 6.0 0.35
Smoking 634 (14.0%) 70 (11.9%) 0.16
Hypertension 3727 (82.1%) 543 (92.0%) <0.001
Prior myocardial infarction 3962 (87.2%) 549 (93.1%) <0.001
Prior heart failure diagnosis 1231 (27.1%) 241 (40.8%) <0.001
Prior stroke 279 (6.1%) 85 (14.4%) <0.001
Peripheral artery disease 389 (8.6%) 99 (16.8%) <0.001
Atrial fibrillation 285 (6.3%) 75 (12.7%) <0.001
Heart rate, bpm 71.3 ± 10.7 72.1 ± 11.6 0.11
Systolic blood pressure, mmHg 128.7 ± 16.5 132.3 ± 17.5 <0.001
Diastolic blood pressure, mmHg 76.5 ± 9.6 75.8 ± 10.6 0.12
Insulin use 1312 (28.9%) 229 (38.8%) <0.001 eGFR, ml/min/1.73 m2 72.0 ± 21.0 62.4 ± 22.8 <0.001 Total cholesterol, mg/dL 153.1 ± 43.0 164.2 ± 48.2 <0.001 LDL cholesterol, mg/dL 77.5 ± 33.9 87.3 ± 39.3 <0.001 HDL cholesterol, mg/dL 43.1 ± 10.4 43.4 ± 11.4 0.53 Triglycerides, md/dL 164.2 ± 105.6 167.5 ± 93.2 0.48
Legend: eGFR, estimated glomerular filtration rate.
The primary outcome was a composite of cardiovascular death, non-fatal myocardial infarction or non-fatal stroke.
24 Table 2. Clinical model for event prediction
Variables HR 95%CI z-score p-value
eGFR (per ml/min/1.73m2) 0.99 0.98 0.99 -5.7 <0.001
Stroke 1.75 1.40 2.20 4.9 <0.001
Previous HFH 1.49 1.26 1.75 4.7 <0.001 Myocardial infarction 1.93 1.41 2.63 4.1 <0.001 Diabetes duration (per year) 1.02 1.01 1.03 4.0 <0.001 Hypertension 1.70 1.25 2.31 3.4 0.001
SBP 1.01 1.00 1.01 3.3 0.001
Atrial fibrillation 1.51 1.18 1.92 3.3 0.001 Age (per year) 1.01 1.00 1.02 1.9 0.058
Smoking 1.14 0.89 1.47 1.1 0.29
Female 0.96 0.81 1.13 -0.5 0.61
Alogliptin 0.97 0.83 1.14 -0.4 0.71
Statin 0.99 0.76 1.31 -0.1 0.96
Legend: HFH, heart failure hospitalization; dur., duration; eGFR, estimated glomerular filtration rate; SBP, systolic blood pressure.
Variables ordered by their prognostic “importance” (z-score) for the primary outcome of cardiovascular death, MI or stroke.
C-index =0.68 for the primary outcome of cardiovascular (CV) death, MI, or stroke; =0.75 for CV death; =0.74 for all-cause death; =0.76 for CV death or HFH; =0.79 for HFH; =0.66 for MI; =0.70 for stroke.
Goodness of fit test p-value >0.10 for all the studied outcomes i.e. good model calibration (see also the Supplemental Figure 1).
25 Table 3. Multivariable final biomarker selection for each outcome (on top of the clinical model)
Biomarker HR 95%CI z-score p-value
Primary outcome (CV death, MI, stroke): C-index =0.73
TROPONIN 1.18 1.11 1.26 5.2 <0.001 BNP 1.11 1.06 1.17 4.1 <0.001 TRAILR2 1.25 1.06 1.48 2.6 0.008 VEGFD 1.33 1.06 1.68 2.4 0.015 FGF23 1.10 1.02 1.20 2.4 0.015 MMP7 1.10 1.02 1.19 2.4 0.015 CV death: C-index =0.82 BNP 1.29 1.19 1.41 5.9 <0.001 TROPONIN 1.23 1.12 1.35 4.2 <0.001 TRAILR2 1.45 1.11 1.88 2.8 0.006 CEACAM8 1.23 1.05 1.44 2.5 0.012 VEGFD 1.60 1.08 2.37 2.3 0.019
All-cause death: C-index =0.80
BNP 1.26 1.18 1.35 6.6 <0.001 TROPONIN 1.20 1.10 1.30 4.3 <0.001 TRAILR2 1.50 1.21 1.87 3.7 <0.001 CEACAM8 1.22 1.05 1.41 2.7 0.008 ADAMTS13 0.56 0.34 0.94 -2.2 0.028 TF 1.48 1.01 2.16 2.0 0.044 CV death or HFH: C-index =0.83 BNP 1.25 1.17 1.34 6.7 <0.001 TROPONIN 1.19 1.10 1.28 4.5 <0.001 TRAILR2 1.51 1.24 1.85 4.1 <0.001 VEGFD 1.88 1.38 2.56 4.0 <0.001
26 GAL9 1.46 1.04 2.05 2.2 0.031 HFH: C-index =0.86 BNP 1.16 1.05 1.28 3.4 0.004 GAL9 1.91 1.16 3.16 3.3 0.011 VEGFD 1.94 1.07 3.51 3.1 0.029 FGF23 1.16 1.03 1.31 3.0 0.014 TROPONIN 1.16 1.04 1.30 3.0 0.010 SCF 0.69 0.52 0.93 -2.3 0.015 GIF 0.90 0.82 0.99 -2.1 0.032 MI: C-index =0.69 TROPONIN 1.16 1.08 1.25 4.4 <0.001 FGF23 1.16 1.06 1.28 3.2 0.001 AMBP 2.08 1.26 3.44 2.8 0.004 MMP7 1.14 1.03 1.26 2.6 0.011 Stroke: C-index =0.73 TROPONIN 1.35 1.16 1.57 3.3 <0.001 ADAMTS13 0.22 0.10 0.51 2.5 <0.001
Legend: BNP, brain natriuretic peptide; TRAILR2, trail receptor 2 (or death receptor 5); VEGFD, vascular endothelial growth factor D; FGF23, fibroblast growth factor 23; AMBP,
alpha-1-microglobulin/bikunin precursor; MMP7, matrix-metalloproteinase 7; CEACAM8, carcinoembryonic antigen related cell adhesion molecule 8; ADAMTS13, a disintegrin and metalloproteinase with a thrombospondin type 1 motif, member 13; TF, transferrin; GAL9, galectin 9; SCF, stem cell factor; GIF, gastric intrinsic factor.
Light blue cells, biomarkers that add prognostic information to the multivariable model based on C-index and BIC improvement by the sequential addition (z-score based) of each individual biomarker to the clinical model, then the second biomarker was added to the clinical model plus the first biomarker, and henceforth (please see also the figure 1 and the supplemental figure 2).
27 All biomarkers are expressed in normalized NPX units, except Troponin expressed in Log2 units.
28 Table 4. Net Reclassification Improvement for the study outcomes
Outcome NRI% (95%CI) p-value (global)
Primary outcome: Clinical model vs. Clinical+Troponin+BNP
cNRI event 10% (4-16)
<0.001
cNRI non-event 26% (25-32)
cNRI global 37% (31-48)
CV death: Clinical model vs. Clinical+BNP+Troponin
cNRI event 29% (21-35)
<0.001
cNRI non-event 35% (31-37)
cNRI global 64% (52-70)
All-cause death: Clinical model vs. Clinical+BNP+Troponin+TRAILR2
cNRI event 28% (20-31)
<0.001
cNRI non-event 33% (29-36)
cNRI global 60% (49-65)
CV death/HFH: Clinical model vs. Clinical+BNP+Troponin+TRAILR2
cNRI event 26% (24-34)
<0.001
cNRI non-event 33% (31-36)
cNRI global 59% (57-70)
HFH: Clinical model vs. Clinical+BNP+Gal9
cNRI event 27% (16-37)
<0.001
cNRI non-event 26% (22-32)
cNRI global 53% (38-68)
MI: Clinical model vs. Clinical+Troponin+FGF23+AMBP
cNRI event 2% (1-10%)
<0.001
cNRI non-event 21% (16-25)
cNRI global 23% (21-33)
29
cNRI event 8% (-26-18)
<0.001
cNRI non-event 32% (28-38)
cNRI global 23% (2-50)
Legend: cNRI, continuous net reclassification improvement; BNP, brain natriuretic peptide;
TRAILR2, trail receptor 2 (or death receptor 5); Gal9, galectin 9; FGF23, fibroblast growth factor 23; AMBP, alpha-1-microglobulin/bikunin precursor.
For example, a cNRI of 10% for primary outcome events means that 10% of patients who had a primary outcome event and were classified incorrectly (i.e. as no event) by the clinical model have been reclassified correctly (i.e. as events) under the model that also includes troponin and BNP.
30 Table 5. Events and event-rates by the patients` risk profile
Outcome / Quintiles of risk
Clinical model Clinical + Biomarker(s) model* Events n. (%) Event-rate (100py) Events n. (%) Event-rate (100py) Primary outcome Q1 43 (4.0) 2.6 (1.9-3.4) 33 (3.3) 2.0 (1.5-2.9) Q2 74 (6.9) 4.4 (3.5-5.5) 56 (5.5) 3.5 (2.7-4.6) Q3 98 (9.2) 6.1 (5.0-7.4) 94 (9.3) 6.1 (5.0-7.5) Q4 143 (13.4) 8.9 (7.5-10.5) 140 (13.8) 9.3 (7.9-11.0) Q5 261 (24.4) 18.6 (16.4-21.0) 261 (25.8) 19.9 (17.6-22.4) Cardiovascular death Q1 7 (0.7) 0.4 (0.2-0.9) 4 (0.4) 0.2 (0.1-0.6) Q2 13 (1.2) 0.7 (0.4-1.3) 8 (0.8) 0.5 (0.3-1.0) Q3 40 (3.7) 2.3 (1.7-3.2) 23 (2.3) 1.4 (1.0-2.2) Q4 56 (5.2) 3.3 (2.5-4.3) 39 (3.9) 2.4 (1.8-3.3) Q5 124 (11.6) 7.9 (6.6-9.4) 148 (14.6) 10.1 (8.6-11.9) All-cause death Q1 15 (1.4) 0.9 (0.5-1.5) 9 (0.9) 0.5 (0.3-1.0) Q2 18 (1.7) 1.0 (0.7-1.6) 11 (1.1) 0.7 (0.4-1.2) Q3 46 (4.3) 2.7 (2.0-3.6) 40 (4.0) 2.5 (1.9-3.4) Q4 78 (7.3) 4.6 (3.7-5.7) 60 (5.9) 3.7 (2.9-4.8) Q5 167 (15.6) 10.6 (9.1-12.4) 178 (17.6) 12.2 (10.5-14.1)
Cardiovascular death or HF hospitalization
Q1 17 (1.6) 1.0 (0.6-1.6) 4 (0.4) 0.2 (0.1-0.6)
Q2 23 (2.2) 1.3 (0.9-2.0) 11 (1.1) 0.7 (0.4-1.2)
Q3 52 (4.9) 3.1 (2.3-4.0) 41 (4.1) 2.6 (1.9-3.5)
Q4 102 (9.5) 6.3 (5.2-7.7) 71 (7.0) 4.6 (3.6-5.7)
31 HF hospitalization Q1 5 0.3 (0.1-0.7) 1 (0.1) 0.1 (0.0-0.4) Q2 13 0.7 (0.4-1.3) 5 (0.5) 0.3 (0.1-0.7) Q3 24 1.4 (0.9-2.1) 15 (1.5) 0.9 (0.6-1.5) Q4 32 2.0 (1.4-2.8) 33 (3.2) 2.1 (1.5-2.9) Q5 119 8.0 (6.7-9.5) 129 (12.6) 9.5 (8.0-11.3) Myocardial infarction Q1 25 (2.3) 1.5 (1.0-2.2) 21 (2.1) 1.3 (0.8-2.0) Q2 56 (5.2) 3.3 (2.5-4.3) 43 (4.2) 2.7 (2.0-3.6) Q3 63 (5.9) 3.9 (3.0-5.0) 62 (6.1) 4.0 (3.1-5.1) Q4 81 (7.6) 5.1 (4.1-6.3) 73 (7.2) 4.9 (3.9-6.1) Q5 135 (12.6) 9.3 (7.9-11.0) 144 (14.2) 11.0 (9.3-12.9) Stroke Q1 5 0.3 (0.1-0.7) 3 (0.3) 0.2 (0.1-0.6) Q2 8 0.5 (0.2-0.9) 8 (0.8) 0.5 (0.2-1.0) Q3 8 0.5 (0.2-0.9) 5 (0.5) 0.3 (0.1-0.7) Q4 8 0.5 (0.2-0.9) 11 (1.1) 0.7 (0.4-1.2) Q5 32 2.0 (1.4-2.8) 34 (3.3) 2.2 (1.6-3.1)
Legend: Q, quintile of risk; HF, heart failure.
Each “risk model” was derived from the linear predictor (yj) of each model (clinical or biomarker) for
each outcome, where each dependent variable is multiplied by its β coefficient (e.g.,
yj=b1*x1j+b2*x2j+···+bk*xkj) and then divided in quintiles with similar number of patients.
Each quintile of risk includes 1013 patients, total =5065. Median follow-up time =1.6 (1.0-2.2) years.
*The biomarkers used for each outcome are the same as described in Table 2 and Table 3 (Primary outcome: Clinical model vs. Clinical+Troponin+BNP; CV death: Clinical model vs.
32 CV death/HFH: Clinical model vs. Clinical+BNP+Troponin+TRAILR2; HFH: Clinical model vs. Clinical+BNP+Gal9; MI: Clinical model vs. Clinical+Troponin+FGF23+AMBP; Stroke: Clinical model vs. Clinical+Troponin) and the same clinical variables as described in the Table 1 (Previous HFH, Diabetes duration (per year), Myocardial infarction, eGFR (per ml/min/1.73m2), Stroke, SBP, Hypertension, Atrial fibrillation, Age (per year), Smoking, Female, Alogliptin, Statin).
Figure 1. Multivariable c-index and Bayesian Information Criteria (BIC) for the primary outcome (A) C-index
33 Legend: BNP, brain natriuretic peptide; TRAILR2, trail receptor 2 (or death receptor 5); VEGFD, vascular endothelial growth factor D; FGF23, fibroblast growth factor 23; MMP7,
matrix-metalloproteinase 7. No added value to the model after BNP (dashed line) i.e. c-index and BIC p-value >0.05. Please see also the Supplemental Figure 2 for the full results.
Figure 2. Comparison of the clinical model with the clinical plus biomarker model (A) Primary outcome
34 (C) Cardiovascular death or Heart Failure Hospitalization
(D) Heart Failure Hospitalization (E) Myocardial Infarction (F) Stroke
Legend: CI, confidence interval. The clinical plus biomarker model outperforms the clinical model by reclassifying both patients at low risk as “true” low risk and patients at high event risk as “true” high risk. The primary outcome was a composite of cardiovascular death, myocardial infarction or stroke.
Graphical abstract. Multi-Proteomic approach to predict specific cardiovascular events in patients with diabetes and myocardial infarction: findings from the EXAMINE trial
Legend: T2D, type 2 diabetes; MI, myocardial infarction; CV, cardiovascular; HFH, heart failure hospitalization; ∆, delta; cNRI, continuous net reclassification index; BNP, brain natriuretic peptide; TRAILR2, trail receptor 2 (or death receptor 5); Gal-9, galectin-9; FGF23, fibroblast growth factor 23.