HAL Id: hal-03007323
https://hal.archives-ouvertes.fr/hal-03007323
Submitted on 14 Dec 2020HAL is a multi-disciplinary open access
archive for the deposit and dissemination of sci-entific research documents, whether they are pub-lished or not. The documents may come from teaching and research institutions in France or abroad, or from public or private research centers.
L’archive ouverte pluridisciplinaire HAL, est destinée au dépôt et à la diffusion de documents scientifiques de niveau recherche, publiés ou non, émanant des établissements d’enseignement et de recherche français ou étrangers, des laboratoires publics ou privés.
Zeb1 represses TCR signaling, promotes the
proliferation of T cell progenitors and is essential for
NK1.1+ T cell development
Jiang Zhang, Mélanie Wencker, Quentin Marliac, Aurore Berton, Uzma
Hasan, Raphaël Schneider, Daphné Laubreton, Dylan Cherrier, Anne-Laure
Mathieu, Amaury Rey, et al.
To cite this version:
Jiang Zhang, Mélanie Wencker, Quentin Marliac, Aurore Berton, Uzma Hasan, et al.. Zeb1 represses TCR signaling, promotes the proliferation of T cell progenitors and is essential for NK1.1+ T cell development. Cellular and molecular immunology, Nature Publishing Group/Chinese Society of Im-munology, 2020, �10.1038/s41423-020-0459-y�. �hal-03007323�
Zeb1 represses TCR signaling, promotes proliferation in T cell progenitors and
1
is essential for NK1.1+ T cell development
2 3
Jiang Zhang1,2,3,4,5,6, Mélanie Wencker1,2,3,4,5, Quentin Marliac1,2,3,4,5, Aurore 4
Berton1,2,3,4,5, Uzma Hasan1,2,3,4,5, Raphaël Schneider7, Daphné Laubreton1,2,3,4,5,
5
Dylan E. Cherrier1,2,3,4,5, Anne-Laure Mathieu1,2,3,4,5, Amaury Rey1,2,3,4,5, Wenzheng
6
Jiang6, Julie Caramel8, Laurent Genestier8, Antoine Marçais1,2,3,4,5, Jacqueline 7
Marvel1,2,3,4,5, Yad Ghavi-Helm7, and Thierry Walzer1,2,3,4,5 8
9
1 CIRI, Centre International de Recherche en Infectiologie - International Center for 10
Infectiology Research, Lyon, 69007 France. 11
2 Inserm, U1111, Lyon, France. 12
3 Ecole Normale Supérieure de Lyon, Lyon, France. 13
4 Université Lyon 1, Lyon, France. 14
5 CNRS, UMR5308, Lyon, France 15
6 Shanghai Key Laboratory of Regulatory Biology, School of Life Sciences, East 16
China Normal University, Shanghai, China 17
7 Institut de Génomique Fonctionnelle de Lyon, CNRS UMR 5242, Ecole Normale 18
Supérieure de Lyon, Université Claude Bernard Lyon 1, 46 allée d'Italie F-69364 19
Lyon, France 20
8 CRCL, Centre de Recherche sur le Cancer de Lyon, INSERM U1052 - CNRS 21
UMR5286, Centre Léon Bérard, Université Claude Bernard Lyon 1, Lyon, France 22
23
Corresponding author:
24
Thierry Walzer (orcid.org/0000-0002-0857-8179) 25
Centre International de Recherche en Infectiologie (CIRI), INSERM U1111 – CNRS 26
UMR5308, Université Lyon 1, ENS de Lyon. 21 Avenue Tony Garnier - 69365 LYON 27
cedex 07, France. Tel +33 (0)437 28 23 73. E-mail: [email protected] 28
29 30
31 32
Abstract
33
T cell development proceeds under the influence of a network of transcription factors 34
(TFs). The precise role of Zeb1, a member of this network remains unclear. Here, we 35
report that Zeb1 expression is induced early on during T cell development at the 36
Cd4-Cd8- double negative (DN) stage 2. Zeb1 expression further augments at the 37
Cd4+Cd8+ double positive (DP) stage before decreasing in more mature subsets. 38
We performed an exhaustive characterization of T cells in Cellophane mice that bear 39
Zeb1 hypomorphic mutations. The Zeb1 mutation, profoundly affected all thymic 40
subsets, specially DN2 and DP cells. Zeb1 promoted survival and proliferation in both 41
populations in a cell-intrinsic manner. In the periphery of Cellophane mice, the 42
number of conventional T cells was near normal, but invariant iNKT cells, NK1.1+ γδ 43
T cells and Ly49+ Cd8 T cells were virtually absent. This suggested that Zeb1 44
regulates the development of unconventional T cells from DP progenitors. A 45
transcriptomic analysis of WT and Cellophane DP revealed that Zeb1 regulated the 46
expression of multiple genes involved in cell cycle and TCR signaling, possibly in 47
cooperation with Tcf1 and Heb. Indeed, Cellophane DP displayed stronger signaling 48
than WT DP upon TCR engagement in terms of calcium response, phosphorylation 49
events and expression of early genes. Thus, Zeb1 is a key regulator of cell cycle and 50
TCR signaling during thymic T cell development. We propose that thymocyte 51
selection is perturbed in Zeb1-mutated mice, in a way that does not allow the survival 52
of unconventional T cell subsets. 53
Introduction
54
T cell development occurs in the thymus and starts from immature thymocytes that 55
are double negative (DN) for Cd4 and Cd8 expression. The DN population can be 56
subdivided into four subsets, DN1-DN4, depending on the expression of the cell 57
surface molecules Cd44 and Cd25 (for a review, see [1]). DN1 cells (Cd44+Cd25-)
58
are the most immature progenitors and retain the ability to differentiate into non-T cell 59
lineages. In DN2 cells (Cd44+Cd25+), the expression of RAG1/2 is induced, which 60
promotes the rearrangements of gene segments encoding for TCR-β, TCR-γ, and 61
TCR-δ subunits. In DN3 cells (Cd44−Cd25+) the TCR β-chain associates with the pre-62
TCR α-chain and Cd3 subunits to form the pre-TCR complex; the pre-TCR allows β-63
selection to occur. During β-selection, DN3 cells with productive TCRβ 64
rearrangements receive survival and proliferative signals and mature into the DN4 65
(Cd44−Cd25−) stage. DN4 thymocytes then develop into Cd4+Cd8+ double-positive 66
(DP) stages [2]. 67
At the DP stage, a succession of events takes place and determines the fate 68
of developing T cells; including rearrangement of the T cell antigen receptor (TCR) 69
alpha locus, association of the αβ T cell receptor, and subsequent thymic selection. 70
In general, high affinity interactions between the αβTCR and self-peptide-MHC 71
complexes (pMHC) presented by different thymic cells lead to negative selection and 72
elimination of self-reactive thymocytes while low affinity interactions result in positive 73
selection and development of Cd4 or Cd8 single positive (SP) T cells [3–5]. In spite 74
of this general rule, regulatory T cells (Tregs) and invariant NKT cells (iNKT) receive 75
stronger TCR signals than conventional T cells during their development [6], as a 76
result of selection by agonist self-antigens. iNKT cells are a subset of innate like T 77
cells with a single invariant TCRα chain (Vα14-Jα18 in mice) and a limited repertoire 78
of TCRβ chains (Vβ8.2, Vβ7, or Vβ2) that recognize glycolipid antigens bound to 79
Cd1d, a non-polymorphic MHC molecule [7]. Their development includes discrete 80
stages (stages 0-3) that can be discriminated by Cd44 and NK1.1 expression [8]. 81
Three functionally distinct iNKT cell subsets have also been identified; iNKT1 cells 82
express T-bet and mainly secrete IFN-γ; iNKT2 cells express Gata3 and Plzf and 83
secrete IL-4 and IL-13; iNKT17 express Rorγt and secrete IL-17. The TCR signal 84
strength during selection governs the development of iNKT cell subsets, with strong 85
signals promoting iNKT2 and iNKT17 development [9,10]. A large number of 86
molecules regulate the strength of the TCR-derived signaling cascade. TCR signal 87
strength can also be modulated at the transcriptional level by transcription factors 88
(TFs) such as Sox4 [11], or at the post-transcriptional level by miR-181[12,13]. The 89
loss of either blocks iNKT cell development. Mechanistically, miR-181a regulates the 90
expression of multiple phosphatases and other proteins to boost TCR signaling as 91
well as cell metabolism [12,13]. Interestingly, mice expressing a hypomorphic form of 92
Zap70, a major TCR-proximal kinase, also have impaired developmental maturation 93
of γδ T cells, suggesting that innate-like T cell subsets are particularly dependent on 94
a tight regulation of TCR signal strength for their development [14]. 95
A dense network of TFs have been shown to regulate T cell development [15]. 96
Early commitment is dependent on Notch signals [16], which induce many TFs and 97
maintain their expression throughout T cell development. Among those factors, the E 98
protein family factors E2a, Tcf1 (encoded by Tcf7) and Heb (encoded by Tcf12) [17] 99
induce the expression of TCR components and balance the survival and proliferation 100
of thymocytes [18]. Many other TF such as Gata3, Myb, Runx1, and Bcl11b also 101
cooperate with E proteins at different developmental stages and further establish T 102
cell identity [15,18]. 103
Zeb family of TFs consist of Zeb1 and Zeb2. They are best known for their role 104
in epithelial-to-mesenchymal transition (EMT). EMT programs operate at different 105
stages of embryonic development and are downstream of Wnt, TGF-β, Bmp, Notch, 106
and other signaling pathways [19]. Zeb1-/- mice exhibit multiple developmental
107
defects and die at birth [20]. In pathological settings, activation of EMT programs 108
contributes to fibrosis and cancer metastases [21]. Zeb1 and Zeb2 are highly 109
homologous and are characterized by two clusters of zinc fingers expressed on the 110
protein extremities. They also contain a homeodomain, a Smad-binding domain and 111
can interact with many other TFs [22]. Zeb1 and Zeb2 are also expressed in a tightly 112
regulated manner in the immune system and regulate cell differentiation [23]. We and 113
others have previously shown that Zeb2 regulated terminal NK cell [24] and effector 114
Cd8 T cell differentiation [25,26]. Mutated mice expressing a truncated form of Zeb1, 115
that removes the C-terminal zinc finger clusters at C727, have a small and 116
hypocellular thymus caused by a reduction in early T-cell precursors [27]. In 117
Cellophane mutant mice, a T→A mutation in the seventh exon of Zeb1 replaces the 118
tyrosine at position 902 with a premature stop codon [28]. The resulting mRNA 119
encodes a truncated protein lacking the C-terminal zinc finger domain, which is 120
predicted to be hypomorphic. Cellophane homozygote mice have small hypocellular 121
thymi with fewer DP thymocytes. However, the mechanism of Zeb1 action during T 122
cell development, and its role in mature T cell subsets remain unclear. Here, we 123
show that Cellophane homozygous mice virtually lack several peripheral T cell 124
subsets including iNKT cells, NK1.1+γδ T cells and Ly49 expressing Cd8 T cells. This
125
specific defect in innate-like T cells is caused by a cell-intrinsic role of Zeb1 in T cell 126
development. We show that Zeb1 expression is maximal at the DN2 and DP stages 127
of T cell development. Furthermore Zeb1 regulates the transition to the SP stage by 128
promoting cell proliferation, survival and repressing the expression of various 129
molecules involved in the strength of TCR signaling. Therefore, we propose that 130
Zeb1 is a key regulator of thymocyte selection, essential for the development and 131
survival of innate-like T cell subsets undergoing agonist-type selection. 132
133 134 135
136
Results
137 138
Zeb1 is highly expressed at the DN2 and DP stages of T cell development
139
To study the role of Zeb1 in T cell development, we sorted thymocyte subsets and 140
measured Zeb1 transcript levels by semi-quantitative (Q) RT-PCR (reverse 141
transcription polymerase chain reaction). As shown in Figure 1A, Zeb1 transcript 142
levels were low in DN1, started to increase at the DN2 stage and were maximal in 143
DP thymocytes. This expression then decreased as T cells underwent selection and 144
matured into either conventional T cells, or iNKT cells. Interestingly, the expression of 145
Zeb2 was somewhat reciprocal to that of Zeb1, with high expression in early thymic 146
progenitors (DN1 to DN4) and lowest expression in DP (Figure 1B). This pattern of 147
expression was matched by data from the Immgen consortium [29] (Figure S1A). 148
Thus, as seen for memory T cells [30], Zeb1 and Zeb2 have reciprocal patterns of 149
expression in thymocytes. We used the Immgen web browser to search for co-150
regulated genes across different immune subsets. The E-protein Heb (encoded by 151
Tcf12) was in the top 3 genes found to be co-regulated with Zeb1 (Figure S1B) [29]. 152
Heb is well known for its important role throughout T cell development [31], and 153
especially at the DP stage[32], further pointing to Zeb1 as a potential regulator of this 154
developmental stage. We also analyzed the expression of Zeb1 protein in total 155
thymocytes (80% of which are composed of DP). Zeb1 was strongly expressed in 156
WT but not Cellophane thymocytes. Mutant mice only expressed reduced quantities 157
of a truncated form of Zeb1 (Figure 1C). 158
159
Impaired development of both conventional and unconventional T cells in
160
Cellophane mice
161
To define the impact of the Cellophane mutation on T cell development, we analyzed 162
the T cell composition in the thymus, spleen and lymph nodes of Cellophane mice. 163
The cell numbers in spleen, and liver were normal while the number of lymphocytes 164
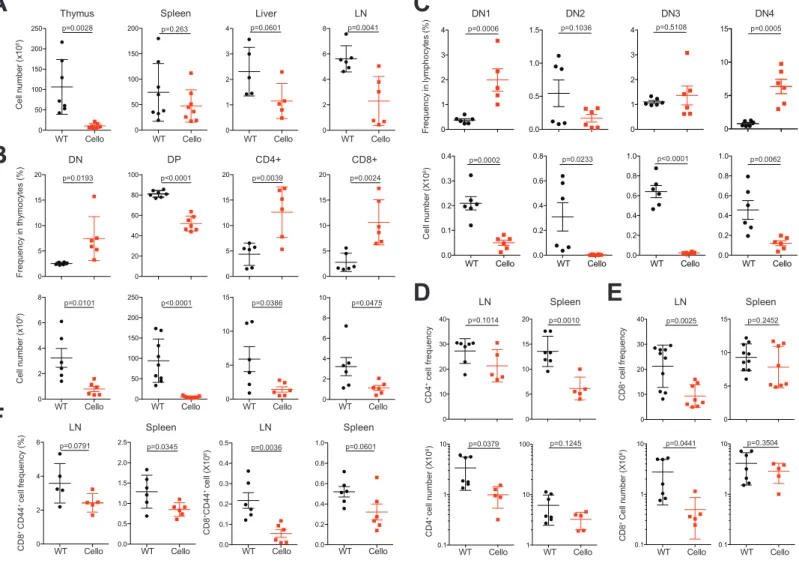
was reduced in lymph nodes (LN) (Figure 2A). As shown by previous observations 165
[28] we also observed a strong decrease in cell numbers from thymus in Zeb1-166
mutated mice (Figure 2A). This decreased number affected all subsets defined by 167
Cd4, Cd8, Cd44 and Cd25 expression (Figure 2B-C). The Cd4+Cd8+ DP thymocytes
168
and DN2 populations also decreased in frequency within Cellophane thymocytes 169
(Figure 2B-C). In the LN and spleen, the percentage of Cd4 T cells, and Cd8 T cells 170
were reduced (Figure 2D-E) and the proportion of memory-phenotype Cd44+ T cells 171
from Cd8 T cells was decreased by nearly 30% (Figure 2F). 172
We then investigated the development of unconventional T cell subsets. We 173
observed a drastic decrease in the frequency and in the number of iNKT cells as well 174
as NK1.1+γδ T cells in Cellophane mice compared to littermate controls (Figure 3A-175
D). This decrease affected all organs from Cellophane mice (Figure 3A-D). iNKT cells 176
were mainly affected at stage 3 (Figure 3E). To complete our analysis, we also 177
studied memory-phenotype Ly49+ Cd8 T cells which are thought to arise “naturally” in 178
the thymus, without antigenic experience [33]. All Ly49+ Cd8 T cell populations were
179
also strongly decreased in LN and spleen from Cellophane mice, both in terms of 180
frequencies and numbers, and irrespective of the inhibitory Ly49 receptor analyzed 181
(Ly49A, Ly49F or Ly49G2) (Figure 3F-G). 182
Altogether, these data confirm the important role of Zeb1 in early T cell 183
development. We also demonstrate an essential and specific role of Zeb1 in the 184
development of peripheral T cell subsets expressing NK cell markers such as iNKT 185
cells, NK1.1+γδ T cells and Ly49+ Cd8 T cells.
186 187
Cell intrinsic role of Zeb1 in thymic progenitors and T cell development
188
Zeb1 is also required for the development and expression of non-hematopoeitic 189
tissues and cell types [20]. To test if Zeb1 had an intrinsic role in T cell development, 190
we generated chimeric mice by reconstituting sub-lethally irradiated Ly5a (Cd45.1) 191
mice with the BM from Cellophane (Cd45.2) or “WT” Ly5a x C57BL/6 (Cd45.1/2) 192
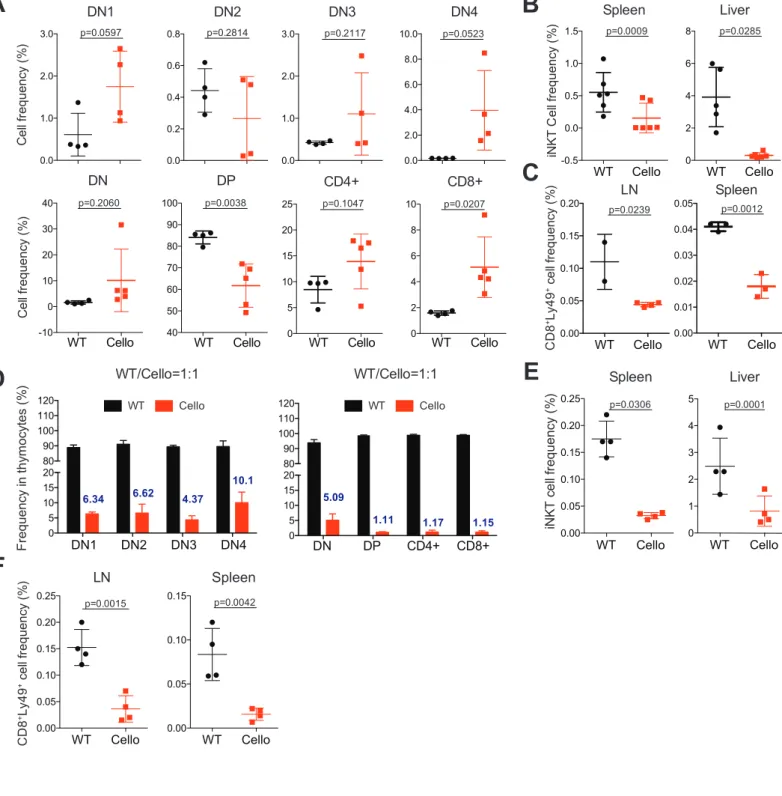
mice. In the thymus of chimeric mice, the frequency of DN2 and DP was strongly 193
decreased for Cellophane BM-reconstituted mice compared to WT BM-reconstituted 194
mice, while the proportion of other populations defined by Cd4 and Cd8 was 195
increased (Figure 4A). iNKT cells and Ly49+ T cell subsets were also strongly 196
reduced in the peripheral organs of CellophaneLy5a BM chimeric mice compared 197
to WTLy5a chimera indicating that Zeb1 regulated T cell development intrinsically 198
(Figure 4B-C). Cell numbers for all thymic T cell subsets and for peripheral iNKT cells 199
and Ly49+ T cells were decreased in CellophaneLy5a BM chimeric mice compared 200
to WTLy5a chimera (Figure S2). NK1.1+ γδ T cells were not analyzed because 201
many of them are derived from fetal precursors [34], and are not reconstituted in BM 202
chimera mice. To further test the role of Zeb1 in the environment of developing T 203
cells, we also made different BM chimeric mice using WT and Cellophane mice as 204
both recipients and BM donors (WTWT, WTCellophane, CellophaneWT and 205
CellophaneCellophane). As shown in Figure S3A-B, the frequencies and numbers 206
of DN and DP subsets were determined by the genotype of the BM donor and not by 207
that of the host genotype. Similar conclusions could be reached upon examination of 208
the frequency and number of NKT cells in the thymus and in the liver (Figure S3C). 209
We then generated mixed BM chimera by reconstituting lethally irradiated 210
Ly5a mice with a 1:1 mixture of BM from Cellophane and Ly5a x C57BL/6 (WT) mice. 211
Cellophane T cell progenitors had a poor competitive fitness in BM chimeric mice 212
(Figure 4D). Indeed, the percentage of cells originating from the Cellophane BM 213
progenitors was already low in DN and further decreased when transitioning between 214
DN and DP stages (Figure 4D). In the periphery of mixed BM chimeric mice, we 215
found that the frequency of iNKT and Ly49+ Cd8 T cells was strongly reduced 216
amongst Cellophane compared to WT lymphocytes (Figure 4E-F), thus revealing the 217
role of Zeb1 in T cell development is cell-intrinsic, and not due to a defective stromal 218
environment. Of note, we also analyzed the reconstitution of myeloid cells as control. 219
In the spleen, on average 20% of macrophages, 25% of dendritic cells and 28% of 220
neutrophils were of Cellophane origin (Figure S3D), suggesting that Zeb1 regulated 221
the development of all hematopoietic subsets, perhaps by regulating multipotent 222
progenitors. However, the most important effects were observed for thymocytes and 223
peripheral T cell subsets expressing NK cell markers. 224
225
Reduced survival and proliferation of Cellophane DN2 and DP cells
226
The decreased cellularity of the Cellophane thymi could be due to a reduced 227
proliferation or increased apoptosis of thymocytes. To address this point, we first 228
compared the survival of WT and Cellophane thymocytes upon ex vivo culture. We 229
found that Cellophane DN2, DN3 and DN4 had a reduced ex vivo viability compared 230
to their WT counterparts (Figure 5A). Moreover, after 24 or 48 h in culture, 231
Cellophane DN2, DN3, DN4 and DP were also less viable than controls (Figure 5A). 232
Next, we compared in vivo proliferation of WT and Cellophane thymocytes, as 233
measured by EdU incorporation. Cellophane DN2 and DP proliferated less than their 234
WT counterpart, while Cellophane proliferated more than WT DN3 (Figure 5B). Ki67 235
staining corroborated our data obtained with EdU incorporation (Figure 5C-D). As all 236
DP cells were Ki67 positive, we reported only changes in the MFI (Figure 5D). 237
Thus, the Cellophane mutation affects both the survival and proliferation of 238
developing DN2 and DP thymocytes, which could account for the decreased number 239
of cells in the Cellophane thymi. 240
241
Zeb1 tunes TCR signal strength
242
To gain insight in the mechanism of Zeb1 function, we focused on DP as they 243
expressed the highest level of Zeb1 among thymocytes (Figure 1A). We first 244
compared the expression of membrane proteins involved in thymocyte selection in 245
Cellophane vs WT DP cells by flow cytometry. Cellophane DP expressed higher 246
levels of Cd69, Cd25, and Cd5 compared to WT thymocytes (Figure 6A). Nur77 is 247
an early response gene expressed in T cells within hours after TCR stimulation. We 248
observed an increase in the intracellular expression for Nur77 which correlated to 249
TCRβ levels in Cellophane compared to WT DP thymocytes (Figure 6A). Of note 250
similar levels of Cd4 and Cd8 were measured (Figure 6A). 251
Next, we focused our attention on thymic iNKT cell subsets. The mouse 252
thymus is known to contain at least three iNKT subsets, ie iNKT1, iNKT2 and iNKT17 253
that are thought to have distinct roles in the immune response [35]. NKT1 cells 254
correspond mainly to stage 3 NKT cells. TCR signal strength governs the 255
development of iNKT cell subsets in the thymus, in which high signal strength is 256
necessary for iNKT2 and iNKT17 development [9,10]. We examined iNKT cell 257
subsets by staining for Plzf and Rorγt [36] in Cellophane mice vs WT mice. Results in 258
Figure 6B show a significant increase in the representation of iNKT2 and iNKT17 and 259
a decrease in that of iNKT1 in Cellophane compared to control mice. These data 260
evocated an increase in the TCR signal from DP progenitors of iNKT cells in 261
Cellophane mice. The change in iNKT subsets was associated with subtle changes 262
in the TCR repertoire as assessed by measuring the frequency of Vβ8, Vβ7 and Vβ2 263
positive cells amongst iNKT cells of each genotype. We observed a 2-fold increase in 264
Vβ7 usage in Cellophane mice (Figure 6C). This could reflect the increase in iNKT2 265
cells as a previous article showed that Vβ7 was more often associated with iNKT2 266
cells [9]. Thymic Cellophane iNKT cells expressed normal levels of transcription 267
factors T-bet and Egr2 but strongly reduced levels of Cd4 (Figure 6D). Since Cd4 is 268
known to sustain TCR signal strength [5], the selection of Cd4 low iNKT cells in
269
Cellophane mice could reflect an adaptation to overt TCR signaling in Cellophane 270
DP . 271
We then analyzed specifically TCR signaling in developing thymocytes. We 272
started by measuring the phosphorylation (p) level of a series of signaling proteins 273
involved in TCR-mediated activation, either at steady-state in freshly isolated 274
thymocytes, or following TCR engagement by crosslinking anti-Cd3 antibodies. To 275
minimize the experimental variation, we used a barcoding strategy that allowed 276
stimulating and then staining WT and Cellophane thymocytes simultaneously (see 277
methods). Results in Figure 6E-F showed an increase in pAkt (Ser473), ribosomal 278
protein pS6, and to a lesser extent of pErk, either at steady state or following TCR 279
engagement in Cellophane DP compared to WT DP. Thus, the Mapk and PI3K/Akt 280
pathways are more active in thymocytes undergoing selection in Cellophane 281
compared to control mice. To complement this analysis, we also assessed the 282
calcium response of DP from both genotypes in response to TCR engagement. As 283
shown in Figure 6G-H, this response was stronger for Cellophane DP compared to 284
control DP both in terms of intensity (peak) and duration (area under the curve, AUC). 285
Thus, Zeb1 tunes signal strength downstream TCR engagement at the DP stage and 286
Cellophane DP have increased TCR signaling. The latter may increase negative 287
selection and therefore account for defective T cell development in Cellophane mice. 288
We also measured preTCR signaling in DN cells following stimulation with anti-CD3 289
antibodies. This analysis did not reveal any difference between WT and Cellophane 290
DN cells (data not shown). 291
292
Zeb1 broadly shapes transcription at the transition DPSP to promote
293
proliferation and repress TCR signaling
294
To further uncover the mechanisms of Zeb1 function during T cell development, we 295
performed RNA-seq to compare WT and Cellophane DP transcriptomes. We found 296
538 differentially expressed genes (DEGs, p-value<0.05, Log2 Fold change>1). 204 297
genes were increased and 334 were down regulated in Cellophane DP compared to 298
WT DP. These data reveal that Zeb1 broadly shapes the genetic program of 299
developing thymocytes (Figure 7A and Table S1). For some of the DEGs identified, 300
antibodies were available, and we were thus able to confirm higher expression of 301
Foxo1, Ms4a4b, Itgb7, Ccr7 and Ccr4 in Cellophane compared to control DP cells 302
and reciprocally we observed lower Cd81 expression in Cellophane DP vs WT 303
(Figure 7B). 304
Next, we queried the Immgen database to retrieve the expression profile of the 305
Zeb1-regulated geneset (induced or repressed) across all thymocyte subsets. 306
Interestingly, genes down regulated in Cellophane DP (ie normally induced by Zeb1) 307
correspond to genes that are normally expressed at high levels in early T cell 308
progenitors and low levels in mature T cells (Figure 7C). Their expression level 309
normally drops at the DP to SP transition, at the time when Zeb1 is highly expressed. 310
Genes up regulated in Cellophane DP correspond to genes that follow the reciprocal 311
pattern of expression (Figure 7C). This pattern of expression also correlates with cell 312
proliferation and TCR responsiveness in thymocytes. Indeed, irrespective of mouse 313
genotype, SP T cells are much more responsive to TCR signaling mediated calcium 314
responses than DP, but reciprocally do not cycle as much as DP (data not shown). 315
This suggests that Zeb1 promotes cell proliferation and represses TCR signaling 316
specifically at the DP stage, presumably to ensure proper selection. 317
A functional annotation analysis of DEGs in our RNAseq analysis using 318
“Metascape” [37] highlighted the cell cycle as the most down regulated biological 319
process in Cellophane DP compared to control DP (Figure 7D, and Table S2), 320
confirming findings in Figure 3. Pathways linked to Ifnγ (but also type I-Ifn, Table S2), 321
antigen presentation, leukocyte differentiation and apoptosis were significantly 322
associated with genes up regulated in Cellophane DP compared to WT (Figure 7D). 323
Of note, a modest but significant enrichment for genes involved in the calcium 324
response was also associated with these genes, corroborating our data in Figure 6. 325
To further annotate this dataset, we also performed individual Pubmed searches, 326
looking for connections between genes up regulated in Cellophane DP compared to 327
control DP and “T cell activation” or “TCR signaling” or “T cell development”. 328
Interestingly this analysis showed more than 25% of the genes in the list had a 329
known role in T cell activation or TCR signaling; and 10% had a role in T cell 330
development, as defined using loss-of-function mouse strains (Table S3). Moreover, 331
we used the STRING database of physical and functional protein interactions [38] to 332
further annotate genes up or down regulated in Cellophane DP compared to control 333
DP. In particular, we used the Pubmed module that searches for enrichment for gene 334
lists in articles in Pubmed. This unbiased analysis showed that genes up regulated in 335
Cellophane DP were significantly enriched for genes involved in negative selection 336
[39] or T cell maturation regulated by Bcl11b [40] (Table S4), which corroborated with 337
our manual PubMed searches. 338
339
Chromatin regions remodeled at the DP stage contain Zeb1 binding motifs
340
Next, we wanted to determine if Zeb1 could regulate chromatin remodeling at the DP 341
stage of T cell development. For this, we took advantage of a recently published 342
large-scale analysis of chromatin accessibility and gene expression across 86 343
immune subsets including T cell developmental stages in the thymus [41]. In this 344
study, in silico predictions pointed to Zeb1 as one of the few TF whose expression 345
correlated with modifications of chromatin accessibility during thymic T cell 346
development, and for which the corresponding chromatin regions contained sites 347
predicted to be bound by Zeb1. Other TFs in this category included Gata3, Tcf7, Lef1, 348
Tcf12 and Zfp740 (Figure S4A), and especially Tcf7 and Tcf12 whose role in T cell 349
development has been well established [32]. We retrieved open chromatin regions 350
(OCRs) for which Zeb1 motifs were discovered in this study and whose accessibility 351
changed during T cell development (see corresponding clusters in Figure S4B) and 352
compared the list of corresponding genes with DEGs identified in our own study 353
between Cellophane and WT DP. We found an important overlap between both lists 354
that included many of the genes previously highlighted in our analysis (Figure 7E, p-355
value=1.839413e-46). Altogether, these data suggest that Zeb1 is a direct 356
transcriptional regulator of T cell development, especially operating at the DP to SP 357
transition to promote proliferation and ensure proper selection. 358
Discussion
360
Here, we demonstrated that Zeb1 is essential for the transition through the DN2 and 361
DP stages of T cell development as well as for the differentiation of iNKT cells, 362
NK1.1+ γδ T cells and Ly49+ Cd8 T cells. Mechanistically, Zeb1 regulates the
363
expression of a number of genes that were notably involved in cell proliferation or in 364
TCR signaling at the DP stage. In Cellophane mice, these events may perturb thymic 365
development and selection in a way that does not allow the production of NK1.1+ and 366
Ly49+ T cell subsets. 367
Zeb1 expression was found to increase at the DN2 stage and to be maximal at 368
the DP stage of T cell development. Accordingly, we found a decrease in frequency 369
of DN2 and DP thymocytes in Cellophane mice. This could be accounted for by a 370
cell-intrinsic role for Zeb1 in DN2 and DP proliferation. A number of genes involved in 371
the cell cycle were differentially expressed between WT and Cellophane DP as 372
revealed by our RNAseq analysis. There is also a strong link in the literature between 373
Zeb1 and cell proliferation in cancer. In particular, Zeb1 interacts with many TFs 374
involved in the regulation of cell growth such as Smad TFs which is downstream of 375
several growth factor pathways [22]. Moreover, Zeb1 is known to repress cyclin-376
dependent kinases during EMT [21]. However, Cdkn2c and Cdkn3 were decreased 377
by Zeb1 in DP thymocytes, suggesting differential roles of Zeb1 in epithelial versus 378
lymphoid cells. The decreased proliferation of DN2 and DP is expected to have 379
important consequences on the general thymic output. Indeed, we found decreased 380
numbers of peripheral T cells in Cellophane mice. However, this defect was much 381
more pronounced for iNKT cells, NK1.1+ γδ T cells and Ly49+ Cd8 T cells. In
382
particular, iNKT cells were virtually absent from the periphery. This altered 383
development was associated with an increased TCR signaling at the DP stage, which 384
was verified by increased basal levels of Cd5 and Nur77 but also increased mTOR 385
activity and calcium flux upon Cd3 engagement. iNKT cells are known to receive 386
stronger TCR signals than conventional T cells during their development [6]. Thus, 387
increased TCR signaling in Cellophane DP could trigger cell death i.e. via negative 388
selection of iNKT precursors. The increased negative selection of iNKT cells has 389
already been shown to occur in mice in which transgenic TCR-β chain conferred high 390
affinity for self-lipid/Cd1d complexes when randomly paired with Vα14-Jα18 391
rearrangements [42]. Thus, increased negative selection could impair the 392
development of iNKT cells in Cellophane mice, and perhaps that of other T cell 393
subsets expressing NK cell markers. Indeed, strong TCR-mediated signals are also 394
important for γδ T cell development [43,44]. In particular, NK1.1+ γδ T cells have an
395
oligoclonal TCR repertoire and accumulate in mouse models of decreased TCR 396
signaling [45], suggesting that this subset of γδ cells can also be negatively selected. 397
The ontogeny of Ly49+ Cd8 T cells is not very well known, but our data suggest that 398
their development and selection could share common mechanisms with that of 399
NK1.1+ T cells. How does Zeb1 regulate TCR signal strength? Cellophane DP 400
thymocytes expressed higher levels of TCRβ than control DP, and this could certainly 401
lead to higher TCR signaling. Moreover, the RNAseq analysis we performed 402
suggested multiple connections between Zeb1 and signal transduction through the 403
TCR. For example, multiple members of the GTPases of the IMmunityAssociated 404
Proteins (GIMAP) family (GIMAP5 and GIMAP8) were up regulated in Cellophane 405
DP. Interestingly, Gimap5 enhances calcium influx following TCR stimulation [46]. 406
Several members of the family of four-pass membrane receptors Ms4a are also up 407
regulated in Cellophane DP and could reinforce TCR signaling. Indeed, transduction 408
of Ms4a4b into naive T cells can heighten their sensitivity to antigen through a 409
process that could involve association with costimulatory molecules [47]. Several 410
phosphatases and kinases are also deregulated in Cellophane DP and could 411
perhaps alter TCR signaling. In particular the expression of Pyk2 (encoded by Ptk2b) 412
or that of Rasgrp4, Rasl1 and Rasa3 could all contribute to higher TCR signaling via 413
the calcium flux or the Mapk pathway. 414
A series of TF were also deregulated in Cellophane DP, with a notable up 415
regulation of JunB, Jun, Atf6, Foxo1, Stat4 or Irf7/9. JunB and Jun are essential 416
components of AP-1 TFs and are typically induced downstream of TCR stimulation. 417
Similar to Nur77, they could represent surrogate markers of increased TCR signaling 418
in Cellophane DP. The derepression of Foxo1 could in part account for altered T cell 419
development as it regulates Ccr7, Cd62L and S1pr1 via Klf2 [48]. The lack of Klf2 420
control could perturb, perhaps accelerate, the normal migration of developing 421
thymocytes in the medullar region where negative selection occurs. Foxo1 deletion in 422
thymocytes was reported to decrease the number of DP thymocytes, and Foxo1 423
deficient peripheral T cells seem to be refractory to TCR stimulation through 424
unknown mechanisms [49]. Moreover, up regulation of Foxo1 in Cellophane DP 425
could in part explain the opposite changes in cell proliferation observed in these cells 426
compared to control DP, since Foxo TFs are known to promote stem cell quiescence 427
[50] and clearly contribute to the regulation of cell division, survival and metabolism in 428
T cells [51]. A recent study showed that the transcriptional repressor Gfi1 is important 429
to maintain Foxo1 expression at low levels in DP thymocytes [52]. In the absence of 430
Gfi1, there was premature expression of genes normally expressed in mature T cells 431
and accelerated maturation of DP to SP thymocytes, largely attributable to Foxo1 de-432
repression. Zeb1 and Gfi1 could therefore cooperate to repress Foxo1. 433
There are many similarities in the phenotype of Tcf12 deficient [53] and 434
Cellophane mutant mice, in particular susceptibility of DP to cell death and impaired 435
development of iNKT cells. Moreover, microarray data from the Immgen consortium 436
suggest that Tcf12 and Zeb1 are strongly co-regulated and ATAC-seq data predict 437
that they control chromatin accessibility during thymic T cell development together 438
with Gata3, Tcf1, Lef1 and Zfp740 (Figure S4 and [41]). Altogether these data 439
suggest a strong functional link between Zeb1 and Heb (encoded by Tcf12), and 440
perhaps Tcf1, which acts in coordination with Heb [32]. The fact that Zeb1 is known 441
to bind tandem E-box motifs, suggests a possible competition between Zeb members 442
and E-proteins for those genes regulated by tandem E-boxes. Such a competition 443
has been previously established at least in the context of the CD4 enhancer which is 444
repressed by Zeb1, through a competition with Heb for E-box binding [54]. Moreover, 445
Zfh-1 and Daugtherless, the drosophila homologs of Zeb1 and Tcf12, are also known 446
to compete for the same genomic sites [55]. The deletion of Tcf12 and Tcf1 in 447
thymocytes has the opposite phenotype as Cellophane Zeb1 mutation in terms of DP 448
proliferation [32]. This suggests that Heb and Zeb1 could have partially antagonistic 449
activities in the regulation of genes bearing tandem E-box elements. A competition 450
between Zeb1 and E-proteins has already been suggested in the control of GATA3 451
expression in human CD4 T cells [56]. Cellophane mice express a truncated form of 452
Zeb1 that is also expressed at lower levels than WT Zeb1. As the phenotype of these 453
mice is milder than that of Zeb1-/- mice, we assumed that the Cellophane mutation
454
was hypomorphic. However, we cannot exclude that Cellophane Zeb1 can retain 455
some DNA binding and therefore act as a dominant negative molecule by preventing 456
binding of E-box proteins. Further work will be needed to precisely map the 457
interactions between Zeb TFs and E proteins. This regulatory network may also 458
include inhibitor of differentiation genes Id2 and Id3, as these TFs bind and inactivate 459
E-proteins, thereby regulating their function. Moreover, the deficiency in Id3 has the 460
same impact on NK1.1+ γδ T cells as a deficiency in TCR signaling [45], which links 461
both events. 462
Zeb1 genomic region is frequently deleted in cutaneous T cell lymphomas 463
(CTCL) [57]. These deletions are often associated with genetic mutations in 464
components of the TCR signaling machinery (recurrent alterations in Card11, Plcg1, 465
Lat, Rac2, Prkcq, Cd28 and genes that encode calcium channel subunits). This 466
observation, together with our own data showing a role for Zeb1 in repressing TCR 467
signaling, suggest that Zeb1 deletion could promote lymphomagenesis by releasing 468
TCR signaling natural brakes. Of note, a previous study proposed an essential role of 469
IL-15 in CTCL development, and showed that IL-15 expression was depressed in 470
patients with CTCL due to promoter hypermethylation and in the failure of Zeb1 to 471
have access to and repress the IL-15 regulatory region [58]. However, IL-15 472
expression was not detected in developing thymocytes in our RNAseq analysis, 473
excluding the possibility that the IL-15 pathway could play a role in the Zeb1 474
mechanism of action in T cell development. Yet, we found that the transcriptional 475
response to different cytokines such as interferons or IL-6 was increased in 476
Cellophane DP (table S2). Zeb1 may therefore normally repress the response to 477
these cytokines, presumably to ensure proper selection. TGF-β is a known regulator 478
of iNKT cell development [59] and that it promotes early differentiation and prevents 479
apoptosis of developing iNKT cells. A recent study showed that Zeb1 was induced by 480
TGF-β in conventional Cd8 T cells stimulated through the TCR and was essential for 481
memory T cell survival and function [30]. Although we failed to detect any effect of 482
recombinant TGF-β on Zeb1 expression in thymocytes (data not shown), it would be 483
interesting to address this question in vivo using appropriate genetic models. 484
In summary, Zeb1 is an essential member of the TF network that regulates T 485
cell development and selection at the DN2 and DP stages. Furthermore, we have 486
also shown that Zeb1 allows the development of iNKT cells and other T cell subsets 487
expressing NK cell markers by regulation of cell cycle and TCR signaling in 488 developing thymocytes. 489 490 491 492 493
494 495
496
Material and Methods
497 498
Mice
499
Mice at 8 to 24 weeks were used. Wild-type C57BL/6 mice were purchased from 500
Charles River Laboratories (L’Arbresle). Cellophane mice were previously described 501
[28], littermate mice were used as controls. This study was carried out in accordance 502
with the French recommendations in the Guide for the ethical evaluation of 503
experiments using laboratory animals and the European guidelines 86/609/CEE. All 504
experimental studies were approved by the bio-ethic local committee CECCAPP. 505
Mice were bred in the Plateau de Biologie Expérimentale de la Souris (ENS, Lyon). 506
507
Bone marrow chimeric mice
508
8- to 10-week-old Ly5a mice were anesthetized with ketamine/xylazine before 509
irradiation at 9 Gray with a X-ray irradiator XRAD-320. After irradiation, they were 510
intravenously injected with 2-5x10^6 cells collected from either wild type or mutant 511
murine bone marrow, or a mix of both (as indicated in the figures). Immune cell 512
reconstitution was analyzed 8 weeks post BM injection. 513
514
Flow cytometry
515
Single-cell suspensions of the thymus, spleen and liver were used for flow cytometry. 516
Cell viability was measured using Annexin-V (BD Biosciences)/live-dead fixable 517
(eBiosciences) staining. Intracellular stainings for TFs were performed using Foxp3 518
kit (ebioscience). Lyse/Fix and PermIII buffers (BD Biosciences) were used for 519
intracellular staining of phosphorylated proteins. Flow cytometry was carried out on a 520
FACS Canto, a FACS LSR II, or a FACS Fortessa (Becton-Dickinson). Data were 521
analysed using FlowJo (Treestar). Antibodies were purchased from eBioscience, BD 522
biosciences, R&D Systems, Beckman-Coulter, Miltenyi or Biolegend. We used the 523
following antibodies: anti-mouse Cd3 (clone 145-2C11), anti-mouse Cd4 (clone 524
GK1.5), mouse Cd8 (clone 53-6.7), mouse TCRβ (clone H57-597), anti-525
mouse Cd69 (clone H1.2F3), anti-mouse TCRγδ (clone GL3), anti-mouse NK1.1 526
(clone PK136), mouse Cd24 (clone M1/69), mouse Cd44 (clone IM7), anti-527
mouse Cd27 (clone LG.7F9), anti-mouse TCRVβ2 (clone B20.6), anti-mouse 528
TCRVβ7 (clone TR310), anti-mouse TCRVβ8.1/8.2 (clone KJ16-133), anti-mouse 529
Ly49A (clone A1), anti-mouse Ly49E/F (clone REA218), anti-mouse Ly49G2 (clone 530
4D11), anti-mouse Cd45.1 (clone A20), anti-mouse Cd45.2 (clone 104), anti-mouse 531
Nur77 (clone 12.14), anti-mouse Ccr7 (clone 4B12), anti-mouse Cd5 (clone 53-7.3), 532
anti-mouse Cd81 (clone Eat-2), anti-mouse Cd53 (clone OX79), anti-mouse Lpam-1 533
(clone DATK-32), anti-mouse Foxo1 (clone C29H4), anti-mouse Ms4a4b (clone 534
444008), mouse Cd74 (clone In1/Cd74), mouse Tbet (clone 4B10), anti-535
mouse Egr2 (clone erongr2), anti-mouse Plzf (clone Mags.21F7), anti-mouse Rorүt 536
(clone AFKJS-9), anti-mouse pErk (clone 20A), anti-mouse pAkt (Ser473) (clone 537
M89-61), anti-mouse pS6 (clone D57.2.2E). For staining of iNKT cells, phycoerythrin 538
(PE)-conjugated PBS-57 loaded on mouse Cd1d tetramers (mCd1d/PBS-57) were 539
obtained from Tetramer Core Facility of the National Institute of Health. 540
541
Measurement of in vivo cell proliferation and ex vivo survival
542
Mice were given one intraperitoneal injection of 0.2 mg EdU (BD Bioscience). 12 543
hours after EdU injection, mice were sacrificed and organs harvested. Cells derived 544
from the thymus were stained with antibodies specific for cell surface antigens as 545
described above. After fixation and permeabilization, cells stained with FITC anti-EdU 546
antibody and 7-AAD (BD Pharmingen), according to manufacturer instructions. EdU 547
incorporation for different cell populations was measured by flow cytometry. 548
For the measurement of viability, we stained thymocyte suspensions with Annexin-V 549
(BD Biosciences), 7-AAD and coupled with other surface markers Cd4, Cd8, Cd69, 550
TCRβ, Cd25, Cd44, either ex vivo or 24, 48 or 72 h after in vitro culture in complete 551
medium. 552
553
Cell sorting and RNA preparation
554
Lymphocytes were obtained from the thymus. Immune cell population including DN1-555
4, DP, single positive CD4+ and CD8+, iNKT cells were stained in combination with 556
other cell specific markers Cd4, Cd8, Cd69, TCRβ, Cd25, Cd44 and mCd1d/PBS-57 557
and subsequently sorted into different subsets using a FACSAria Cell Sorter (Becton-558
Dickinson, San Jose, USA). Purity of sorted cell populations was over 98% as 559
validated by flow cytometry. Sorted cells were lysed using Trizol reagent (Invitrogen) 560
or RLT buffer from the RNeasy Micro kit (Qiagen) and RNA was extracted according 561
to the manufacturer’s instructions. 562
Quantitative RT-PCR
564
We used High capacity RNA-to-cDNA kit (applied biosystem, Carlsbad, USA) or 565
iScript cDNA synthesis kit (BioRad) to generate cDNA for RT-PCR. PCR was carried 566
out with a SybrGreen-based kit (FastStart Universal SYBR Green Master, Roche, 567
Basel, Switzerland) or SensiFast SYBR No-ROX kit (Bioline) on a StepOne plus 568
instrument (Applied biosystems, Carlsbad, USA) or a LightCycler 480 system 569
(Roche). Primers were designed using the Roche software. We used the following 570
primers for mouse QPCR: Zeb1 forward primer, 5’- GCCAGCAGTCATGATGAAAA-571
3’; Zeb1 reverse primer, 5’- TATCACAATACGGGCAGGTG-3’; Zeb2 forward primer, 572
5’-CCAGAGGAAACAAGGATTTCAG-3’; Zeb2 reverse primer, 5’-AGGCCTGACATG 573
TAGTCTTGTG-3’; Gapdh forward primer, 5’-GCATGGCCTTCCGTGTTC-3’; Gapdh 574
reverse primer, 5’- TGTCATCATACTTGGCAGGTTTCT-3’. The relative expression 575
of Zeb1 and Zeb2 were normalized to Gapdh expression. 576
577
Western blotting
578
Cells were lysed in NP40 lysis buffer (20mM Tris, HCl pH7.4; 150mM NaCl; 2mM 579
EDTA; 1% NP40) containing protease inhibitors for 30min on ice. Supernatant was 580
collected following 10min centrifugation at 12 000g at 4°C and protein concentration 581
was quantified by μBCA quantification kit (Thermo Fisher scientific). Fifity μg of total 582
cellular protein from thymus were incubated during 5 minutes at 95°C. Protein 583
samples were separated by electrophoresis using Novex 4–12% Tris-Glycine gels 584
(Life Technologies) for 1 hour at 120V. Proteins then were transferred on a PVDF 585
membrane (Bio-rad). After blocking with PBS 0.1% tween and 5% milk for 1 hour, 586
membranes were probed with the following primary antibodies: anti-Gapdh (Cell 587
Signaling Technology, 2118), anti-Zeb1 (Cell Signaling Technology, 3396, raised
588
against a peptide around Asp846, the Cellophane mutation truncating the protein
589
after Tyr902) over night at 4°C. Membranes were washed three times with PBS 0.1%
590
tween, secondary antibodies were added for one hour at RT. Anti-Rabbit and anti-591
mouse HRP conjugate secondary antibodies were provided by Jacson 592
Immunoresearch. Proteins were revealed with Chemiluminescence Western 593
Lightening Plus kit (Perkin-Elmer). 594
595
RNAseq analysis
Thymic suspensions were stained in combination with anti-Cd3, anti-Cd4, anti-Cd8, 597
anti-Cd69, anti-TCRβ and subsequently sorted into different subsets using a 598
FACSAria Cell Sorter (Becton-Dickinson, San Jose, USA). Purity of sorted cell 599
populations was over 98% as measured by flow cytometry. RNA libraries were 600
prepared as previously described [60]. Briefly, total RNA was purified from 5x10⁴
601
sorted thymocytes using the Direct-Zol RNA microprep kit (Zymo Research) 602
according to manufacturer instructions and was quantified using QuantiFluor RNA 603
system (Promega). 1µl of 10µM Oligo-dT primer and 1µl of 10mM dNTPs mix were 604
added to 0.15ng of total RNA in a final volume of 2.3µl. Oligo-dT were hybridized 605
3min at 72°C and reverse transcription (11 cycles) was performed. PCR pre-606
amplification was then conducted using 16 cycles. cDNA were purified on AmpureXP 607
beads (Beckman Coulter) and cDNA quality was checked on D5000 screen tape and 608
analysed on Tape station 4200 (Agilent). Three ng of cDNA were tagmented using 609
Nextera XT DNA sample preparation kit (Illumina). Tagged fragments were further 610
amplified and purified on AmpureXP beads (Beckman Coulter). Tagged library quality 611
was checked on D1000 screen tape and analyzed on Tape station 4200 (Agilent). 612
Sequencing was performed by the GenomEast platform, a member of the “France 613
Génomique” consortium (ANR-10-INBS- 0009), on an Illumina HiSeq 4000 614
sequencing machine (read length 1x50nt). 615 616 Measurements of TCR signaling 617 Calcium response 618
Thymocytes were first barcoded with anti-Cd45 coupled with different fluorochromes 619
for WT and Cellophane respectively and then stained at RT with fluorescent anti-Cd4 620
and anti-Cd8, anti-Cd69, anti-TCRβ, anti-Cd25 and anti-Cd44 antibodies, followed by 621
a staining with Indo-1 (1µM, Life Technologies) at 1x10⁷ cells/ml for 30 min at 37°C 622
and two times’ washing at 4°C. Cells were resuspended in the RPMI medium (0.2% 623
BSA and 25mM Hepes) and were placed at 37°C for 5-10 min prior to acquisition. 624
Samples were acquired on a LSRII (BD) as following steps: 15 s baseline acquisition, 625
addition of anti-Cd3 biotin (2C11, 10µg/ml), acquisition for 1 min 30 s, addition of 626
Streptavidin (Life Technologies, 10µg/ml) and, acquisition for another 3-5 min. 627
628
Phosphorylation events
Different samples corresponding to the different mice were barcoded by labeling 630
them with a series of anti-Cd45 antibodies coupled with different fluorochromes. For 631
phospho-flow stainings, 3x10⁶ mixed thymocytes were stained using biotinylated Cd3 632
(2C11, 5µg/ml) and other surface markers for 15 min, followed by streptavidin (Life 633
Technologies, 10µg/ml) stimulation and fixed by addition of 10 volumes of Lyse/Fix at 634
the indicated time point. The level of pErk, pS6 or pAkt were normalized by the mean 635
fluorescence intensity (MFI) that was detected in the non-stimulated condition 636
(regarded as 100%) for each mouse. 637
638
In silico analyses
639
Functional annotations of DEGs were performed using Metascape [37] or STRING 640
[38] using default parameters. Additionally, we used several functionalities of the 641
Immgen database browsers [29] to generate some of the figures in the 642 supplementary information. 643 644 Statistical analysis 645
Statistical analyses were performed using Prism 5 (Graph-Pad Software). Two tailed 646
unpaired t-test, paired t-test, and ANOVA tests with Bonferroni correction were used 647
as indicated. We used the hypergeometric test and Benjamini-Hochberg p-value 648
correction algorithm to calculate if the enrichment of the overlap between gene lists 649
were statistically significant. 650
651 652
Acknowledgements
653
The authors acknowledge the contribution of SFR Biosciences (UMS3444/CNRS, 654
ENSL, UCBL, US8/INSERM) facilities, in particular the Plateau de Biologie 655
Expérimentale de la Souris, and the flow cytometry facility. We thank Bruce Beutler 656
for sharing the Cellophane mutant mice. We also thank Andrew Griffiths and Kiyoto 657
Kurima for discussions regarding Twirler mutant mice and Fotini Gounari and 658
Christophe Benoist for providing RNAseq/Chipseq data of T cell development. The 659
TW lab is supported by the Agence Nationale de la Recherche (ANR GAMBLER to 660
TW and ANR JC BaNK to AM), the Institut National du Cancer, and receives 661
institutional grants from the Institut National de la Santé et de la Recherche Médicale 662
(INSERM), Centre National de la Recherche Scientifique (CNRS), Université Claude 663
Bernard Lyon1 and ENS de Lyon, Joint Research Institute for Science and Society 664
(JORISS). JZ is the recipient of a fellowship from the China Scholarship Council 665
(CSC). RS and YGH were funded by a FRM grant (AJE20161236686) to YGH. 666
667 668
Author contributions
669
JZ, AB, MW, DL, DEC, ALM, AR and AM performed experiments. RS and QM 670
performed in silico analyses. JC, LG, YGH provided reagents, conceptual insight and 671
helped writing the paper. TW wrote the paper and supervised the work. 672
673 674
Conflict of interest
675
The authors declare no conflict of interest 676
677
Supplementary information accompanies the manuscript on Cellular & Molecular
678
Immunology’s website (http://www.nature.com/cmi/) 679
680
References
681
1. Shah DK, Zúñiga-Pflücker JC. An Overview of the Intrathymic Intricacies of T Cell 682
Development. J Immunol 2014; 192:4017–4023. 683
2. Rothenberg EV, Moore JE, Yui MA. Launching the T-cell-lineage developmental 684
programme. Nat Rev Immunol 2008; 8:9–21. 685
3. Kurd N, Robey EA. T-cell selection in the thymus: a spatial and temporal 686
perspective. Immunol Rev 2016; 271:114–126. 687
4. Hogquist KA, Jameson SC. The self-obsession of T cells: how TCR signaling 688
thresholds affect fate “decisions” and effector function. Nat Immunol 2014; 15:815– 689
823. 690
5. Gascoigne NRJ, Rybakin V, Acuto O, Brzostek J. TCR Signal Strength and T Cell 691
Development. Annu Rev Cell Dev Biol 2016; 32:327–348. 692
6. Moran AE, Holzapfel KL, Xing Y, et al. T cell receptor signal strength in Treg and 693
iNKT cell development demonstrated by a novel fluorescent reporter mouse. J Exp 694
Med 2011; 208:1279–1289. 695
7. Godfrey DI, Uldrich AP, McCluskey J, Rossjohn J, Moody DB. The burgeoning 696
family of unconventional T cells. Nat Immunol 2015; 16:1114–1123. 697
8. Kronenberg M, Kinjo Y. Innate-like recognition of microbes by invariant natural 698
killer T cells. Curr Opin Immunol 2009; 21:6. 699
9. Tuttle KD, Krovi SH, Zhang J, et al. TCR signal strength controls thymic 700
differentiation of iNKT cell subsets. Nat Commun 2018; 9:2650. 701
10. Zhao M, Svensson MND, Venken K, et al. Altered thymic differentiation and 702
modulation of arthritis by invariant NKT cells expressing mutant ZAP70. Nat Commun 703
2018; 9:2627. 704
11. Malhotra N, Qi Y, Spidale NA, et al. SOX4 controls invariant NKT cell 705
differentiation by tuning TCR signaling. J Exp Med 2018; 215:2887–2900. 706
12. Ziętara N, Łyszkiewicz M, Witzlau K, et al. Critical role for miR-181a/b-1 in 707
agonist selection of invariant natural killer T cells. Proc Natl Acad Sci U S A 2013; 708
110:7407–7412.
709
13. Henao-Mejia J, Williams A, Goff LA, et al. The microRNA miR-181 is a critical 710
cellular metabolic rheostat essential for NKT cell ontogenesis and lymphocyte 711
development and homeostasis. Immunity 2013; 38:984–997. 712
14. Wencker M, Turchinovich G, Di Marco Barros R, et al. Innate-like T cells straddle 713
innate and adaptive immunity by altering antigen-receptor responsiveness. Nat 714
Immunol 2014; 15:80–87. 715
15. Seo W, Taniuchi I. Transcriptional regulation of early T-cell development in the 716
thymus. Eur J Immunol 2016; 46:531–538. 717
16. Maillard I, Fang T, Pear WS. Regulation of lymphoid development, differentiation, 718
and function by the Notch pathway. Annu Rev Immunol 2005; 23:945–974. 719
17. Murre C. Helix-loop-helix proteins and lymphocyte development. Nat Immunol 720
2005; 6:1079–1086. 721
18. Hosokawa H, Rothenberg EV. Cytokines, Transcription Factors, and the Initiation 722
of T-Cell Development. Cold Spring Harb Perspect Biol 2018; 10. 723
19. Gheldof A, Hulpiau P, van Roy F, De Craene B, Berx G. Evolutionary functional 724
analysis and molecular regulation of the ZEB transcription factors. Cell Mol Life Sci 725
CMLS 2012; 69:2527–2541. 726
20. Takagi T, Moribe H, Kondoh H, Higashi Y. DeltaEF1, a zinc finger and 727
homeodomain transcription factor, is required for skeleton patterning in multiple 728
lineages. Dev Camb Engl 1998; 125:21–31. 729
21. Caramel J, Ligier M, Puisieux A. Pleiotropic Roles for ZEB1 in Cancer. Cancer 730
Res 2018; 78:30–35. 731
22. Conidi A, Cazzola S, Beets K, et al. Few Smad proteins and many Smad-732
interacting proteins yield multiple functions and action modes in TGFβ/BMP signaling 733
in vivo. Cytokine Growth Factor Rev 2011; 22:287–300. 734
23. Scott CL, Omilusik KD. ZEBs: Novel Players in Immune Cell Development and 735
Function. Trends Immunol 2019; 40:431–446. 736
24. van Helden MJ, Goossens S, Daussy C, et al. Terminal NK cell maturation is 737
controlled by concerted actions of T-bet and Zeb2 and is essential for melanoma 738
rejection. J Exp Med 2015; 212:2015–2025. 739
25. Dominguez CX, Amezquita RA, Guan T, et al. The transcription factors ZEB2 and 740
T-bet cooperate to program cytotoxic T cell terminal differentiation in response to 741
LCMV viral infection. J Exp Med 2015; 212:2041–2056. 742
26. Omilusik KD, Best JA, Yu B, et al. Transcriptional repressor ZEB2 promotes 743
terminal differentiation of CD8+ effector and memory T cell populations during 744
infection. J Exp Med 2015; 212:2027–2039. 745
27. Higashi Y, Moribe H, Takagi T, et al. Impairment of T cell development in 746
deltaEF1 mutant mice. J Exp Med 1997; 185:1467–1479. 747
28. Arnold CN, Pirie E, Dosenovic P, et al. A forward genetic screen reveals roles for 748
Nfkbid, Zeb1, and Ruvbl2 in humoral immunity. Proc Natl Acad Sci 2012; 109:12286– 749
12293. 750
29. Heng TSP, Painter MW, Immunological Genome Project Consortium. The 751
Immunological Genome Project: networks of gene expression in immune cells. Nat 752
Immunol 2008; 9:1091–1094. 753
30. Guan T, Dominguez CX, Amezquita RA, et al. ZEB1, ZEB2, and the miR-200 754
family form a counterregulatory network to regulate CD8+ T cell fates. J Exp Med 755
2018; 215:1153–1168. 756
31. Jones ME, Zhuang Y. Stage-specific functions of E-proteins at the β-selection 757
and T-cell receptor checkpoints during thymocyte development. Immunol Res 2011; 758
49:202–215.
759
32. Emmanuel AO, Arnovitz S, Haghi L, et al. TCF-1 and HEB cooperate to establish 760
the epigenetic and transcription profiles of CD4+CD8+ thymocytes. Nat Immunol 761
2018; 19:1366–1378. 762
33. Rahim MMA, Tu MM, Mahmoud AB, et al. Ly49 Receptors: Innate and Adaptive 763
Immune Paradigms. Front Immunol 2014; 5. 764
34. Grigoriadou K, Boucontet L, Pereira P. Most IL-4-producing gamma delta 765
thymocytes of adult mice originate from fetal precursors. J Immunol Baltim Md 1950 766
2003; 171:2413–2420. 767
35. Gapin L. iNKT cell autoreactivity: what is “self” and how is it recognized? Nat Rev 768
Immunol 2010; 10:272–277. 769
36. Tuttle KD, Gapin L. Characterization of Thymic Development of Natural Killer T 770
Cell Subsets by Multiparameter Flow Cytometry. Methods Mol Biol Clifton NJ 2018; 771
1799:121–133.
772
37. Zhou Y, Zhou B, Pache L, et al. Metascape provides a biologist-oriented resource 773
for the analysis of systems-level datasets. Nat Commun 2019; 10:1523. 774
38. Szklarczyk D, Franceschini A, Wyder S, et al. STRING v10: protein-protein 775
interaction networks, integrated over the tree of life. Nucleic Acids Res 2015; 776
43:D447-452.
777
39. Liston A, Hardy K, Pittelkow Y, et al. Impairment of organ-specific T cell negative 778
selection by diabetes susceptibility genes: genomic analysis by mRNA profiling. 779
Genome Biol 2007; 8:R12. 780
40. Kastner P, Chan S, Vogel WK, et al. Bcl11b represses a mature T-cell gene 781
expression program in immature CD4(+)CD8(+) thymocytes. Eur J Immunol 2010; 782
40:2143–2154.
783
41. Yoshida H, Lareau CA, Ramirez RN, et al. The cis-Regulatory Atlas of the Mouse 784
Immune System. Cell 2019; 176:897-912.e20. 785
42. Bedel R, Berry R, Mallevaey T, et al. Effective functional maturation of invariant 786
natural killer T cells is constrained by negative selection and T-cell antigen receptor 787
affinity. Proc Natl Acad Sci 2014; 111:E119–E128. 788
43. Hayes SM, Love PE. Strength of signal: a fundamental mechanism for cell fate 789
specification. Immunol Rev 2006; 209:170–175. 790
44. Haks MC, Lefebvre JM, Lauritsen JPH, et al. Attenuation of gammadeltaTCR 791
signaling efficiently diverts thymocytes to the alphabeta lineage. Immunity 2005; 792
22:595–606.
793
45. Alonzo ES, Gottschalk RA, Das J, et al. Development of promyelocytic zinc finger 794
and ThPOK-expressing innate gamma delta T cells is controlled by strength of TCR 795
signaling and Id3. J Immunol Baltim Md 1950 2010; 184:1268–1279. 796
46. Ilangumaran S, Forand-Boulerice M, Bousquet SM, et al. Loss of GIMAP5 797
(GTPase of immunity-associated nucleotide binding protein 5) impairs calcium 798
signaling in rat T lymphocytes. Mol Immunol 2009; 46:1256–1259. 799
47. Howie D, Nolan KF, Daley S, et al. MS4A4B is a GITR-associated membrane 800
adapter, expressed by regulatory T cells, which modulates T cell activation. J 801
Immunol Baltim Md 1950 2009; 183:4197–4204. 802
48. Carlson CM, Endrizzi BT, Wu J, et al. Kruppel-like factor 2 regulates thymocyte 803
and T-cell migration. Nature 2006; 442:299–302. 804
49. Gubbels Bupp MR, Edwards B, Guo C, et al. T cells require Foxo1 to populate 805
the peripheral lymphoid organs. Eur J Immunol 2009; 39:2991–2999. 806
50. Li L, Bhatia R. Molecular Pathways: Stem Cell Quiescence. Clin Cancer Res Off 807
J Am Assoc Cancer Res 2011; 17:4936–4941. 808
51. Hedrick SM, Michelini RH, Doedens AL, Goldrath AW, Stone EL. FOXO 809
transcription factors throughout T cell biology. Nat Publ Group 2012; 12:649–662. 810
52. Shi LZ, Saravia J, Zeng H, et al. Gfi1-Foxo1 axis controls the fidelity of effector 811
gene expression and developmental maturation of thymocytes. Proc Natl Acad Sci U 812
S A 2017; 114:E67–E74. 813
53. D’Cruz LM, Knell J, Fujimoto JK, Goldrath AW. An essential role for the 814
transcription factor HEB in thymocyte survival, Tcra rearrangement and the 815
development of natural killer T cells. Nat Immunol 2010; 11:240–249. 816
54. Brabletz T, Jung A, Hlubek F, et al. Negative regulation of CD4 expression in T 817
cells by the transcriptional repressor ZEB. Int Immunol 1999; 11:1701–1708. 818
55. Postigo AA, Ward E, Skeath JB, Dean DC. zfh-1, the Drosophila Homologue of 819
ZEB, Is a Transcriptional Repressor That Regulates Somatic Myogenesis. Mol Cell 820
Biol 1999; 19:7255–7263. 821
56. Grégoire JM, Roméo PH. T-cell expression of the human GATA-3 gene is 822
regulated by a non-lineage-specific silencer. J Biol Chem 1999; 274:6567–6578. 823
57. Wang L, Ni X, Covington KR, et al. Genomic profiling of Sézary syndrome 824
identifies alterations of key T cell signaling and differentiation genes. Nat Genet 825
2015; 47:1426–1434. 826
58. Mishra A, La Perle K, Kwiatkowski S, et al. Mechanism, Consequences, and 827
Therapeutic Targeting of Abnormal IL15 Signaling in Cutaneous T-cell Lymphoma. 828
Cancer Discov 2016; 6:986–1005. 829
59. Doisne J-M, Bartholin L, Yan K-P, et al. iNKT cell development is orchestrated by 830
different branches of TGF- signaling. J Exp Med 2009; 206:1365–1378. 831
60. Picelli S, Faridani OR, Björklund AK, Winberg G, Sagasser S, Sandberg R. Full-832
length RNA-seq from single cells using Smart-seq2. Nat Protoc 2014; 9:171–181. 833
834 835 836
Figure legends
837 838
Figure 1: Zeb1 expression in WT and Cellophane thymocytes
839
(A-B) RT-PCR analysis of RNA from sorted thymocyte subsets isolated from 840
C57BL/6 mice, as indicated. Results are presented relative to expression of the 841
control gene Gapdh. (C) WB analysis of Zeb1 expression in total thymocytes of WT 842
and Cellophane mice, as indicated. Data are representative of three independent 843
experiments with 3 to 6 mice (A-B) or three independent experiments with three mice 844
(C). 845
846
Figure 2: Cellularity and proportion of T cell subsets in Cellophane mice.
847
(A) Total cell number from the thymus, spleen, liver and LN. (B) Percentages and 848
absolute numbers of indicated T cell subsets (DN, DP, Cd4 SP and Cd8 SP) in the 849
thymus. (C) Percentages and absolute numbers of indicated DN subsets defined by 850
Cd44 and Cd25 expression in the thymus. (D-E) Percentages and absolute numbers 851
of (D) Cd4 T cells and (E) Cd8 T cells. (F) Percentages and absolute numbers of 852
CD8+ Cd44+ memory T cell in LN and spleen. Each dot represents an individual 853
mouse. Data are pooled from 7 to 8 mice in four experiments (A-E) or 3 to 6 mice in 854
two experiments (F). The statistical analysis was performed using unpaired Student t 855
test. 856
857
Figure 3: Cellophane mice have decreased numbers of thymic DP and lack
858
iNKT cells, NK1.1+ γδ T cells and Ly49+ Cd8 cells.
859
(A) Flow cytometry analysis of Cd1d-tet+ iNKT cells (black gate) from thymus, spleen,
860
and liver in wild-type (WT) and Cellophane (Cello) homozygous mice as indicated. 861
(B) Percentage and absolute numbers of iNKT cells (mCd1d/PBS-57+ TCRβ+) in 862
thymus, spleen, and liver. (C) Flow cytometry analysis of NK1.1- and NK1.1+ γδ T 863
cells (black square gates) from the spleen of WT and Cellophane mice. (D) 864
Percentage within total γδ T cells and absolute numbers of NK1.1- and NK1.1+ γδ T
865
cells in spleen and LN. (E) Percentage within total thymic iNKT of stages 0-3, as 866
defined by Cd24, Cd44 and NK1.1 expression. (F) Flow cytometry analysis of Cd8+ 867
Cd44+ Ly49A+ / Ly49F+ / Ly49G2+ T cells (black square gates) from LN and spleen in 868
WT and Cellophane mice. (G) Percentage within Cd8+Cd44+ T cells and absolute 869
numbers of Cd8+ Cd44+ Ly49+ T cells in spleen and LN. Each dot represents an