HAL Id: tel-03152984
https://tel.archives-ouvertes.fr/tel-03152984
Submitted on 26 Feb 2021
HAL is a multi-disciplinary open access
archive for the deposit and dissemination of sci-entific research documents, whether they are pub-lished or not. The documents may come from teaching and research institutions in France or abroad, or from public or private research centers.
L’archive ouverte pluridisciplinaire HAL, est destinée au dépôt et à la diffusion de documents scientifiques de niveau recherche, publiés ou non, émanant des établissements d’enseignement et de recherche français ou étrangers, des laboratoires publics ou privés.
Damage detection for wind turbine towers with Digital
Image Correlation
Jordan Curt
To cite this version:
Jordan Curt. Damage detection for wind turbine towers with Digital Image Correlation. Mechanics of materials [physics.class-ph]. Université Paris-Saclay, 2021. English. �NNT : 2021UPAST008�. �tel-03152984�
Thè
se de
doctorat
NNT : 2021UP AST008Damage detection for wind
turbine towers with digital
image correlation
Thèse de doctorat de l’Université Paris-Saclay
École doctorale n◦ 579, Sciences mécaniques et
énergétiques, matériaux et géosciences (SMEMAG)
Spécialité de doctorat: Mécanique des solides Unité de recherche: Université Paris-Saclay, ENS Paris-Saclay, CNRS, LMT - Laboratoire de Mécanique et Technologie, 91190, Gif-sur-Yvette, France Référent: : ENS Paris-Saclay
Thèse présentée et soutenue en visioconférence totale le 8 janvier 2021, par
Jordan Curt
Composition du jury:
Véronique Aubin Présidente
Professeure, Centrale-Supélec, MSSMAT
Evelyne Toussaint Rapporteur Professeure, Université Clermont-Auvergne, IP
Jean-Charles Passieux Rapporteur Professeur, INSA Toulouse, ICA
Sylvain Calloch Examinateur
Professeur, ENSTA Bretagne, IRDL
Jan Neggers Examinateur
Maître de Conférence, Centrale-Supélec, MSSMAT
Mathieu Corus Examinateur
Ingénieur de recherche expert, EDF R&D
Stéphane Roux Directeur de thèse Directeur de Recherche, CNRS, ENS Paris-Saclay, LMT
François Hild Codirecteur de thèse Directeur de Recherche, CNRS, ENS-Paris-Saclay, LMT
Remerciements
Afin de mettre un point final à ce long périple qu’est la thèse, il ne me reste qu’à exprimer de nombreux remerciements aux personnes qui m’ont permis d’aller au bout de cette aventure...
Tout d’abord, je remercie sincèrement tous les membres du jury, pour leurs nombreuses questions et l’intérêt qu’ils ont porté à mon travail. Merci beaucoup à V. Aubin d’avoir accepté de présider ce jury. Une thèse ne peut être soutenue sans le travail préalable des rapporteurs, et je veux témoigner ici à E. Toussaint et J-C. Passieux toute ma reconnaissance.
J’adresse un grand MERCI à mes directeurs de thèse Stéphane et François. Ces trois années sont passées si vite, j’ai beaucoup appris à leurs côtés, bien plus que ce que j’aurais pu imaginer. Leur disponibilité et leur pédagogie ont été de grands atouts pour mener à bien ce travail.
Côté entreprise, je remercie grandement Matteo pour son accompagnement, son soutien, ses blagues et sa grande aide pour la logistique au cours de cette thèse. Les souvenirs de virée sur site et de pose de caméra à 35m de hauteur resteront gravés dans ma mémoire.
Je remercie tous les membres du LMT pour l’ambiance qui y règne. Merci beaucoup à Charlène et Xavier pour leur aide, tant administrative que logistique. Merci à mes co-bureaux pour les excellents moments : les rires et les discussions passionnées ont toujours été au rendez vous.
J’ai eu chance d’appartenir à un super groupe côté EDF pendant ces trois ans. Malgré le RER B c’était toujours un plaisir d’aller sur site, merci la team T6E ! Mention spéciale à mes collègues doctorants Anais, Quentin et Antoine ! Merci à Malika et Catherine pour leur aide administrative et leur patience, j’étais loin d’être le meilleur dans ce domaine.
Je remercie tous mes amis qui m’ont soutenu tout au long de ce travail. Voir autant d’eux assister (même en visio) à ma soutenance m’a fait chaud au coeur. Mention spéciale à Bap qui a partagé mon quotidien durant les deux premières années... Malineum manilae exae.
Je remercie mes parents, ma famille qui m’ont accompagné au cours de ce travail. Un grand merci également à la famille Eon pour son soutien !
Les derniers (et plus grands) remerciements vont à Delphine, qui m’a soutenu et motivé tout au long de ce travail. Sa grande positivité ainsi que ses conseils ont été, jusqu’au dernier jour, essentiels à ma réussite.
A ceux qui s’aventureront vers la suite de ce manuscrit, je vous souhaite une lecture aussi plaisante que possible !
Contents
1 Introduction 9
1.1 Introduction to Wind Energy . . . 10
1.2 Industrial context . . . 12
1.3 Wind turbine tower lifetime . . . 13
1.3.1 Aeroelastics loads . . . 14
1.3.2 Calculation methods . . . 14
1.3.3 Associated uncertainties . . . 15
1.3.4 Residual life time estimation and structure integrity . . . 16
1.3.5 Wind turbine incidents and failures . . . 17
1.4 Wind turbine tower health estimation . . . 22
1.4.1 Non destructive testing . . . 22
1.4.2 Structural Health Monitoring . . . 23
1.5 Scientific issues . . . 24
2 Simulation of a wind turbine tower failure 29 2.1 Introduction . . . 30
2.2 Buckling of a wind turbine tower . . . 30
2.2.1 Litterature review on buckling . . . 30
2.2.2 Buckling simulation with an academic turbine model . . . 33
2.3 Wind turbine failure by crack propagation . . . 39
2.3.1 Literature review . . . 39
2.3.2 Fracture mechanics . . . 40
2.3.3 Application to NREL case . . . 43
2.4 Failure modes and simulation of a storm case . . . 44
2.4.1 Worst failure mode with a crack . . . 44
2.4.2 Simulation of critical load . . . 46
2.5 Conclusion and perspectives . . . 48
3 DIC principle 49 3.1 Introduction . . . 50
3.2 Instantaneous DIC . . . 51
3.2.1 Monochrome DIC . . . 51
3.2.2 Displacement measurement . . . 52
3.2.3 Measurement uncertainty . . . 53
3.2.4 Gray level correction . . . 54
3.3 Spatio-temporal DIC . . . 54
3.3.1 Introduction . . . 54
3.3.2 Classical spatio-temporal DIC . . . 55
3.3.3 Spatio-temporal PGD-DIC . . . 55
3.3.4 Summary . . . 57
3.4 Optimal Color Digital Image Correlation . . . 57
3.4.1 Introduction . . . 57
3.4.2 Color image registration . . . 59
3.4.3 Noise characterization . . . 61
3.4.4 Uncertainty quantifications . . . 69
3.4.5 Conclusion and outlook . . . 72
4 Damage detection at the mesoscale 75 4.1 Structural Health Monitoring with DIC . . . 76
4.1.1 Introduction . . . 76
4.1.2 Damage detection via DIC . . . 79
4.1.3 Case study: Fatigue crack propagation . . . 80
4.1.4 New DIC approach based on optimal extractors . . . 88
4.1.5 Application of one-step DIC . . . 93
4.1.6 Example of extractor . . . 94
4.1.7 Conclusion . . . 95
4.2 Logistical aspects . . . 97
4.2.1 Device . . . 97
4.2.2 Needed measurement resolution . . . 97
4.2.3 Camera . . . 98
4.3 Conclusion and perspectives . . . 100
5 Damage detection at the macroscale 101 5.1 Introduction . . . 102
5.1.1 Measurement of large structures in an outdoor environment . . . 102
5.1.2 Operative Modal Analysis (OMA) . . . 103
5.1.3 Modal analysis with DIC . . . 104
5.2 Wind turbine tower displacement measurement . . . 105
5.2.2 Strategy . . . 108
5.2.3 Displacement measurement . . . 109
5.3 Wind turbine tower modal analysis . . . 111
5.3.1 First frequency measurement . . . 111
5.3.2 Second frequency measurement . . . 112
5.3.3 Influence of the FE model . . . 116
5.3.4 Summary . . . 116
5.4 Damage identification . . . 118
5.4.1 DIC based methods to calibrate FE models . . . 118
5.4.2 Damage quantification via DIC . . . 118
5.4.3 Sensitivity to damage detection . . . 120
5.5 Conclusion and perspectives . . . 122
6 Conclusion and Perspectives 125 A Description of aeroelastic simulations 129 B One step DIC with large displacements 131 B.1 Inhomogeneous filtering . . . 131
B.2 Calibration of the filter . . . 132
B.3 Application to heterogeneous displacement fields . . . 132
C Transformation between the real world and the camera frame 137
D Résumé étendu en Français 141
List of Figures
1.1 Schematic view of an onshore wind turbine [Futuren, 2020]. . . 10
1.2 Production curve of a 3MW Vestas wind turbine [Harrison et al., 2008]. . . 11
1.3 Expected wind turbine hub height growth [Wiser et al., 2016]. . . 12
1.4 CapEx (a) and Levelized Cost Of Energy (LCOE) (b) for a wind turbine in 2018 [Stehly and Beiter, 2020]. . . 13
1.5 Classification of a wind site (a) and associated wind rose (b) [Loraux, 2018]. . . 14
1.6 Stress undergone by a wind turbine tower under a flexural loading [Loraux, 2018]. . 15
1.7 10 minutes damage (rainflow count and Miner rule) reported along seasons in [Lo-raux, 2018]. . . 16
1.8 Wind turbine failure (a) and dowtime (b) rates [Reder et al., 2016]. . . 17
1.9 Photo of a crack in a weld [Lacalle et al., 2011]. . . 18
1.10 Section of a collapsed wind turbine in Taiwan [Chou and Tu, 2011]. . . 19
1.11 Collapsed wind turbine in Germany [The-Civil-Engineer, 2017]. . . 19
1.12 Collapsed wind turbine in Bouin, France [Parisien, 2018]. . . 20
1.13 Collapsed wind turbine in Guigneville, France [France-3, 2018]. . . 21
1.14 Control of a wind turbine tower thanks to ultrasound waves [Force-Technology, 2020]. . . . 22
2.1 Tower without (a) and with refinement (b). . . 34
2.2 Applied force versus displacement at tower top. . . 35
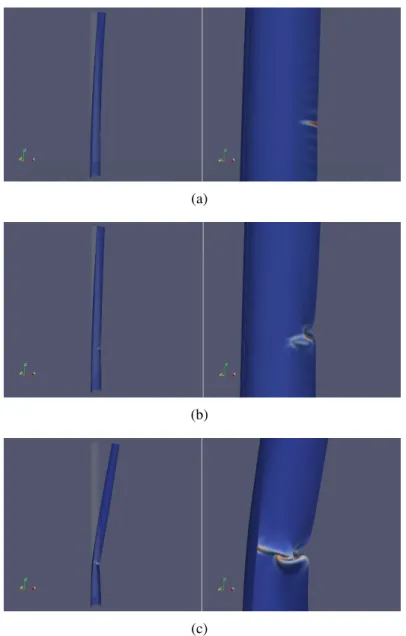
2.3 Tower deformation profiles at step B (a), step C (b) and step D (c) . The displacement is magnified ×1.5 and the colors highlight the plastic strains. . . 36
2.4 Example of wind turbine tower failing by buckling. [Jay et al., 2016] . . . 37
2.5 Zoom around the mesh of the crack. . . 38
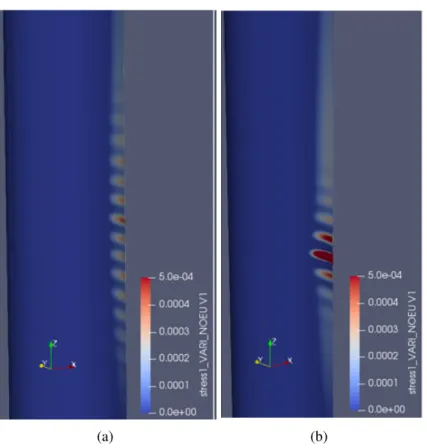
2.6 Plastic strain field for a 3MN load without (a) and with a crack (b). . . 38
2.7 Influence of a crack placed in the tearing or in the compressive side on the critical buckling load for several crack lengths at a 25 m height (a) and for different elevations in the tower (b). . . 39
2.8 Different modes of fracture. . . 40
2.9 Three crack propagation regimes [Dillian et al., 2017]. 1: no propagation, 2: stable propagation, 3: unstable propagation . . . 43
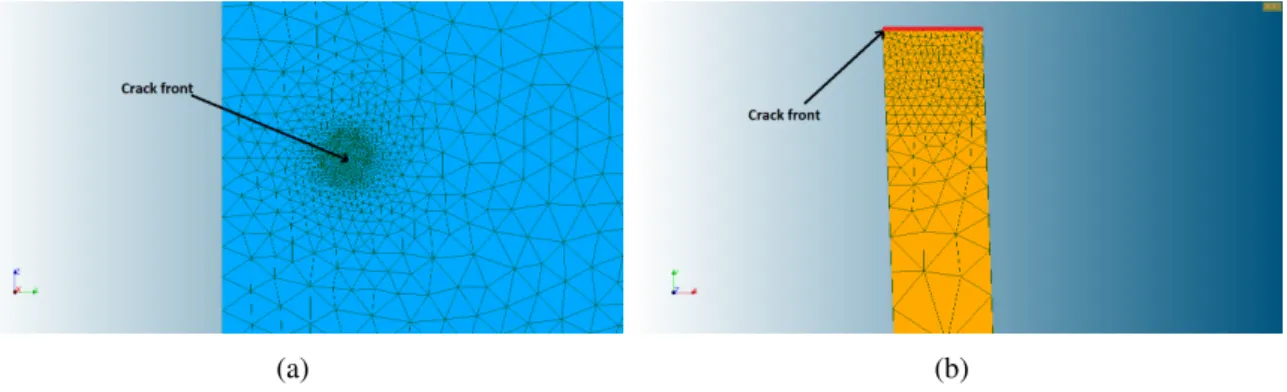
2.10 Mesh in the crack tip vicinity from side view (a) and upper view (b). . . 43
2.11 Strain energy release rate for a 10 cm crack for different upper integration bounds . . 44
2.12 Critical tower loads corresponding to several crack lengths . . . 45
2.13 Critical loadings concerning buckling and critical crack propagation. . . 45
2.14 Aeroelastic loads simulated with Diego with a wind misalignement of 20 degrees for a wind velocity of 50 m/s (a) and for others (b). . . 47
2.15 Maximums tower top loads due to rotor misalignment. . . 47
3.1 Bayer pattern that can be used in color cameras . . . 59
3.2 Color speckle pattern used herein . . . 61
3.3 Autocorrelation functions for the red field for the first (a) and second (b) images . . 63
3.4 Autocorrelation functions along x (a) and y (b) directions . . . 64
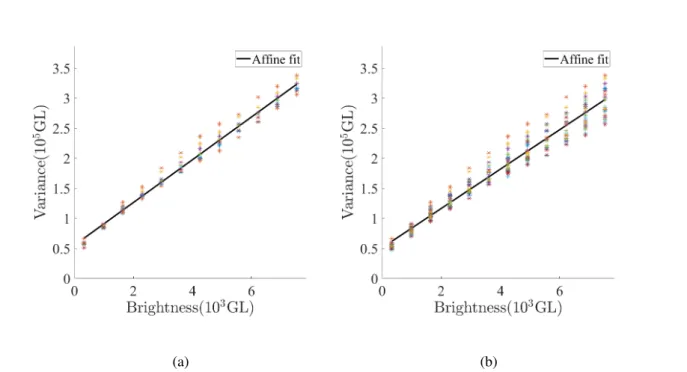
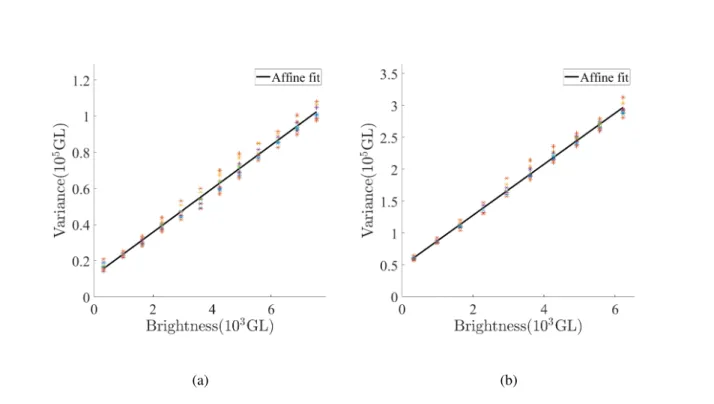
3.5 Variance of red brightness with (a) and without (b) corrections for rigid body mo-tions. Units are in color levels (GL), encoded over 16 bits. The different symbols corresponds to the different images. . . 65
3.6 Variance for the green (a) and blue (b) color fields as functions of the brightness level 66 3.7 Variances for the green (a) and blue (b) color fields after Anscombe transform . . . . 67
3.8 Plot of noise covariance matrix eigenvectors in planes (a) Red-Green, (b) Red-Blue and (c) Green-Blue. The eigenvector denoted as “Vect i − j” corresponds to the ith eigenvector of the jth image . . . 68
3.9 Projections of Figure 3.2 onto (a) first, (b) second, and (c) third color modes. . . 69
3.10 Black and white speckle pattern used herein . . . 70
3.11 Standard displacement uncertainties with a black and white speckle pattern along x (a) and y (b) directions . . . 71
3.12 Standard displacement uncertainties with a color speckle pattern along x (a) and y (b) directions . . . 72
4.1 (a) Experimental set up. (b) Specimen surface monitored by the camera . . . 81
4.2 (a) Mesh used in T3-DIC analyses. The red rectangle is the region used to pre-calculate the rigid body translations. (b) Zoom of the mesh showing the refinement close to the crack tip. . . 82
4.3 (a) Eigen values associated with the first 15 modes. (b) Temporal modes φi(t). . . . 83
4.4 (a,c) First spatial mode Ψ∗1respectively along x and y directions. (b,d) Corresponding displacement modes Ψ1. . . 84
4.5 Second spatial mode Ψ2along x (a) and y (b) directions. . . 85
4.6 Third spatial mode Ψ3along x (a) and y (b) directions. . . 85
4.7 Projection displacement error indicators for all five steps. (a,b) Standard deviation for 3 and 6 modes respectively. (b,d) Corresponding maximum levels. . . 87
4.8 Normalized standard deviation (a) and maximum (b) displacement errors as functions of the number of modes. . . 88 4.9 Displacements fields (expressed in px) along the x-direction for steps 1 (a) and 3 (c),
and the corresponding projection errors (b,d). . . 89 4.10 Locations of maximum error for the steps 1 (a) and 3 (b). . . 90 4.11 Comparison of mean RMS residuals before and after BC corrections for the five steps. 90 4.12 (a) Comparison of RMS residuals with direct DIC and after projection onto the modal
basis. (b) Error induced by projection onto the modal displacement basis. . . 91 4.13 Optimal filtering length for subpixel rigid body translations. . . 93 4.14 (a) Mean “One-step” DIC absolute error and its standard deviation over the whole set
of images from the learning step. (b) Results detailed along each direction. . . 94 4.15 Filtered image (a) and extractor (b) for the first mode. . . 95 4.16 Mean RMS residuals after one-step DIC (a). RMS residuals differences between the
initial step and the other steps for both T3-DIC and “one-step” DIC. . . 96 4.17 Modeling schematic of the displacement perturbation induced by a crack (a) and
as-sociated results (b). The displacement jump is recorded at the crack middle, where it is maximum. . . 98 4.18 Picture of a Raspberry Pi and the associated camera. . . 99 4.19 Experimental set-up (a). The camera is inside the red rectangle, and the observed
zone is in the blue rectangle. Camera field of view with DIC mesh (b). . . 99 5.1 (a) Set-up for image acquisition of the wind turbine tower. (b) Picture of the wind
turbine tower taken by the camera. . . 106 5.2 Gray level through a horizontal line (a) and corresponding gradient (b). . . 107 5.3 Images acquired with a E70D camera of wind turbines without (a) and with blade
shadow (b). . . 107 5.4 Zoom of the turbine (a) and corresponding selection of pixels (of white color) for DIC
application (b). . . 108 5.5 Three first modes of the wind turbine tower model calculated with a multiple beam
FE code. The y-axis is dimensionless with respect to the tower height. . . 109 5.6 Measurement uncertainty associated with each degree of freedom depending on the
number of vibration modes. . . 110 5.7 (a) Time history of the amplitudes of the two degrees of freedom (translation in blue,
and first vibration mode in orange) considered in the DIC analysis for series # 1. (b) Time amplitude of the first vibration mode for series # 1 and # 4 showing similar oscillations although with different amplitudes depending on series. . . 112 5.8 Power spectrum (a) and estimated peak frequency values with corresponding error
bars (b) for the four pictures sets. The power spectrum is the squared Fast Fourier Transform. . . 113
5.9 Temporal amplitudes obtained for experiment #1 (a) and power spectra obtained for the second mode temporal signal (b). . . 113 5.10 Amplitude of the first vibration mode with a PGD approach of experiment #1. . . . 114 5.11 Temporal shape functions used for the spatio-temporal approach. . . 115 5.12 Temporal norm for several frequencies of the second vibration modes for all four
experiments. . . 116 5.13 Influence of the RNA stiffness on the first (a) and second (b) mode shapes. The y-axis
is dimensionless with respect to the tower height. . . 117 5.14 Sensitivity field relative to damage for the first vibration mode (a). It is calculated by
considering a damage level D = 0.01 at 25 m height (0.31% of the total tower height). 119 5.15 Zoom of the 3D FE mesh of the tower with a crack. . . 121 5.16 Comparison between 3D FE model and a beam model about kinematic impact of
damage. The graph has two ordinates: the homogenised damage variable for the beam model and the crack length for the 3D model. . . 121 5.17 Measurement uncertainty relative to damage variable. . . 122 A.1 Corrected coefficients of the NACA64 airfoil [Jonkman et al., 2009]. . . 129 A.2 NREL 5MW model rendering in DIEGO. The arrows represent the wind velocity at
multiple points. . . 130 B.1 Absolute (a) and relative (b) optimal filtering lengths. . . 132 B.2 (a) Displacement map along x-direction in pixels. (b) Corresponding adaptively
fil-tered image. . . 133 B.3 One-step DIC error with homogeneous and inhomogeneous filtering over the whole
set of displacement fields, for case 1 (a) and case 2 (b). . . 134 B.4 One-step DIC error with homogeneous and inhomogeneous filtering for the larger
displacement magnitude, for case 1 (a) and case 2 (b). . . 135 C.1 Experimental scheme relative to the tower displacement measurement. . . 137
List of Tables
2.1 NREL wind turbine parameters. [Jonkman, 2010] . . . 33
3.1 DIC hardware parameters . . . 61
3.2 DIC analysis parameters for rigid body translations . . . 62
3.3 DIC analysis parameters . . . 71
4.1 DIC hardware parameters . . . 81
4.2 DIC analysis parameters . . . 82
4.3 Simulation parameters . . . 97
4.4 Pi Camera properties . [Arducam, 2020] . . . 99
4.5 DIC hardware parameters. . . 100
5.1 DIC hardware parameters. . . 105
5.2 Turbine parameters. . . 106
5.3 DIC analysis parameters . . . 110
5.4 Results for the measurement of the second natural frequency. . . 116
Chapter 1
Introduction
Summary
This chapter aims at introducing the context of the thesis and presenting the scientic issues that will be adressed in the following chapters.
1.1
Introduction to Wind Energy
The use of fossil fuels since the industrial revolution as a source of energy has led to the release of large quantities of greenhouse gases into the atmosphere. The concentration of these gases has resulted in an increase in the average temperature on the globe, which in the long term, if nothing is done, will have disastrous consequences. The end of the 20th century and the beginning of the 21st century marked a growing awareness of the world population with regard to global warming. Worldwide political decisions were taken to limit global warming, the first emblematic step in this fight was the ratification of the Kyoto Protocol in 1997 by 196 countries around the world [UNFCCC, 2009] . The main point of the agreement was to reduce carbon dioxide emissions. In this context, the sovereign states around the world undertook to develop so-called renewable energies in order to substitute them for fossil energies such as coal, oil or gas. Electricité De France, the historic French company and now the leading European producer and second largest producer in the world, has significantly invested in the development of low-carbon energy worldwide. Wind power is one of the major components of the energy transition alongside nuclear, hydraulic and solar power. EDF holds nearly 10 GW of wind power capacity worldwide through its subsidiary EDF Renewables [EDF-Renewables, 2020].
A wind turbine is a device that transforms the kinetic energy of the wind into electricity by passing through a mechanical converter. There are two types of wind turbines: horizontal and vertical axis. The first ones are the most widely used industrially. Several components make up a wind turbine as shown in Figure 1.1.
Figure 1.1: Schematic view of an onshore wind turbine [Futuren, 2020].
First, the rotor, which generally consists of three composite blades attached to a hub. There are upwind and downwind rotors, much less common due to poorer performance results. The rotor axis is always along the wind direction to take full advantage of the rotating blade profile. This rotor is
linked to a nacelle, which contains the whole chain of conversion of the mechanical energy from the rotor into electrical energy. This nacelle pivots with the rotor to face the wind thanks to continuously collected anemometric data. The orientation of the rotor is updated, usually every 30 seconds, by means of a Supervisory Control And Data Acquisition (SCADA) system [Yang and Jiang, 2011]. This system allows continuous data storage and feedback control strategies. The assembly is based on a conical tower with a circular cross-section made of steel. The different circular parts of the tower are bolted and welded together. Finally, the tower is built on a concrete foundation. The turbine electricity generation depends on the wind conditions. The power profile is separated into three phases:
• Below a particular wind velocity threshold, the turbine does not produce energy and the rotor remains motionless.
• When the wind velocity exceeds this threshold, the lift force acting on the blades is sufficient to induce rotor rotation. The turbine starts to produce energy. The rotation velocity increases with that of wind and at some point the turbine reaches a plateau of nominal production level. • When the wind outreaches the security threshold, the turbine stops and is automatically placed
in emergency stop position.
The power curve of a Vestas V90 turbine is presented in Figure 1.2. It can be noticed that the power production is maximum for a wind velocity of 15 m/s.
Figure 1.2: Production curve of a 3MW Vestas wind turbine [Harrison et al., 2008].
The choice of turbine type depends on site wind conditions, and the landscape according to the standards [IEC, 2005].
1.2
Industrial context
In Europe, the first onshore wind turbines with a capacity of 20kW were installed in 1982 [Carlin et al., 2003]. Since then, the power of the machines has continuously increased and the market for wind turbines has been growing both onshore and offshore. In Europe, electricity from wind power has reached 14.5% of total electricity production from all sources [EWEA, 2019]. However, the ageing of onshore wind farms now becomes a concern. Wind turbines are designed to last 20 years. Currently, it is estimated that 15% of the European wind farms have reached at least 15 years of operation [EWEA, 2019]. This observation leads to several issues. The first one concerns the operations and maintenance actions to certify structural integrity until the end of the planned operating period. The older the turbines, the more accute these concerns. The second one, which is directly related to the former is about the wind park future. Park operators have several choices:
• It may be decided to dismantle the old machines and replace them with new, more efficient ones. This choice makes sense, as long as technological innovation makes it possible in terms of gains.
• A hybrid solution is repowering. This option involves keeping the foundations and the tower of the wind turbine, and only replacing the nacelle and the rotor. These elements are the most expensive and the most subject for technological innovations.
• The last solution is to extend the service duration of the parks.
As far as technological innovation is concerned, there is a continuous increase in the power of the turbines and therefore in the size of the towers and blades, as shown in Figure 1.3. Nowadays largest turbines reach 10MW, General Electric already announced the production of the Haliade-X 12 MW model. In the next ten years, capacity is expected to reach 15 MW [Wiser et al., 2016].
Figure 1.3: Expected wind turbine hub height growth [Wiser et al., 2016].
However, the deployment of larger turbines on land is restricted for several reasons in the French case:
• Lack of wind strong enough inland to make it profitable to install larger turbines. • Military restrictions on the flight of combat helicopters, for instance.
It should be noted that the cost of a wind turbine is important, especially at the initial investment level. In 2010, the National Renewable Energy Laboratory estimated the Capital Expenditure (CapEx) of an onshore wind turbine to be 1970 e per KW [Tegen et al., 2012]. In 2018 this cost dropped to 1350e per KW [Stehly and Beiter, 2020]. Thus, for a 2 MW wind turbine, the initial investment is in the range of about 3 to 4 million e. This amount covers the turbine price, the installation costs, and the electrical connection to the grid representing about 70% of the total cost over the turbine lifetime. The remaining 30% is associated with operation and maintenance costs. The nacelle is the most expensive component of a turbine, accounting for 25% of the price, followed by the rotor for 20% and the tower for 15%. These figures are summarized in Figure 1.4.
(a) (b)
Figure 1.4: CapEx (a) and Levelized Cost Of Energy (LCOE) (b) for a wind turbine in 2018 [Stehly and Beiter, 2020].
The solutions that enable to certify the structure integrity will help to lower operations and main-tenance costs. The repowering and extending park exploitation solutions would also rely on these methods to estimate park residual lifes.
1.3
Wind turbine tower lifetime
Wind turbine providers design their structures respecting three constraints according to the standards [IEC, 2005]:
• Natural frequencies of the system have to be far away from "3P" frequency, which is the blade rotation frequency.
• For the environmental condition and the wind turbine configuration giving the most extreme load on the structure, the material has to remain in the elastic domain when considering its plasticity criterion.
• Under extreme conditions the structure must resist against buckling failure.
• Wind turbines are subjected to cyclic loads. The structures can face fatigue problems. Fatigue is the weakening of a material, caused by repetitive loads. It is a progressive phenomenon. In most of the cases of interest, fatigue concerns chiefly localized defects which may grow and become critical. If the loads applied on a structure are above a certain threshold, microscopic cracks begin to form at stress concentrators until one of them reaches a critical size and suddenly propagates.
1.3.1
Aeroelastics loads
For onshore wind turbines, the loads are almost exclusively aerodynamic due to wind-blade inter-action. The tower is mainly stressed in bending and is subjected to repeated vibrations due to the variations in wind speed and the repeated passage of the blades in front of the tower. On-site mete-orological studies provide statistics on wind directions and speeds over time. Usually one dominant wind direction exists, as illustrated by the wind rose of Figure 1.5 characterising a site in Switzer-land [Loraux, 2018].
(a) (b)
Figure 1.5: Classification of a wind site (a) and associated wind rose (b) [Loraux, 2018].
1.3.2
Calculation methods
From these wind conditions, aerodynamics loads brought back to the hub are calculated [Ingram, 2011]. The structural dynamics of the tower is modeled by a multi-beam approach [Huchet, 2018] and a particular integration scheme is used to solve the whole aero-elastic problem. The stress distribution is not uniform on a tower, due to its design, as shown in Figure 1.6.
The lifetime calculation is made considering a single wind direction and a single position (local-ization of highest stress). From 10 minutes of real time simulations corresponding to a single set of wind characteristics, stress amplitudes are deduced by rainflow algorithms [Musallam and Johnson, 2012]. The service duration life is calculated by means of a damage variable, using Miner rule [Miner
Figure 1.6: Stress undergone by a wind turbine tower under a flexural loading [Loraux, 2018].
et al., 1945] and Wohler curves [Wöhler, 1867] of the used material [Veers and Winterstein, 1998,Ra-gan and Manuel, 2007].
1.3.3
Associated uncertainties
Uncertainties in this overall damage calculation are due to several factors that have been listed by EDF R&D. Some are created by errors or model and methodologies limitations (systemic uncertainties) and the others are driven by statistical random variability. The whole list is:
• Variability coming from each turbulence modeling. • Geographical variability in wind assessment. • Statistical variability of the S-N curve.
• On-site variability affecting material like corrosion or weld over-stressing. • Error from neglecting the change of wind direction during damage calculation. • Error from neglecting the mean stress effect when considering S-N curves. • Errors from controller issues noted during model validation.
All these sources of uncertainties can induce premature fatigue, this is why lifetime re-calibration strategies have been proposed.
1.3.4
Residual life time estimation and structure integrity
A small amount of works is dedicated to residual life assessment due to the recent interest in this field. Certification offices recommend to perform again aero-elastic calculations based on onsite data collected during the turbine life [Veritas, 2016, UL, 2016]. To go further, several works have been published about turbine instrumentation with strain gauges or accelerometers at specific points [Heilmann et al., 2014, Beganovic and Söffker, 2016, Rubert et al., 2019, Ziegler et al., 2018]. By precisely estimating the stresses experienced by the tower at several locations while correlating these measurements with anemometric data, statistics on the expected damage to the tower should be more accurate. In particular, Loraux’s work [Loraux, 2018] studied a wind turbine instrumented with 8 strain gauges, 3 temperature sensors and 3 accelerometers. This work has brought to light some very interesting observations about tower damage. First, the total damage, in the sense of Miner’s count, is mainly due to a very low number of cycles. In this particular case, 50% of the damage resulted from less than 1.29% of the monitoring duration. For 604 days of measurement, this most damaging time amounted to about 8 days, and corresponded to storms as represented in Figure 1.7.
Figure 1.7: 10 minutes damage (rainflow count and Miner rule) reported along seasons in [Loraux, 2018].
It appears that depending on the method used to count the loads experienced by the wind turbine over time, the predictions of lifetimes vary from 57 to 200 years. The adjustment variables are the safety factor for the loads, the partitioning time for the rainflow stress count and the consideration on the material S-N curve. This observation shows that the structures are expected to last beyond the service life recommended by the standards. The author specifies that the studied wind turbine is on a low wind site, so the loads were low as compared to other sites. Finally, measurement drifts were observed for the strain gauges. A resetting is possible thanks to temperature measurements close to the gauges but then the measurement uncertainty is amplified by about 20%. Such works are useful to validate fatigue calculations and correction methods. However, they still present the drawbacks that a possible damage appearance due to unforeseen events is not taken into account, which leads to a lot of uncertainties to certify structural integrity.
1.3.5
Wind turbine incidents and failures
Wind turbine incidents
There are numerous publications on the compilation of statistics on incidents involving onshore wind turbines [Wen et al., 2009, Dao et al., 2019, Mabel et al., 2011, Pérez et al., 2013]. However, few are about last generation wind turbines. To be clear, here an incident does not correspond to collapse. It refers to a problem that required an intervention and induced a turbine shutdown. One of the most recent and most complete studies concerns 2270 of latest generation wind turbines, i.e. with a capacity ranging from 1 to 3 MW, and an average operating life of 6 years [Reder et al., 2016]. This study is part of a European AWESOME project. Fault occurrences according to each wind turbine sub-component are presented in Figure 1.8.
(a) (b)
Figure 1.8: Wind turbine failure (a) and dowtime (b) rates [Reder et al., 2016].
Most of them are due to mechanical or electrical problems inside the nacelle. The electro-mechanical conversion chain is complex and composed of many elements. The incidents related to the tower are associated with the index "structure". This index also includes incidents in the foundations. These incidents present a very low occurence frequency. Regarding other reviews, the proportions are similar even with older wind turbines. The paper [Reder et al., 2016] states that most of the structural defects found occur early in the operation of the turbine and are due to malfunctions during instal-lation. For example, this can be a faulty foundation, loose bolts or cracks in welds. However it is underlined that the occurence of structural defects is expected to increase when the turbine age ex-ceeds 15 years. The set of studied turbine is now very small, young, and access to data is complicated, due to park operator policies. Some publications focused on cracks found in concrete foundations or welds. In Ref. [McAlorum et al., 2018], surface cracks in an onshore wind turbine foundation have been spotted. A strategy using fibre-optic based strain-sensors to monitor deterioration and determine crack severity over 9 months is presented. It was concluded that the crack growth is acceptable and the foundation would not need repairs. The potential causes of 10 cm crack initiation at the bottom of a 5 years old tower have been studied [Lacalle et al., 2011], a picture extracted from the article is
displayed in Figure 1.9.
Figure 1.9: Photo of a crack in a weld [Lacalle et al., 2011].
Finite element simulations, with precise geometrical description of the weld joints, showed that under normal conditions the fatigue experienced by the material should not induce cracks. However, cracks do appear in the areas of highest stress. The speculated causes are multiple like slight mis-alignment of weld joints and underestimated loadings. It can be guessed that the presence of defects in wind turbine towers may induce unexpected structure collapses.
Turbine collapse
Very few publications are devoted to the identification of incidents that have led to the fall of wind turbines. There are two main reasons for this. First, the number of large wind turbines that have collapsed is less than 100 [Ma et al., 2019], i.e., too small to be statistically significant. Second, the operating companies do not share their expert analysis of the causes of collapse. Yet, a paper published in 2019 tries to list all the cases of turbine collapse between 2000 and 2016 [Ma et al., 2019], which amounts to 64 cases. The published forensic studies are exploited. Forensic engineering is the investigation of materials, structures or components that fail or do not operate or function as intended, causing personal injury or damage to property [Noon, 2000]. The majority of forensic engineering publications come from Asia, more particularly from China, Japan and Taiwan. Most of wind turbine collapse took place in this region [Chou and Tu, 2009, Chou and Tu, 2011, Chen et al., 2015, Chen and Xu, 2016, Liu and Ishihara, 2015]. Two main types of failures have been identified in the literature. First, the breakage of the bolts causes the wind turbine to fall in several parts. This happened in Taiwan [Chou and Tu, 2011] as shown in Figure 1.10.
This type of failure may occur if the tower fastening system was not installed properly, possibly due to improper torqueing of the base or yaw system bolts. Second, the tower may collapse due to buckling at some point depending on the tower geometry, if the overturning design loads on the tower base are exceeded. For example, in January 2017, a 95-metre-high turbine collapsed near Leisnig,
Figure 1.10: Section of a collapsed wind turbine in Taiwan [Chou and Tu, 2011].
Germany (Figure 1.11).
Figure 1.11: Collapsed wind turbine in Germany [The-Civil-Engineer, 2017].
Concerning the identified causes, in 55% of the cases, the collapse occurred due to extreme weather conditions: typhoons and storms, especially in Asian countries. The wind velocity was greater than the turbine extreme endurance limit. In 6% of the cases, bolt fatigue or excessive ma-terial fatigue was recognized as the cause of tower collapse. When a bolt breaks, the local stresses experienced by the tower increase and the load experienced by the surrounding bolts increases. This phenomena causes the premature fatigue of the other bolts to occur and a buckling-coupled pull-out can occur. Another source of tower failure is the breakage of one or more rotor blades. Under the effect of inertial forces the blade can be thrown against the tower and induce irreversible damage that will lead to its fall. The loss of a blade induces a loss of balance of the forces experienced by the hub.
These disturbances can induce higher loadings and consequently premature collapse of the tower by one of the two causes identified in the literature. It has been identified for some wind turbines in a priori good condition a that buckling collapse occurred for loads below the ultimate level. Two causes were identified. First, geometrical imperfections in the tower, such as a small variation in diameter or thickness between two cylindrical parts, may have favoured buckling. Second, problems in the control system may also happen. When storms occur and the wind speed exceeds a certain threshold, around 25 m/s, the turbine stops and the blades move to the "flag" position. This position is intended to minimize the drag forces on the turbine. The yaw movement is left free so that the rotor can be aligned with the wind direction. The position of wind turbines at an emergency stop exhibited vital importance on structural failure. Due to the change of wind direction during typhoon impact, a stop position once structurally favourable may result in significant increases of wind loads to the turbine when the prevailing wind direction changes. Then the buckling load may be reached [Chou et al., 2018]. More locally in France, only two collapses of large wind turbine have been reported. The first took place at the end of December 2017, on a park in the city of Bouin. The picture of the collapsed wind turbine is shown Figure 1.12. It was a 62 m high wind turbine with a total weight of about 260 tons.
Figure 1.12: Collapsed wind turbine in Bouin, France [Parisien, 2018].
A series of technical incidents occurred during a storm, that resulted in poor blade and rotor positioning during high wind events. The wind turbine upper part was torn off 5 m from the ground at a weld section. We did not have access to the report concerning the fall of this wind turbine because it did not belong to EDF. This wind turbine was 15 years old. In view of the uprooting and age of the turbine, it is conceivable that a crack was present following the coalescence of defects due to fatigue at weld location. The sudden propagation of the crack would then have taken place under such violent loads. Slight local buckling is also seen on the images. It should be noted that, to the author’s knowledge, no case of crack propagation as a cause for collapse has been reported in the literature. The second fallen wind turbine in France belonged to a park near the town of Guigneville, the tower was 90 m high. The incident occurred in 2018 following a failure of the rotor brake. The rotor then
ran out of control, which caused the bolts between the first and second floors of the tower to break, as shown in Figure 1.13.
Figure 1.13: Collapsed wind turbine in Guigneville, France [France-3, 2018].
Summary
Studies of incidents resulting in turbine shutdowns show that most of the problems stem from the nacelle’s electro-mechanical conversion chain, not from the structure (either foundation or tower). However, the presence of a defect in the nacelle will in most cases not lead to turbine collapse, whereas in the tower the potential criticity of a defect is much higher. The study of fatal accidents that led to the fall of turbine towers has enabled several conclusions to be drawn. Three failure modes have been identified. First, bolt breakage at the flanges, which causes the upper part of the tower to tear off. Second, local buckling of the tower due to excessive flexural loading. The last mode of failure is related to crack propagation at a weld. Tower failures have mainly taken place in areas where extreme typhoon and storm conditions can occur. It is during very strong wind events that wind turbines collapse. In half of the cases identified and documented by post-mortem analysis, the climatic conditions were such that the loads on the towers were above the permissible limit. In the other half of the cases these particular meteorological parameters go hand in hand with a malfunction of a turbine part. The first recorded problem was premature fatigue of the bolts at the flanges. This problem can be fixed by inspecting the bolts for proper torque at regular and close intervals. The other types of failures involve the nacelle rotor assembly. This can be the loss of a blade that causes the tower to become unbalanced, a brake problem that causes the rotor to overspeed, or a control problem when the turbine is in the fail-safe position. The last identified issue is the appearance of cracks at welds due to premature fatigue. It can be envisaged that with the increasing competition between the different actors of wind energy, the resulting optimization of the structures, the appearance of rotors of greater power, that the occurrence of crack fatigue cases will increase with time. Even with more stressed structures, fatigue is not a problem under nominal operating conditions. However, the presence of defects coupled with turbine malfunctions or extreme conditions make structures vulnerable. It is therefore essential to develop methods to monitor structure health over time.
1.4
Wind turbine tower health estimation
The health control of large structures is a vast research field [Farrar and Worden, 2007]. The objective of the implemented techniques is to detect the appearance of a defect before it becomes critical to the structure from the point of view of its integrity. They can be divided into two groups. The ma-jor points of differentiation is whether or not the technique is automatic, autonomous and continuous. First, Non Destructive Testing (NDT) [Lakshmi et al., 2013] techniques gather methods which consist in checking at regular time intervals the structure as a whole to detect defects. The Structural Health Monitoring (SHM) Techniques [Farrar and Worden, 2007] consist in continuously gathering infor-mation about the studied structure from several sensors and automatically detecting health indicator shifts synonymous of damage appearance.
1.4.1
Non destructive testing
First, the simplest and cheapest technique to apply is the visual inspection of the structure. Generally, in the wind energy industry, such inspections are carried out annually from inside the tower by qual-ified technicians. The main goal is to detect corrosion within the structure, but the search for cracks is also part of the work. The main drawback of this technique is that it is not exhaustive, since only the interior of the tower is examined. The defects may be not visible under the paint or when they are located on the structure outer surface. To the author’s knowledge, there is no publication on the development of original NDT methods for turbine tower integrity qualification. Publications on the subject related to the wind energy industry focus on defect characterization for blades [Raišutis et al., 2008, Galappaththi et al., 2012, Lakshmi et al., 2013, Jasinien et al., 2009]. However, these methods are well used for tower inspection by wind farm operators. The industry mainly focuses on welds and bolts. An example of robot inspection is shown in Figure 1.14.
Figure 1.14: Control of a wind turbine tower thanks to ultrasound waves [Force-Technology, 2020].
In the case of bolts, following feedback from accidents that have occurred due to excessive bolt fatigue, recommendations have been made to check bolts regularly. If a bolt no longer meets the
torque resistance criterion, it is replaced. Checking welds relies on different techniques that mostly are magnetic particle testing, ultrasound and eddy currents. Magnetoscopy is based on the detec-tion of discontinuities, opening on the surface or down to a few millimetres deep [Tehranchi et al., 2011]. This method is only applicable on ferromagnetic materials and on uncoated surfaces. The principle of ultrasonic inspection consists in emitting and propagating an ultrasonic wave in the part to be inspected, then collecting and analysing the wave at the end of its interaction with the mate-rial [García-Martín et al., 2011, Beard and Lowe, 2003]. The receiver will record the echoes coming from the reflection or diffraction caused by obstacles encountered in the wave path. These obstacles can be defects, interfaces of different materials of a part or the surface of the part to be inspected. This method requires to be in contact with the part to be tested and to use a gel or water type coupler in order to allow the propagation of the ultrasonic waves. It is therefore necessary to have a clean and regular surface. To check the welds on wind turbine masts, it is compulsory to remove the paint. The ultrasonic technique has the advantage of being able to identify defects in the underlay (invisible to the naked eye) of the structure. The latest possible technology is eddy currents testing [García-Martín et al., 2011]. This method is based on the flow of currents induced in an electrically conductive material and allows, as in ultrasonic testing, for the detection of underlaying defects. Compared to ultrasonic testing, this technique has the advantage that no surface preparation of the tested material is required. However, the disadvantage of this technique is that it is not able to inspect sheets with a thickness of more than a few millimetres. The development of pulsed eddy current methods makes it possible to overcome this limitation, but this technology remains very expensive [Sophian et al., 2017]. It is possible to detect cracks in welds for few centimeters large specimen. However, the knowledge of the material properties and the defect signature are mandatory, hence it needs calibra-tion. These methods have the disadvantage that their use involves stopping the machine for a long period of time because it is forbidden to operate in or near a functioning turbine. Moreover, their cost can be prohibitive if one wishes to check an important part of the structure in an exhaustive way: these technologies are complex and require the preparation of the surfaces mentioned above, and es-pecially the full-time work of specialised technicians. Thus, the NDT strategy will rather be reserved for situations where there is a suspicion of damage, localized in space and time, in order to carry out a finer diagnosis and allow the alert to be disqualified or remedied. Then there is a need for the im-plementation of automated continuous structural monitoring, if possible with low cost technologies, allowing the centralization of wind farm control.
1.4.2
Structural Health Monitoring
Health monitoring of structures aims at giving, at each moment of the structure life, a diagnosis of the state of all its components [Farrar and Worden, 2007]. The goal may be to trace back to an equivalent damage, and for example to recalibrate the tools for predicting the fatigue life of the com-ponent [Rytter, 1993]. The field of SHM applied to wind turbine towers has given rise to numerous publications. Detailed reviews summarizing the proposed scientific methods are available [Wymore et al., 2015, Martinez-Luengo et al., 2016].
Most publications in the field have focused on damage detection by frequency tracking [Devriendt et al., 2014, Smarsly et al., 2013, Bassett et al., 2010]. A measured eigenfrequency variation of the structure corresponds to the occurrence of a defect. The interesting aspect of this technique is that the measurement of natural frequencies by accelerometers is fully mastered by the industry. However, these techniques have several disadvantages. First, considering that the sought damage is the initiation of cracks, the expected impact on the first eigenfrequencies, those usually measured, is minimal before this damage develops in a catastrophic way and requires measurements at very low noise levels, which is delicate in a context of random loadings [Bang et al., 2012]. In addition, variations in the inertial properties of the structure due to the environment can distort the measured eigenfrequency variations. One way to deal with these difficulties is to search for information in the non-linear vibration content, for example by wavelet analysis [Bassett et al., 2010]. These analyses also provide information on the spatial vibrations of the structure. However, these techniques are also subject to certain weaknesses, such as the appearance of interference terms in the time-frequency plane caused by noise. Most of the publications dealing with this method demonstrate its feasibility on numerical simulations of situations with major defects. Even with a high number of sensors, these methods do not enable to detect precisely the defect localization and categorize it. Few studies have focused on techniques that do not exploit vibrometric data. For example, one publication suggests placing strain gauges at regular intervals around hot spots of the structure (areas of largest strains) in order to detect localized strain gradients that would correspond to the presence of cracks [Benedetti et al., 2011]. The drawback of this technique is that a very high density of sensors is required to detect any crack occurrence. The radius of influence of a crack is very small, its impact on plane strains inversely decreases with the square root of the distance to the defect. In addition, strain gauges may suffer from measurement drifts over time. They can be corrected but with increased uncertainties [Loraux, 2018]. Other publications focus on the use of fibre-optic sensors, which also provide access to local strains but are also sensitive to temperature variations [Bang et al., 2012]. In conclusion, the common disadvantage of all these techniques is that they extrapolate a structure state of health as a whole from local information. Potentially fatal defects may go undetected. Moreover, neither the defect localization identification, nor its categorization, are possible with many of proposed methods, which is problematic for structures that can read up to 100 m in height.
1.5
Scientific issues
As wind farms age in the whole world, turbine integrity certification is becoming a major industrial issue to optimise asset management and guarantee the safety of the technicians working on site. In particular, farm life extension and repowering are being considered to amortize costs and make wind energy more competitive. The tower is a critical component since a fatal incident cannot occur under any circumstances. The calculation of the service life of wind turbine towers is based on damage cal-culation in the Miner sense using Wohler curves. The standards require that the service life exceeds the operating life, which is currently 20 years [IEC, 2005]. This form of calculation remains approx-imate and should require recalibration from site data for precise estimation. Yet, the current tower
designs are normally not to be questioned thanks to sufficient margins. At first glance, the life span of a wind turbine tower is not a problem. However, structural incidents have already been reported, especially bolt breakage, corrosion or cracks in welds. This last type of incident is principally due to premature fatigue induced by misalignment of welding joints, underestimated loads or stress concen-tration due to a faulty weld cooling process. Even if their number is very small in comparison to the number of installed turbines, towers have already collapsed around the world. Collapses almost never occur at nominal operating conditions, but always under particular wind conditions. It can be guessed that a crack presence will then make it much more susceptible to collapse. Both induced failure modes are premature buckling and fatal crack propagation. From post-mortem analyses both causes can be assumed: buckled areas as well as cracked parts are often present. Then, several questions arise: How is the wind turbine tower integrity affected by the presence of a crack-like defect ? What is the worst corresponding failure mode ?
Chapter 2 aims to answer that question. First, it will be studied how a crack-like defect affects the buckling resistance of a wind turbine tower. Second, the conditions needed for critical crack propaga-tion will be adressed. Both results will be confronted and a conclusion about the worst failure mode will be made. Simulations of rotor misalignment with respect to the wind direction will be conducted to illustrate severe loading under storm conditions. Then, the interest of monitoring the health of the wind turbine structures will be stressed.
Concerning structure monitoring, two types are available on the industrial market: non destructive testing and structural health monitoring techniques. The first ones are full-field but expensive, com-plex to use and not autonomous. The second ones are autonomous but are expensive and not full-field. The cost/benefit trade-off is an obstacle for widespread wind turbine tower monitoring. The motiva-tion behind that is that the occurence of incidents in turbines is concentrated in the rotor nacelle assembly. Therefore, as highlighted in Ref. [Wymore et al., 2015], the structure monitoring is nowa-days motivated by optical methods to detect damage because they are non-intrusive and low cost. The suggestion made in the review is about damage surface detection, like corrosion. These methods have been explored for turbine blades [Wang and Zhang, 2017], but nearly no research has been carried out for towers. Within the exposed framework, Digital Image Correlation [Sutton et al., 2009, Hild and Roux, 2012b] (DIC) is the technique chosen to develop new methods that would allow the lim-itations of previously cited ones to be overcome. DIC provides a full-field measurement in terms of displacement, the exploitation of which can allow for a more direct interpretation of the nature of any mechanical damage observed [Hild et al., 2015]. Thus the second question that will drive the thesis is: How can DIC be used to assess the turbine tower health ?
Two routes are followed: identification at the local scale with a material vision, and identification at the global scale of the structure.
For the first approach, a planar sample is considered whose dimension is much smaller than a wind turbine tower on which a defect of length l is present, the displacement field u under mechanical stress between two instants is
u = umeca + δu (1.1)
where umeca is the displacement field due to the mechanical stress, and δu corresponds to the
dis-turbance associated with the presence of the defect. At this scale, the problem is considered bi-dimensional due to the very small thickness of a cylindrical tower. In the following r corresponds to the distance from the defect. At the vicinity of a crack tip, when r l, the displacement influence is
δu ∝ r1/2 (1.2)
When the distance from the defect increases and the condition r l is met, one can approximate that
δu ∝ l2r−1 (1.3)
according to Eshelby’s perturbation theory [Eshelby, 1957]. Thus, the relative perturbation reaches a maximum when r ≈ l, which justifies to develop a damage detection method at this scale. In the following it will be called the "mesoscopic" approach. The second approach takes place in the mechanics of materials framework. The tower is modelled by a beam, so the studied environment is one-dimensional. At this scale, damage is homogenized over a complete section of a tower and represents a loss of lateral moment of inertia [Marante and Flórez-López, 2003, Marante et al., 2012]. When damage is concentrated at one point, it implies a discontinuity in the rotation field, such as a hinge. The influence on the displacement field is comparable to a lever arm, which implies that the perturbation will be proportional to the distance from the defect
δu ∝ r (1.4)
This explains why, for this approach, the distant and global vision is important because of the proportionality in r. In the following it will be referred as the "macroscopic" approach.
Chapter 3 will present the DIC principle and develop the scientific concepts related to this field that are used in this work. More particularly, instantaneous and spatio-temporal DIC will be presented. A work about the optimal DIC framework with N channels will also be adressed, with the underlying objective to lower measurement uncertainty.
Chapter 4 is devoted to the mesoscopic approach. First, the aspects related to the industrially deployable device will be exposed. Then, the automatic damage detection algorithm using DIC de-velopped during this thesis will be discussed.
Chapter 5 deals with the theory for damage detection at the macroscopic scale. An innovative method of wind turbine tower modal analysis by DIC will also be exposed.
Chapter 2
Simulation of a wind turbine tower failure
Summary
In this chapter, finite element calculations are carried out to determine the wind turbine tower worst failure mode with a presence of a crack. The chosen tower type is based on an academical model. First, the theory about buckling and the calculations performed are exposed. Second, theory and calculations about a critical crack propagation are adressed. Then, a comparison between both failure modes is made. Eventually, simulations of rotor misalignment with respect to the wind direction are conducted to illustrate severe loading under storm conditions.
2.1
Introduction
Field studies have revealed that cracks could be present along the welds at material interfaces. They may originate from high residual stresses induced by the welding process, or over-stressing due to non-optimized weld joint design [Chen and Xu, 2016,Lacalle et al., 2011]. Post-mortem observations of collapsed wind turbine towers revealed two characteristic failure modes: flexural buckling of the tower and crack propagation on the tower tensile side (Section 1.3.5). It is difficult to establish, when the tower is initially cracked, which is the primary cause of the turbine fall. On the one hand, a crack can influence buckling in two ways, namely, local weakening caused by the crack lowers the critical load, and if the crack propagates under heavy loads, the buckling resistance can drop and cause the tower to fall prematurely. On the other hand, buckling of the tower may induce local overstressing and cause the propagation of an initially present crack. In this chapter, the objective is to determine which is the most critical mode of failure for a wind turbine tower in the presence of cracks: buckling or fatal propagation? The influence of the crack, whether on the tensile or compressive side, is studied. The results are compared with those available in the literature concerning their relative influence. The second part of this chapter deals with fatal crack propagation within a wind turbine tower. The theoretical aspects related to fracture mechanics are first presented, then computations are made to determine the critical corresponding loads. Results from both studies lead to determine which is the worst failure mode for a damaged tower. In the third part, a loading case in which strong winds are coupled with a rotor axis misalignement with respect to the wind direction is simulated to illustrate a critical loading condition. For the numerical models, the numerical framework is the EDF R&D Finite Element Model(FEM) open-source code: code_Aster [EDF, 2017a].
2.2
Buckling of a wind turbine tower
2.2.1
Litterature review on buckling
In mechanics, buckling is a geometric instability of a structure under a given load [Timoshenko, 1910,Rhode and Lundquist, 1931,Brazier, 1927]. It generally occurs on thin or slender structures and results in strong deformations of the structure due to a very small increase in load. At the onset of buckling the load is termed critical. The structure loses its stiffness at this point. In the structural design field it is essential to avoid bifurcation towards an unstable post-critical branch, which is synonymous with the failure of the structure. Buckling may occur in the elastic domain but may also be coupled with plastic phenomena [Gerard and Becker, 1957,Hutchinson, 1974,Bushnell, 1974, Johnson and Will, 1974], the appearance of plastic deformations inducing a local loss of resistance to buckling. The typical geometry of a wind turbine tower is similar to that of a thin cylindrical shell. Generally, when cylindrical shells are subjected to a bending moment, several effects lead to the collapse of the tube: ovalization, local buckling, and plastification [Brazier, 1927, Gerard and Becker, 1957].
Buckling of a cylinder in presence of defect
In real life, built structures are never perfect. Manufacturing defects do exist and the quantification of their influence has proven to be essential in order to ensure the integrity of structures with respect to instabilities. First, analytical solutions were proposed in order to evaluate the influence of defects corresponding to geometrical discontinuities [Hutchinson et al., 1971] in shells. The obtained results hold in the limit of very long and thin cylinders. Many experimental approaches were carried out to validate either the analytical approaches or the simulations when the deviations from the conditions of applicability of analytic solutions were encountered. The work performed in [Miladi and Razzaghi, 2014] focused on the study of axial compression of cylindrical shells with circular holes using finite element calculations. More specifically, the analysis was about the influence of the cylinder aspect ratios α = L/R and β = R/t. Here L designates the length of the cylinder, R the radius and t its thickness. The tested ranges of values were 1.5 < α < 6 and 125 < β < 1000. The main conclusion of the study was that the factor that most influenced the critical load drop was β. The higher this aspect ratio, the greater the influence of a defect. For the largest defects the influence ranges from less than 10% for the thickest tubes to 35% for the thinnest tubes. The influence of α is much smaller. In Ref. [Yeh et al., 1999] the flexural buckling of thicker tubes (β = 25) in the presence of rectangular or circular holes was studied experimentally and by simulations. Three main conclusions were drawn from this work. First, a plastic bending on the face in compression was observed. Second, the defects had more influence on the critical load when they were on the compressive side than on the tensile side. Third, the differences between the buckling loads obtained by experiments and simulations were small, less than 5%. The influence of cracks on the critical load in compression has been studied in Ref. [Saemi et al., 2015], both experimentally and numerically. The studied shells had aspect ratio β ranging from 10 to 12. The ratio of crack size over cylinder diameter lied between 0.2 and 0.4. The influence on the critical load for circumferential cracks was of the order of 8% regardless of crack length, whereas longitudinal cracks could lower the critical load by up to 15%. These cracks were more likely to open during the compressive phase. Several techniques have been used to model buckling of damaged cylinders. In Ref. [Akrami and Erfani, 2017], it is assimilated by a particular rotational spring between the two cylinders to facilitate the calculation. The use of extended finite elements has been proposed [Nasirmanesh and Mohammadi, 2017] but the use of such elements is not possible in all finite element solvers. Last, more classical techniques are used [Saemi et al., 2015, Vaziri and Estekanchi, 2006], given that the interpenetration of the crack lips must be avoided, and contact is taken into account.
Wind turbine towers generally present thickness aspect ratio β around 100 and their diameter is about 4 m. Thus, for cracks about 10 to 50 cm, the influence on the buckling load is expected to be small, i.e. less than 10%. This assumption has to be validated by simulation. Another interesting element is to be underlined. It has been observed that the defect presence on the compressive side is more critical than on the tensile side. For cracks in compression, the simplest modelling is to use a non-penetration condition between the crack lips.
Wind turbine towers buckling
A few works have been published on the study of the wind turbine tower collapse and its modelling. Most of them were motivated by tower failures due to high winds [Chen and Xu, 2016] which sought to corroborate post-mortem observations with static finite element simulations. The studied wind turbine was 47 m high. From elastic buckling mode calculation, it was deduced that plasticity must be taken into account in the finite element simulation. Otherwise the critical loadings would be unrealistic. A stress concentration factor was used to model the bolted or welded connections of the different parts of the tower. The point where buckling occured matched with the maximum stressed area where the material yielded. In Ref. [Dai et al., 2017], a dynamic simulation was performed. The temporal loads at the hub were obtained by aeroelastic simulation. The tower under study was 65 m high and actually collapsed during high wind events. Once again, the calculation was elasto-plastic due to the fact that the theoretical elastic buckling values led to stresses four times higher than the yield strength. Plastic hinging was observed at the site of maximum stress and this was consistent with post-mortem observations. The authors indicated that total collapse occured less than three seconds after the onset of the plastic zone, in real simulation time, which was particularly fast. Furthermore, it was indicated that visco-plastic effects were not to be taken into account due to the material properties and deformation rates calculated after simulation. This work also showed that the loading on the wind turbine has become unsustainable due to sudden changes in wind direction. The forces related to the acceleration of the nacelle led to the collapse of the turbine. Finally in Ref. [Guo et al., 2011], a pushover finite element analysis of a 53 m high wind turbine tower was performed. The tower was progressively loaded with a transverse force until it buckled. The calculation was conducted in statics, and it was carried out post-buckling thanks to a piloting technique. In this work the influence of a very small geometrical defect on the critical load of the tower was investigated. The defect was a 25 kN preload applied to the nodes over a length representing 0.5% of the tower diameter. It was shown that the influence of the defect is of the order of a few percents on the critical load. Another work has focused on the sensitivity of the critical load to the position and shape of the inclusion of the wind turbine entrance door at the bottom of the turbine [Dimopoulos and Gantes, 2012]. It was shown that the use of stiffeners in the lower part of the tower can counteract this loss of resistance to buckling.
Summary
The buckling of cylindrical shells is a phenomenon that has been studied for a long time and is par-ticularly well understood. In the case of thick shells, buckling by compression or bending involves plasticity, thus modelling this phenomenon is complicated due to the combination of non-linear phe-nomena and instabilities. However, the piloting methods developed in finite element solvers make it possible to overcome these problems and to perform these computations successfully. The impact of the presence of defects on the critical buckling load is a problem that has also been studied in the scientific literature. Experimentally and numerically it has been shown that the aspect ratio of the cylinder thickness to its radius is a prevalent for the defect sensitivity. The following conclusion has been often drawn: the greater this ratio, the greater the loss of resistance to buckling. Wind turbines
are cylinders whose diameters and thicknesses vary with height. However their aspect ratio remains similar and they can be considered as thick shells. Thus the expected critical load drop is of the or-der of a few percent for circumferential cracks of few tens of centimetres. These wind turbines are stressed in flexure and these orders of magnitude are valid if the crack is located on the compressive side. When the crack is situated in the tensile side, its influence is almost negligible. To model buck-ling with a crack on the compressive side, the contact between the crack lips must be considered in order to avoid interpenetration.
2.2.2
Buckling simulation with an academic turbine model
Some results presented in this section have been published [Capaldo et al., 2020].
Case presentation
To illustrate buckling of a wind turbine tower in the presence of defects an academic tower model is chosen, and called NREL (inspired from National Renewable Energy Laboratory) in the following. The geometrical parameters of the tower are presented in Table 2.1. The geometry of this tower has mainly been used for offshore wind turbine applications [Jonkman, 2010], and particularly for the comparison and validation of hydrodynamic codes [Jonkman and Musial, 2010, Popko et al., 2012, Robertson et al., 2017]. For the NREL tower, assuming a geometry with no thickness or diameter jump, the scaled parameters range, from 29 to 45 for β, and from 102 to 111 for α. Other wind turbines are generally thinner than the NREL prototype, but the orders of magnitude for the geometric aspect ratios are close. The tower is considered to be a truncated cone. The thickness varies linearly
Table 2.1: NREL wind turbine parameters. [Jonkman, 2010]
Size of tower 87.6 m
Diameter: from base to top (linear variation) 6-3.87 m Thickness: from base to top (linear variation) 27-19 mm
Young’s modulus 210 GPa
Poisson’s modulus 0.3
Yield stress 355 MPa
Hardening tangent modulus 8.4 GPa
Density 8000 kg/m
Nacelle mass 297 tons
Nacelle COG coordinates from tower axis -0.579, 0.0, 87.6 m
from the base to the top. The welds and flanges are not taken into account for the sake of simplicity. This is a limit of the model because the discontinuities can induce premature buckling, and then the critical load may be overestimated. However it has been shown in bibliographical review 2.2.1 that for such type of cylinder a defect or discontinuity has very small influence. The Rotor Nacelle Assembly (RNA) is simply modeled as a point mass. The material is a J0355 steel [Seitl et al., 2019] and concerning the plasticity behavior a simple linear isotropic hardening model with elastic threshold is chosen. The thrust force of the RNA is modeled by a transverse force applied to the top of the
![Figure 1.10: Section of a collapsed wind turbine in Taiwan [Chou and Tu, 2011].](https://thumb-eu.123doks.com/thumbv2/123doknet/14543859.725210/25.892.252.639.125.420/figure-section-collapsed-wind-turbine-taiwan-chou-tu.webp)
![Figure 1.14: Control of a wind turbine tower thanks to ultrasound waves [Force-Technology, 2020].](https://thumb-eu.123doks.com/thumbv2/123doknet/14543859.725210/28.892.245.643.760.1025/figure-control-turbine-tower-thanks-ultrasound-force-technology.webp)
![Figure 2.4: Example of wind turbine tower failing by buckling. [Jay et al., 2016]](https://thumb-eu.123doks.com/thumbv2/123doknet/14543859.725210/43.892.259.632.135.398/figure-example-wind-turbine-tower-failing-buckling-jay.webp)