RESEARCH OUTPUTS / RÉSULTATS DE RECHERCHE
Author(s) - Auteur(s) :
Publication date - Date de publication :
Permanent link - Permalien :
Rights / License - Licence de droit d’auteur :
Bibliothèque Universitaire Moretus Plantin
Institutional Repository - Research Portal
Dépôt Institutionnel - Portail de la Recherche
researchportal.unamur.be
University of Namur
Influence of C-reactive protein on thrombin generation assay
Didembourg, Marie; Douxfils, Jonathan; Mullier, François; Hardy, Michael; Favresse, Julien;
Morimont, Laure
Published in:
Clinical Chemistry and Laboratory Medicine
DOI:
10.1515/cclm-2020-1686
Publication date:
2021
Document Version
Peer reviewed version
Link to publication
Citation for pulished version (HARVARD):
Didembourg, M, Douxfils, J, Mullier, F, Hardy, M, Favresse, J & Morimont, L 2021, 'Influence of C-reactive
protein on thrombin generation assay', Clinical Chemistry and Laboratory Medicine.
https://doi.org/10.1515/cclm-2020-1686
General rights
Copyright and moral rights for the publications made accessible in the public portal are retained by the authors and/or other copyright owners and it is a condition of accessing publications that users recognise and abide by the legal requirements associated with these rights. • Users may download and print one copy of any publication from the public portal for the purpose of private study or research. • You may not further distribute the material or use it for any profit-making activity or commercial gain
• You may freely distribute the URL identifying the publication in the public portal ? Take down policy
If you believe that this document breaches copyright please contact us providing details, and we will remove access to the work immediately and investigate your claim.
Clinical Chemistry and Laboratory Medicine Letter to the Editors
Influence of C-reactive protein on thrombin generation assay
Marie Didembourg1, Jonathan Douxfils1.2,François Mullier3, Michael Hardy4, Julien Favresse1.5, Laure Morimont1.2
1 University of Namur, Faculty of Medicine, Department of Pharmacy, Namur Research Institute for Life Sciences
(NARILIS), Namur Thrombosis and Hemostasis Center (NTHC), Namur, Belgium,
2 Qualiblood sa, Namur, Belgium
3 Université catholique de Louvain, CHU UCL Namur, Laboratory Hematology, Namur Research Institute for Life
Sciences (NARILIS), Namur Thrombosis and Hemostasis Center (NTHC), Yvoir, Belgium
4 Université catholique de Louvain, CHU UCL Namur, Department of Anesthesiology, Namur Research Institute for
Life Sciences (NARILIS), Namur Thrombosis and Hemostasis Center (NTHC), Yvoir, Belgium
5 Clinique Saint-Luc Bouge A.S.B.L. “Santé & Prévoyance”
Corresponding author:
Laure Morimont
1University of Namur, Faculty of Medicine, Department of Pharmacy, Namur Research Institute for Life Sciences
(NARILIS), Namur Thrombosis and Hemostasis Center (NTHC), Namur, Belgium
2Qualiblood sa, Namur, Belgium;
Rue du Séminaire 20a, 5000 Namur, Belgium
Mail: Laure.morimont@qualiblood.eu
Phone: +32 81 444 992
Word count for the letter: 1197 words
Number of figures and tables: 2
To the editors,
A close association between inflammatory state, C-reactive protein (CRP) and thromboembolic events has been
described at least a decade ago [1] but has resurfaced recently with the outbreak of the severe acute respiratory
syndrome coronavirus 2 (SARS-CoV-2).[2] CRP is an acute phase reactant plasma protein considered as a systemic
biomarker representative of the total burden of inflammation but also linked to the development of
pro-thrombotic states.[1, 2] Through direct interaction with Fc𝛾 receptors (Fc𝛾Rs) on smooth muscles cells or
vascular endothelial cells, CRP promotes discharge of tissue factor (TF), production of pro-inflammatory cytokines and release of plasminogen activator inhibitor.[2] The CRP-Fc𝛾R interaction also inhibits the liberation of tissue-plasminogen activator, modifying the fibrinolytic balance and reducing intravascular fibrin clearance.[1]
Under normal circumstances, plasma CRP concentrations stand between 0,2 and 8,0mg/L, but patients being
affected by diseases or conditions characterized by a strong inflammation express CRP levels up to 1000 times
higher.[3] Persistent elevated CRP levels, observed in moderate to severe COVID-19 patients, in sepsis or in other
chronic inflammatory diseases (e.g. inflammatory bowels disease) [4, 5], are reflected by higher risk of
cardiovascular complications, especially venous thromboembolism and pulmonary thrombosis.[6] The
assessment of the pro-thrombotic state of these patients with global coagulation tests like thrombin generation
assays (TGA) may be relevant to assess the evolution of the disease or identify its severity, although their clinical
utility remained to be confirmed. Nevertheless, CRP impacts coagulation assays, especially the activated partial
thromboplastin time (aPTT) which has been reported to be dose-dependently prolonged in presence of CRP
concentrations encountered in inflammatory states.[7, 8] It has also been demonstrated that phospholipids act
as catalytic surfaces and, depending on their component, form complex with CRP leading to potential disturbance
of TGA on the Calibrated Automated Thrombogram (CAT).[7] This study aims to assess how CRP impacts TGA on
the ST-Genesia system. A comparison with the CAT system was performed, using the same triggering reagent, as
differences between both platforms have been reported.[9]
The study protocol was in accordance with the Declaration of Helsinki. Recruitment of healthy volunteers for the
constitution of a normal pooled plasma (NPP) has been approved by the Ethical Committee of the CHU-UCL
Namur, Yvoir, Belgium (approval number: B03920096633). Trisodium citrate tubes (3.2% i.e., 0.109M) were used
for blood collection. Platelet-poor-plasma was obtained from the supernatant fraction after a double centrifugation for 15 minutes at 2500g . NPP was constituted of 50 healthy individuals (median age= 20 years,
from 18 to 56 years; mean BMI= 23 kg.m-2) not carrier of a factor V Leiden or G20210A mutation.Human
C-reactive protein (Merk KGaA, Darmstadt,Germany) was spiked in NPP at five plasma concentrations (0
[phosphate buffer saline], 50, 100, 200, and 350mg/L). These concentrations were confirmed by an
immunoturbidimetric assay on the Cobas® 8000 (Roche Diagnostics, Meylan, France). The selected
concentrations correlated with CRP levels observed in patients suffering from inflammatory diseases such as
COVID-19 or rheumatoid arthritis.[3, 6] Thrombin generation (TG) was first assessed on the new automated
system, the ST-Genesia (Diagnostica Stago, Asnières-sur-Seine, France). Secondly, TG was assessed on the CAT
using the Thrombinoscope software version 5,0 (Thrombinoscope bv, Maastricht, the Netherlands). The
triggering reagent on both platforms was the STG-ThromboScreen-TM (Diagnostica Stago) which contains
phospholipids and TF (exact concentrations not provided by the manufacturer). Both TGA methods were
performed in duplicate and assessed by 3 independent runs on each platform. The aPTT was measured at the
highest CRP concentration (350 mg/L) and compared to the NPP buffer concentration (0 mg/L) in order to confirm
that our model was able to replicate previous observations and to validate our experiments.[7] The aPTT was
performed on a STA R Max system (Diagnostica Stago) using Dade®Actin®FS (Siemens Healthcare, Munich,
Germany) as activator reagent, which has been previously proven to be sensitive to the presence of CRP.[7] All
data and statistical analysis were processed and performed using GraphPad Prism 8,0 for macOS (GraphPad
Software, San Diego, California USA, www.graphpad.com). Mean velocity rate index (mVRI) was calculated for
TGA performed on the ST-Genesia system as the algorithm does not determined it automatically. The ratio for
the lag time (LT), time-to-peak (Ttpeak), endogenous thrombin potential (ETP), peak height (PH), and mVRI were
calculated relative to the NPP buffer concentration (i.e. 0 mg/L). Descriptive statistics were used to describe the
data. An ordinary one-way ANOVA was performed to assess the differences on TGA parameters of the 5 CRP
concentrations tested. In case of significance, a Tukey’s multiple comparison test was performed. Difference
between both analyzers was assessed using a paired t-test with individual variance computed for each
comparison followed by a Holm-Sidak’s multiple comparison test. The threshold for significance was set at 0,05.
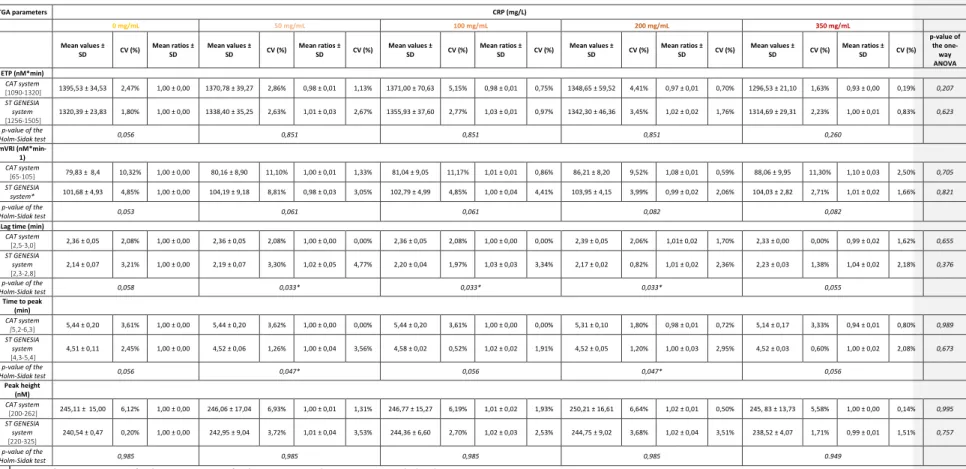
Mean values and mean ratios ± standard deviation (SD) and coefficient of variation (CV%) were calculated for each TGA parameter at each plasma CRP concentrations. Results are reported in Table 1. Based on mean values,
no statistically significant difference was observed between the five tested concentrations (ANOVA p-value>0,05), regardless of the platform used. However, on the CAT system, a decrease of 7% of the ETP and an
Code de champ modifié
increase of 10% of the mVRI were observed at the highest CRP concentration (350mg/L) compared to NPP buffer
concentration.
Comparison between both platforms, represented in Figure 1, showed significant difference for LT and Ttpeak (Holm-Sidak p-value<0,05). LT was significantly higher at CRP levels of 50, 100 and 150 mg/L as well as Ttpeak at
CRP levels of 50 and 150 mg/L when TGA was assessed on the CAT compared to the ST-Genesia System.
Significant differences observed between LT and Ttpeak are possibly associated with the specific algorithmsignal
acquisition sequence specific ofto each platform. The ETP was not significantly different between both
equipment (p-value>0,05).
mg/L of CRP. This corresponds to a prolongation of 4,2s and a ratio of 1,15 when compared to the baseline. This A
similar increase was previously also observed by Devreese et al. [7].
As expected, the aPTT performed in our study was prolonged by 1,15 at CRP concentration of 350 mg/L. This correlates with results previously obtained in the study of Devreese et al.
Different hypotheses may explain the absence of the impact of CRP on TGA. Firstly, it has been shown that the
impact on aPTT was reagent-dependent, suggesting that the composition of the phospholipids content of the
reagents influences the impact of CRP on aPTT clotting times.[7] It is therefore possible that the phospholipids
content of the STG-ThromboScreen is not or weakly sensitive to the presence of CRP. Secondly, aPTT and TGA
induce coagulation through different pathways. Indeed, aPTT induces coagulation through the intrinsic pathway
whereas in TGA, the TF contained in the reagent activates the extrinsic pathway. A third hypothesis which
completes the second one is the way TG is dependent to phospholipids. Namely, it has been shown that TG
reaches a plateau at phospholipids concentrations above ± 3µM meaning that if the residual non-complexed
phospholipids is above this threshold, the impact on TG would be negligible.[10] However, as no formal
information is provided by the manufacturer regarding the final phospholipids concentration in the
STG-ThromboScreen reagent, this is only an assumption.
Thus, the TheThe weak affinity of CRP for the phospholipids molecules contained in the STG-ThromboScreen,
the difference in the triggering coagulation pathway and the weaker dependence for phospholipids of the
TF-induced TG are hypotheses that may explain the robustness of TG towards CRP. In conclusion, this study
demonstrated that CRP levels up to 350mg/L did not impact significantly TG performed either on a CAT or on a
Code de champ modifié
ST-Genesia system. Thrombin generation assay is therefore an efficient test to assess the hemostatic function of
Conflict of Iinterest
Among the authors. J. Douxfils is CEO and founder of QUALIblood s.a.. a contract research organization
manufacturing the DP-Filter. is co-inventor of the DP-Filter (patent application number: PCT/ET2019/052903)
and reports personal fees from Daiichi-Sankyo. Mithra Pharmaceuticals. Stago. Roche and Roche Diagnostics
outside the submitted work. F. Mullier reports institutional fees from Stago, Werfen, Nodia, Roche Sysmex and Bayer. He also reports speaker fees from Boehringer Ingelheim, Bayer Healthcare, Bristol-MyersSquibb-Pfizer, Stago, Sysmex and Aspen all outside the submitted work. The other authors have no conflicts of interest to disclose.
References
1. Fay WP. Linking inflammation and thrombosis: Role of C-reactive protein. World J Cardiol 2010;2:365-9.
2. Connors JM, Levy JH. Thromboinflammation and the hypercoagulability of COVID-19. J Thromb Haemost 2020;18:1559-1561.
3. Otterness IG. The value of C-reactive protein measurement in rheumatoid arthritis. Semin Arthritis Rheum 1994;24:91-104.
4. Tsalik EL, Jaggers LB, Glickman SW, Langley RJ, van Velkinburgh JC, Park LP, et al. Discriminative value of inflammatory biomarkers for suspected sepsis. J Emerg Med 2012;43:97-106.
5. Fumery M, Xiaocang C, Dauchet L, Gower-Rousseau C, Peyrin-Biroulet L, Colombel JF.
Thromboembolic events and cardiovascular mortality in inflammatory bowel diseases: a meta-analysis of observational studies. J Crohns Colitis 2014;8:469-79.
6. Al-Samkari H, Karp Leaf R, Dzik W, Carlson J, A F. COVID-19 and coagulation: bleeding and thrombotic manifestations of SARS-CoV-2 infection. Blood 2020;136:489-500.
7. Devreese KM, Verfaillie CJ, De Bisschop F, Delanghe JR. Interference of C-reactive protein with clotting times. Clin Chem Lab Med 2015;53:141-5.
8. Gooding R, Myers B, Salta S. Lupus Anticoagulant in Patients with Covid-19. N Engl J Med 2020;383:1893.
9. Talon L, Sinegre T, Lecompte T, Pereira B, Massoulie S, Abergel A, et al. Hypercoagulability (thrombin generation) in patients with cirrhosis is detected with ST-Genesia. J Thromb Haemost 2020;18:2177-2190.
10. Hemker HC, Giesen P, Al Dieri R, Regnault V, de Smedt E, Wagenvoord R, et al. Calibrated automated thrombin generation measurement in clotting plasma. Pathophysiol Haemost Thromb 2003;33:4-15.
Figure 1: Mean values of each TGA parameter; (A) ETP, (B) mVRI, (C) Lag time, (D) Time-to-peak and (E) Peak height; at each CRP concentration (0 – 50 – 100 – 200 – 350 mg/L) for both equipments. Data from CAT system are shown in blue. Data from ST Genesia
system are shown in orange.
0 50 100 150 200 250 300 350 1250 1300 1350 1400 1450 CRP (mg/L) E T P ( n M *m in ) (A) 0 50 100 150 200 250 300 350 60 70 80 90 100 110 120 CRP (mg/L) m V R I (n M /m in ) (B) 0 50 100 150 200 250 300 350 2.0 2.1 2.2 2.3 2.4 2.5 CRP (mg/L) L a g t im e ( m in ) (C) 0 50 100 150 200 250 300 350 4.0 4.5 5.0 5.5 6.0 CRP (mg/L) T im e t o p e a k ( m in ) (D) 0 50 100 150 200 250 300 350 220 230 240 250 260 270 CRP (mg/L) P e a k h e ig h t (n M ) (E)
Table 1: Mean values ± SD , mean ratios ± SD and calculated CV (%) of TGA parameters reported for each plasma CRP concentration on the CAT and the ST GENESIA system. Reference intervals described for each TGA parameter on both equipments are extracted from the article of Talon et al.[9] P-value of the one-way ANOVA expresses difference between CRP concentrations for each analyzer. P-value of the Holm-Sidak’s
multiple comparison test shows the difference between equipment for each CRP concentration and each parameter.
TGA parameters CRP (mg/L) 0 mg/mL 50 mg/mL 100 mg/mL 200 mg/mL 350 mg/mL Mean values ± SD CV (%) Mean ratios ± SD Mean values ± SD CV (%) Mean ratios ± SD CV (%) Mean values ± SD CV (%) Mean ratios ± SD CV (%) Mean values ± SD CV (%) Mean ratios ± SD CV (%) Mean values ± SD CV (%) Mean ratios ± SD CV (%) p-value of the one-way ANOVA ETP (nM*min) CAT system [1090-1320] 1395,53 ± 34,53 2,47% 1,00 ± 0,00 1370,78 ± 39,27 2,86% 0,98 ± 0,01 1,13% 1371,00 ± 70,63 5,15% 0,98 ± 0,01 0,75% 1348,65 ± 59,52 4,41% 0,97 ± 0,01 0,70% 1296,53 ± 21,10 1,63% 0,93 ± 0,00 0,19% 0,207 ST GENESIA system [1256-1505] 1320,39 ± 23,83 1,80% 1,00 ± 0,00 1338,40 ± 35,25 2,63% 1,01 ± 0,03 2,67% 1355,93 ± 37,60 2,77% 1,03 ± 0,01 0,97% 1342,30 ± 46,36 3,45% 1,02 ± 0,02 1,76% 1314,69 ± 29,31 2,23% 1,00 ± 0,01 0,83% 0,623 p-value of the Holm-Sidak test 0,056 0,851 0,851 0,851 0,260 mVRI (nM*min-1) CAT system [65-105] 79,83 ± 8,4 10,32% 1,00 ± 0,00 80,16 ± 8,90 11,10% 1,00 ± 0,01 1,33% 81,04 ± 9,05 11,17% 1,01 ± 0,01 0,86% 86,21 ± 8,20 9,52% 1,08 ± 0,01 0,59% 88,06 ± 9,95 11,30% 1,10 ± 0,03 2,50% 0,705 ST GENESIA system* 101,68 ± 4,93 4,85% 1,00 ± 0,00 104,19 ± 9,18 8,81% 0,98 ± 0,03 3,05% 102,79 ± 4,99 4,85% 1,00 ± 0,04 4,41% 103,95 ± 4,15 3,99% 0,99 ± 0,02 2,06% 104,03 ± 2,82 2,71% 1,01 ± 0,02 1,66% 0,821 p-value of the Holm-Sidak test 0,053 0,061 0,061 0,082 0,082
Lag time (min)
CAT system [2,5-3,0] 2,36 ± 0,05 2,08% 1,00 ± 0,00 2,36 ± 0,05 2,08% 1,00 ± 0,00 0,00% 2,36 ± 0,05 2,08% 1,00 ± 0,00 0,00% 2,39 ± 0,05 2,06% 1,01± 0,02 1,70% 2,33 ± 0,00 0,00% 0,99 ± 0,02 1,62% 0,655 ST GENESIA system [2,3-2,8] 2,14 ± 0,07 3,21% 1,00 ± 0,00 2,19 ± 0,07 3,30% 1,02 ± 0,05 4,77% 2,20 ± 0,04 1,97% 1,03 ± 0,03 3,34% 2,17 ± 0,02 0,82% 1,01 ± 0,02 2,36% 2,23 ± 0,03 1,38% 1,04 ± 0,02 2,18% 0,376 p-value of the Holm-Sidak test 0,058 0,033* 0,033* 0,033* 0,055 Time to peak (min) CAT system [5,2-6,3] 5,44 ± 0,20 3,61% 1,00 ± 0,00 5,44 ± 0,20 3,62% 1,00 ± 0,00 0,00% 5,44 ± 0,20 3,61% 1,00 ± 0,00 0,00% 5,31 ± 0,10 1,80% 0,98 ± 0,01 0,72% 5,14 ± 0,17 3,33% 0,94 ± 0,01 0,80% 0,989 ST GENESIA system [4,3-5,4] 4,51 ± 0,11 2,45% 1,00 ± 0,00 4,52 ± 0,06 1,26% 1,00 ± 0,04 3,56% 4,58 ± 0,02 0,52% 1,02 ± 0,02 1,91% 4,52 ± 0,05 1,20% 1,00 ± 0,03 2,95% 4,52 ± 0,03 0,60% 1,00 ± 0,02 2,08% 0,673 p-value of the Holm-Sidak test 0,056 0,047* 0,056 0,047* 0,056 Peak height (nM) CAT system [200-262] 245,11 ± 15,00 6,12% 1,00 ± 0,00 246,06 ± 17,04 6,93% 1,00 ± 0,01 1,31% 246,77 ± 15,27 6,19% 1,01 ± 0,02 1,93% 250,21 ± 16,61 6,64% 1,02 ± 0,01 0,50% 245, 83 ± 13,73 5,58% 1,00 ± 0,00 0,14% 0,995 ST GENESIA system [220-325] 240,54 ± 0,47 0,20% 1,00 ± 0,00 242,95 ± 9,04 3,72% 1,01 ± 0,04 3,53% 244,36 ± 6,60 2,70% 1,02 ± 0,03 2,53% 244,75 ± 9,02 3,68% 1,02 ± 0,04 3,51% 238,52 ± 4,07 1,71% 0,99 ± 0,01 1,51% 0,757 p-value of the Holm-Sidak test 0,985 0,985 0,985 0,985 0.949