HAL Id: hal-02266146
https://hal.archives-ouvertes.fr/hal-02266146
Submitted on 13 Aug 2019HAL is a multi-disciplinary open access archive for the deposit and dissemination of sci-entific research documents, whether they are pub-lished or not. The documents may come from teaching and research institutions in France or abroad, or from public or private research centers.
L’archive ouverte pluridisciplinaire HAL, est destinée au dépôt et à la diffusion de documents scientifiques de niveau recherche, publiés ou non, émanant des établissements d’enseignement et de recherche français ou étrangers, des laboratoires publics ou privés.
Vibrational modes of aminothiophenol : a TERS and
DFT study
Alexandre Merlen, M. Chaigneau, Stéphane Coussan
To cite this version:
Alexandre Merlen, M. Chaigneau, Stéphane Coussan. Vibrational modes of aminothiophenol : a TERS and DFT study. Physical Chemistry Chemical Physics, Royal Society of Chemistry, 2015, 17 (29), pp.19134-19138. �10.1039/c5cp01579k�. �hal-02266146�
1
Vibrational modes of aminothiophenol : a TERS and DFT study
A. Merlen1*, M. Chaigneau2, S. Coussan3
1 IM2NP, UMR-CNRS 7334, Site de l’Université de Toulon, 83957 La Garde Cedex, France. 2 LPICM, UMR-CNRS 7647, Ecole Polytechnique, Palaiseau, France.
3 Laboratoire Physique des Interactions Ioniques et Moléculaires, UMR 7345-CNRS, Aix-Marseille Université, Centre St-Jérôme, 13397 Marseille Cedex 20, France. * Corresponding author: [email protected]
Submitted to PCCP
Abstract: We report Tip Enhanced Raman Spectroscopy (TERS) mapping and Density Functional (DFT) calculations of aminothiophenol (ATP) grafted on a gold surface. The TERS mapping has
demonstrated Raman modes of (ATP) and its dimerised derivative Dimercaptoazobenzene (DMAB). This feature confirms that the plasmon activated chemical reaction of ATP has occurred during TERS measurements. In some specific part of the samples some unidentified Raman modes are observed. We suggest that they could come from intermediate species formed during the conversion of ATP into DMAB. These modes are compared with calculated Raman spectra of some possible
intermediate species. These results confirm the high potentiality of TERS measurements for nanochemistry.
Introduction
Metallic nanoparticles have already demonstrated their huge potentiality both in chemistry and physics. Based on collective electronic oscillation, their plasmonic properties can be used for highly sensitive optical spectroscopy1,2, photo thermal therapy3, photovoltaics4…Recently a new field has
emerged: Plasmon driven surface catalyzed reactions5. For some specific molecules linked to metallic
nanoparticles (mainly gold or silver, these two metals exhibit strong plasmonic properties in the visible range), it has been shown by Surface Enhanced Raman Spectroscopy (SERS6) measurements
that a chemical reaction could occur when the plasmonic resonance of the nanoparticle is excited by an incoming light. In this case the localized plasmon act as a catalyst to activate the reaction. Such mechanism has been reported for Aminothiophenol (ATP, also known as Aminobenzenethiol or Para-mercaptoaniline) and Nitrothiophenol (NTP). During laser illumination, new vibrational modes are observed in the Raman spectra of these molecules. These modes have been first associated to a charge transfer mechanism7 (associated to the chemical effect in the enhancement mechanism of
SERS) or discussed in terms of change in the molecular orientation8. Nevertheless some recent
studies have demonstrated that they are in fact vibrational modes of Dimercaptoazobenzene (DMAB)9: two ATP (or NTP) molecules react on the metallic surface to form this new molecule. Many
SERS studies have since confirmed this hypothesis. A mechanism to explain this transformation has even been proposed. Nevertheless there is still a debate in the SERS community and new techniques are necessary to confirm this hypothesis. A promising tool is Tip Enhanced Raman Spectroscopy (TERS10). This technique, similar to SERS, is based on the giant electromagnetic enhancement present
at the apex of a metallic nanoantenna11. This electromagnetic enhancement is used to amplify the
2
this network. As a consequence SERS must be performed with specific substrates, which is a major limitation of this technique. In opposition, TERS can be performed with any kind of sample: the unique nanoantenna (usually a metallic tip) is simply approached to the sample thanks to a scanning probe microscope. The recorded Raman signal comes from the molecules localized a few nanometers around the apex of the tip. It is thus possible to have a high sensitivity associated to a nanometric resolution, similar to what can be obtained with optical near field devices12. TERS appears thus as a
perfect tool to study the chemical transformation of ATP or NTP into DMAB and several studies have reported such measurements. They have confirmed the high reactivity of ATP or NTP. Lantman et al. have observed temporal fluctuations in the TERS signal of NTP13. Performing high vacuum TERS
measurements Sun et al. have observed some unidentified vibrational modes14. Nevertheless none of
these studies has tried to take advantage of the high spatial resolution of TERS to perform mapping. In this article, we report such mapping performed on ATP deposited on a gold annealed sample. On some specific part of the sample new Raman modes are observed. These modes are compared to DFT calculations. We suggest that they could come from intermediate species formed during the transformation of ATP into DMAB.
Method
A SAM layer of ATP was prepared following the usual protocol15. The atomically flat Au(111) substrates
were purchased from Arrandee. A 1 mM solution of ATP molecules in ethanol was used for the SAM absorption on the freshly flame annealed substrate during an absorption time of 12 h. A Flat flame annealed surface was used to avoid any strong SERS background signal that could arise from gold nanostructures.
Our TERS set-up consists of a confocal Raman microscope (Labram HR800, HORIBA Jobin Yvon) with a 633 nm HeNe laser source optically coupled in an oblique backscattering geometry to a scanning probe microscope (XE-100, Park Systems). The 633 nm excitation is far from the absorption bands of ATP16 and resonant mechanism are excluded in our measurements. The long-working-distance
objective (50×, NA = 0.45) is oriented at 65° with respect to the sample normal (figure 1). The polarization state of the incident beam is p-polarized (electric field parallel to the scattering plane). Further details about the experimental setup can be found in other references17–19. The SPM is
operated in scanning tunnelling microscopy (STM) mode; the tips used were prepared from Au wire pieces of a 250 µm diameter and 99.99% purity (from Goodfellow) by electrochemical etching in a concentrated HCl / ethanol 1:1 solution. It must be said that a recent study has shown that the STM voltage has not much influence in the TERS measurements of ATP molecules 14. The TERS mapping
was performed over a 0.8 × 0.8 m2 area (number of pixels 20 × 20) by recording a Raman spectrum
at every 40 nm with a 1s acquisition time.
These experimental parameters offers a good
compromise between total acquisition time, spatial resolution, high quality Raman spectra
and total scan size.
The calculations of Raman modes were performed within Density Functional Theory (DFT) using the GAUSSIAN 09 suite20. We used the PW91PW91 functional21, a 6-311+G(2d,p) basis set for C,N,S and H
and a LANDL2DZ basis set for Au22. Those parameters are known to be efficient for the calculations of
3
FDTD simulations were performed using Lumerical software24 with parameters that have already
been used for others simulations25,26.
Results and Discussion
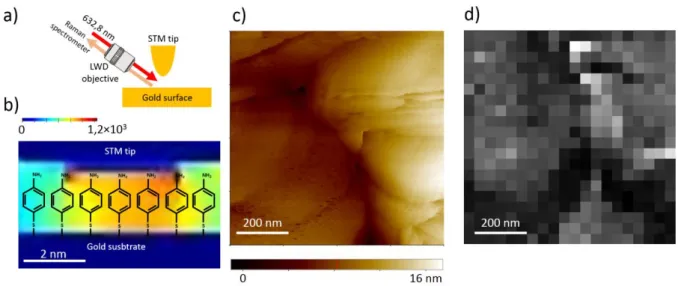
A typical STM image of the gold surface can be seen in figure 1c. It presents smooth and flat areas separated by a grain boundary. Such a surface is typical of what can be obtained with annealed gold. The average intensity of the TERS signal for the same surface is shown in figure 1d. A good
correlation between the TERS signal and the topography is observed. We can estimate the optical resolution to be lower than 100 nm, a much better resolution than what can be obtained with classical optical Raman microscopy. This confirms that the Raman signal really comes from the limited area below the tip as can be seen in figure1b. In addition no far-field Raman signal is observed when the tip is removed from the surface. A higher resolution could be obtained using a smaller mapping step size at the cost of a much longer total time acquisition. The TERS signal intensity is too low (ranging from 100 to 1000 cts/sec) to ensure a reasonable total time acquisition of the mapping compatible with a limited drift of the piezo-table.
Figure 1: a) Experimental setup configuration b) Distribution of the enhanced electromagnetic field between the tip and the gold surface (FDTD calculations) c) STM image of the gold surface (800 x 800 nm2) d) Corresponding TERS mapping of the same surface (average intensity integrated between 1500 and 1620 cm-1).
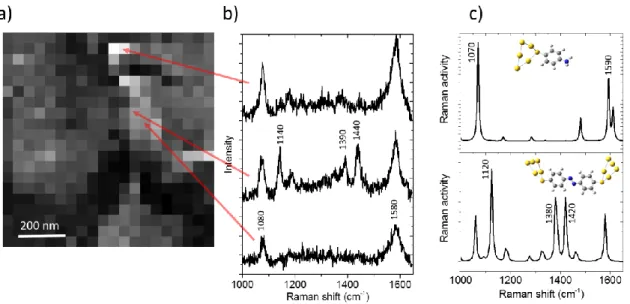
Some typical TERS spectra are reported (and the corresponding location are pointed by arrows on the TERS mapping) in figure 2. Most of the Raman spectra exhibit 2 peaks located at 1080 and 1580 cm-1. These two modes are associated to ATP molecules, this is clearly confirmed by DFT simulations
of the ATP Raman modes (figure 2c). In some particular places of the sample, other modes are observed: 1140, 1390 and 1440 cm-1 (see fig. 2 (b), TERS spectrum in the middle). These modes have
already been reported in many SERS studies of ATP and have led to many debates. As mentioned in the introduction, those Raman peaks has been first attributed to a charge transfer mechanism27,28.
Nevertheless, some recent studies have demonstrated that their presence strongly depends on several experimental parameters: density of the ATP layer, laser power, etc...15 These features are
4
have proposed to attribute them to a new molecule: DMAB9,29–31. This molecule should be formed via
dimerization of ATP molecules activated by an electromagnetic and plasmonic process occurring under the tip. Such a reaction can also be observed with nitrothiophenol molecules5.
Figure 2: a) TERS mapping b) Raman spectra for different positions of the mapping. c) DFT calculations of the Raman modes for ATP (above) and DMAB (below). Both molecules are in interaction with a 5 atoms gold cluster.
Many experimental studies have been performed and it appears in the Raman community that this hypothesis is now privileged to explain the presence of these new modes (1120, 1380 and 1420 cm -1).
Based on these TERS mapping on ATP molecules grafted on a Au substrate, we can conclude that most of the layer on the gold surface is still ATP, and in random locations on the sample the Raman modes of DMAB are observed suggesting that the dimerization has occurred. Nevertheless, it appears that our illumination condition is not powerful enough to induce an immediate and total transformation of ATP into DMAB. It must be said that no clear correlation between the places where DMAB molecules have been formed and the corresponding topography of the sample has been observed. The proposed mechanism for the transformation of ATP into DMAB is based on the giant electromagnetic enhancement present in the vicinity of plasmonic nanostructures. This
enhancement is highly localized, as can be seen in the figure 1b showing this distribution between the tip and the gold surface thanks to FDTD calculations. For gold nanostructures the
electromagnetic enhancement is usually much higher at their edge. The relation between
electromagnetic enhancement and the plasmon driven chemical reaction has been evidenced and discussed recently32. The gold annealed surface used in our study presents atomic flat grains but
some edges and kinks are anyway present (see STM image in figure 1c). DMAB molecules should preferentially be formed at these edges but the spatial resolution of the TERS mapping is not enough to confirm this hypothesis. To study the correlation between electromagnetic enhancement and DMAB synthesis we suggest to perform similar TERS measurements on a sample with well-defined metallic nanostructures (such as nanodots26 or nanotriangles33). Nevertheless performing TERS
5
will decrease the final spatial resolution. Performing such TERS measurements remains an experimental challenge.
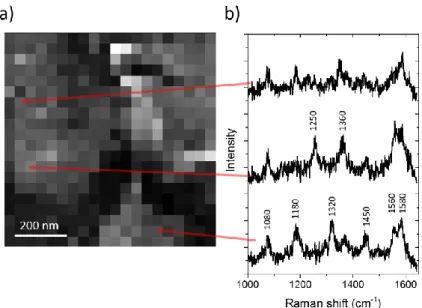
Figure 3: a) TERS mapping b) Others Raman spectra for different positions of the mapping indicated by the arrows.
In figure 3 are reported some Raman spectra that can neither be attributed to ATP or DMAB. These spectra are observed on a very limited number of places on the gold surface. This is the experimental reason why we have performed a rather large TERS scan at the cost of a lower spatial resolution: we wanted to observe a significant number of places where new Raman spectra are observed. Recently a high vacuum TERS measurements of ATP have reported the observation of new modes in the Raman spectrum of ATP14. The authors observed a considerably higher number of peaks compared to
what we observed here. Some unidentified peaks were attributed to IR modes activated by the strong gradient-field effect34 at the tip apex. Even without performing any TERS mapping, the results
shown in this article present a remarkably reproducible Raman signal. The fact that we have not observed such a high number of vibrational modes and that the other modes (corresponding to the DMAB) are observed only in some specific parts of the sample suggest that the unidentified modes presented in figure 3 should not be explained by a similar mechanism. Performing time resolved TERS measurements with nitrothiophenol, Lantman et al.13 have observed intensity fluctuations and have
associated them to a photoreaction, giving few suggestions about its exact nature. Recently, Zhao et
al.35 have performed a DFT study about the chemical photoinduced reaction of azobenzene on
nanostructured silver. For the conversion of ATP into DMAB, the authors have proposed the
mechanism described in figure 4a. Even proposed for silver, one can reasonably assume that it would be the same on a gold surface: these two metals exhibit similar plasmonic properties in the visible range, except the fact that the silver resonance occurs at shorter wavelengths compared to gold. The proposed mechanism reaction for the conversion of ATP into DMAB is based on the formation of several intermediate species. Some are surely extremely reactive (the charged radical species) and can probably not be observed, but some others might be more stable. As already mentioned, our illumination condition is not powerful enough to induce an immediate and total transformation of
6
ATP into DMAB. This suggests that some intermediate species could be observed in our TERS measurements and the induced vibrations associated to the unidentified Raman modes. To confirm this hypothesis, we have performed DFT calculations on some intermediate species (named DMHAB and DATP in figure 4a). It must be said that it is necessary to be cautious about the results given by these simulations: the mechanism of conversion is still under discussion36,37,29,38,39. A recent study of
Xu et al.40 has evidenced the role of oxygen and water in the conversion but the proposed
intermediate species remain the same. We have also performed similar calculations with the free ATP molecule. Calculated Raman activities are reported in figure 4b and c.
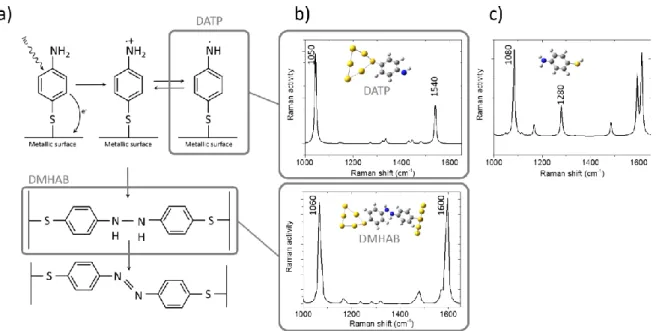
Figure 4: a) The chemical mechanism of synthesis of DMAB from ATP proposed by Zhao et al.35 b) DFT calculations of the Raman modes for different chemical intermediates DMAHB (for Dimercaptohydrazobenzene) and DATP (for deprotonated ATP) c) DFT calculations of a free ATP molecule.
For DATP, two main modes are observed: at 1050 and 1540 cm-1. Two main modes are also observed
for DMHAB with slightly different positions: 1060 and 1600 cm-1. Our spectral resolution in TERS
measurements is not enough to clearly distinguish two broad peaks separated by only 10 cm-1. As a
consequence the observed mode at 1080 cm-1 cannot be used to distinguish some intermediate
species. This is not the case for the higher frequency modes: in Raman spectra of figure 3 we can clearly distinguish a doublet at around 1600 cm-1, not observed in figure 2. The lowest frequency mode of this
doublet could be associated to DATP. In figure 3 there is also a broad mode observed in one spectrum at 1250 cm-1 and at 1320 cm-1 in the other. These peaks could be associated to the 1280 cm-1 mode
reported for free ATP (see figure 4c), not observed when ATP is in interaction with gold. This hypothesis suggests that during the photochemical reaction some ATP molecules are desorbed from the gold surface. We also note that the relative intensity between all the calculated modes strongly depends on the considered specie. This could explain the intensity temporal fluctuations reported by Lantman
et al13. As a conclusion, we suggest that these new modes could be the experimental fingerprint of
intermediate species formed during the transformation of ATP into DMAB. Conclusion
7
We have performed a TERS mapping on ATP molecules deposited on a flat gold surface. We have observed Raman modes of ATP and DMAB confirming that the plasmon driven dimerization can occur in such a configuration. We have also observed some unidentified vibrational modes. Our DFT calculations suggest that they could be the experimental fingerprints of intermediate species formed during the plasmon-driven dimerization. Our study confirms the huge potentiality of TERS for a better understanding of nanochemistry mechanisms.
Acknowledgements: The authors acknowledge Dr Nicolas Ferré, Dr Cédric Pardanaud and Pr Razvigor Ossikovski for fruitful discussions.
1
K. Kneipp, H. Kneipp, I. Itzkan, R. R. Dasari and M. S. Feld, Chem. Rev., 1999, 99,
2957−2975.
2
B. Pettinger, Mol. Phys., 2010, 108, 2039–2059.
3
X. Huang, P. K. Jain, I. H. El-Sayed and M. A. El-Sayed, lasers Med. Sci., 2009, 23,
217 – 228.
4
H. A. Atwater and A. Polman, Nat. Mater., 2010, 9, 205–13.
5
M. Sun and H. Xu, Small, 2012, 8, 2777–2786.
6
P. G. Etchegoin and E. C. Le Ru, Principles of surface-enhanced Raman spectroscopy
and related plasmonic effects, Elsevier, 2009.
7
M. Osawa, N. Matsuda, K. Yoshii and I. Uchida, J. Phys. Chem., 1994, 98, 12702–
12707.
8
T. Chen, H. Wang, G. Chen, Y. Wang, Y. Feng, W. S. Teo, T. Wu and H. Chen, ACS
Nano, 2010, 4, 3087–3094.
9
D. Y. Wu, X. M. Liu, Y. F. Huang, B. Ren, X. Xu and Z. Q. Tian, J. Phys. Chem. C,
2009, 113, 18212–18222.
10
R. M. Stockle, Y. D. Suh, V. Deckert and R. Zenobi, Chem. Phys. Lett., 2000, 318,
131.
11
A. Merlen and F. Lagugné Labarthet, Appl. Spectrosc., 2014, 68, 1307–1326.
12
A. Jorio and L. G. Cançado, Phys. Chem. Chem. Phys., 2012, 14, 15246–15256.
13
E. M. van S. Lantman, T. Deckert-Gaudig, A. J. G. Mank, V. Deckert and B. M.
Weckhuysen, Nat. Nanotechnol., 2012, 7, 583–586.
14
M. Sun, Y. Fang, Z. Zhang and H. Xu, Phys. Rev. E. Stat. Nonlin. Soft Matter Phys.,
2013, 87, 020401(R).
8
16
A. Merlen, V. Gadenne, J. Romann, V. Chevallier, L. Patrone and J. C. Valmalette,
Nanotechnology, 2009, 20, 7.
17
G. Picardi, M. Chaigneau and R. Ossikovski, Chem. Phys. Lett., 2009, 469, 161–165.
18
G. Picardi, M. Chaigneau, R. Ossikovski, C. Licitra and G. Delapierre, J. Raman
Spectrosc., 2009, 40, 1407–1412.
19
G. Picardi, A. Kròlikowska, R. Yasukuni, M. Chaigneau, M. Escude, V. Mourier, C.
Licitra and R. Ossikovski, chem. phys. chem., 2014, 15, 276–282.
20
M. J. Frisch, G. W. Trucks, H. B. Schlegel, G. E. Scuseria, M. A. Robb, J. R.
Cheeseman, G. Scalmani, V. Barone, B. Mennucci, G. A. Petersson, H. Nakatsuji, M.
Caricato, X. Li, H. P. Hratchian, A. F. Izmaylov, J. Bloino, G. Zheng, J. L.
Sonnenberg, M. Hada, M. Ehara, K. Toyota, R. Fukuda, J. Hasegawa, M. Ishida, T.
Nakajima, Y. Honda, O. Kitao, H. Nakai, T. Vreven, J. A. Montgomery, J. E. Peralta,
F. Ogliaro, M. Bearpark, J. J. Heyd, E. Brothers, K. N. Kudin, V. N. Staroverov, R.
Kobayashi, J. Normand, K. Raghavachari, A. Rendell, J. C. Burant, S. S. Iyengar, J.
Tomasi, M. Cossi, N. Rega, J. M. Millam, M. Klene, J. E. Knox, J. B. Cross, V.
Bakken, C. Adamo, J. Jaramillo, R. Gomperts, R. E. Stratmann, O. Yazyev, A. J.
Austin, R. Cammi, C. Pomelli, J. W. Ochterski, R. L. Martin, K. Morokuma, V. G.
Zakrzewski, G. A. Voth, P. Salvador, J. J. Dannenberg, S. Dapprich, A. D. Daniels, Ö.
Farkas, J. B. Foresman, J. V. Ortiz, J. Cioslowski and D. J. Fox, 2009, Gaussian, Inc.,
Wallingford CT.
21
J. P. Perdew, K. Burke and Y. Wang, Phys. Rev. B, 1996, 54, 16533.
22
P. J. Hay and W. R. Wadt, J. Chem. Phys., 1985, 82, 270.
23
M. Sun, Y. Huang, L. Xia, X. Chen and X. Hongxing, J. Phys. Chem. C, 2011, 115,
9629–9636.
24
Lumerical Solut. Inc. http//www.lumerical.com/tcad-products/fdtd/.
25
M.Tabatabaei, A. Sangar, N. Kazemi-Zanjani, P. Torchio, A. Merlen and F.
Lagugné-Labarthet, J. Phys. Chem. C, 2013, 117, 14778–14786.
26
A. Sangar, A. Merlen, P. Torchio, S. Vedraine, F. Flory, L. Escoubas, L. Patrone, G.
Delafosse, V. Chevallier, E. Moyen and M. Hanbucken, Sol. Energy Mater. Sol. Cells,
2013, 117, 657–662.
27
K. Uetsuki, P. Verma, T. Yano, Y. Saito, T. Ichimura and S. Kawata, J. Phys. Chem. C,
2010, 114, 7515–7520.
28
W.-H. Park and Z. H. Kim, Nanoletters, 2010, 10, 4040–4048.
29
L.-B. Zhao, M. Zhang, B. Ren, Z.-Q. Tian and D.-Y. Wu, J. Phys. Chem. C, 2014, 118,
27113−27122.
9