HAL Id: hal-01097083
https://hal-univ-tln.archives-ouvertes.fr/hal-01097083
Submitted on 5 Jan 2015
HAL is a multi-disciplinary open access
archive for the deposit and dissemination of
sci-entific research documents, whether they are
pub-lished or not. The documents may come from
teaching and research institutions in France or
abroad, or from public or private research centers.
L’archive ouverte pluridisciplinaire HAL, est
destinée au dépôt et à la diffusion de documents
scientifiques de niveau recherche, publiés ou non,
émanant des établissements d’enseignement et de
recherche français ou étrangers, des laboratoires
publics ou privés.
Speciation and bioavailability of dissolved copper in
different freshwaters: Comparison of modelling,
biological and chemical responses in aquatic mosses and
gammarids
Adeline Bourgeault, Philippe Ciffroy, Cédric Garnier, Carole Cossu-Leguille,
Jean-François Masfaraud, Rayna Charlatchka, Jean-Marie Garnier
To cite this version:
Adeline Bourgeault, Philippe Ciffroy, Cédric Garnier, Carole Cossu-Leguille, Jean-François Masfaraud,
et al.. Speciation and bioavailability of dissolved copper in different freshwaters: Comparison of
modelling, biological and chemical responses in aquatic mosses and gammarids. Science of the Total
Environment, Elsevier, 2013, 452-453, pp.68-77. �10.1016/j.scitotenv.2013.01.097�. �hal-01097083�
Speciation and bioavailability of dissolved copper in different freshwaters:
Comparison of modelling, biological and chemical responses in aquatic mosses
and gammarids
Adeline Bourgeault
a,⁎
, Philippe Ciffroy
b, Cédric Garnier
c, Carole Cossu-Leguille
d,
Jean-François Masfaraud
d, Rayna Charlatchka
b, Jean-Marie Garnier
aa
Aix-Marseille Université, CNRS, IRD,CEREGE, UM34, 13545 Aix en Provence, France
b
Electricité de France (EDF), Division Recherche et Développement, Laboratoire National d'Hydraulique et Environnement (LNHE), 6 quai Watier, 78401 Chatou, France
c
Université du Sud Toulon-Var, PROTEE, EA 3819, 83957 La Garde, France
dUniversité de Lorraine, CNRS UMR 7360 LIEC, Metz 57070, France
H I G H L I G H T S
► Speciation and biological responses were analysed in mesocosms to obtain insight into the site-specific bioavailability of Cu. ► A combined analytical/modelling methodology is useful for assessing Cu bioavailability.
► In natural freshwaters, the uptake of copper is principally controlled by organic complexation. ► The water physico-chemical conditions (major ions competition) exert no effect.
a b s t r a c t
a r t i c l e i n f o
Article history:
Received 10 November 2012
Received in revised form 27 January 2013 Accepted 28 January 2013 Available online xxxx Keywords: Copper Bioavailability Speciation Competition Freshwater organisms
Biological and chemical measurements were performed in mesocosms to investigate the bioavailability of cop-per, with a greater emphasis on the effects of competing ions and copper speciation. Measurements were achieved in three different natural waters for two aquatic species (Gammarus pulex and Fontinalis antipyretica) along a copper gradient concentration: natural concentration, spiked at 5 and 15μg L−1. Aquatic mosses
exhibited high enrichment rates that were above the background levels compared to gammarids. The accumu-lation of copper in F. antipyretica is better correlated to the weakly complexed copper concentrations measured using differential pulse anodic stripping voltammetry (DPASV) and diffusive gradient in thinfilm (DGT) than to the free copper concentration measured using an ion selective electrode (ISE). In unspiked natural waters, the presence of dissolved organic ligands strongly controls the metal speciation and consequently largely minimised the impact of competing cations on the accumulation of Cu in mosses. Furthermore, the BioMet Biotic Ligand Model (BLM) successfully describes the site-specific copper bioaccumulation for the freshwater mosses studied. However, the comparison of the results with a previous study appears to indicate that the adsorption/desorption of Cu in mosses is impacted by seasons. This highlights a limit of the BioMet model in which the physiological state of aquatic organisms is not considered. No toxic effect of Cu exposure on lipid peroxidation was observed in the mosses and gammarids regardless of the site and the concentration considered. However, the oxidative stress measured in the mosses via their guaiacol peroxidase (GPX) activity increased in the case where internalised Cu reached maximal values, which suggests a threshold effect on the GPX activity.
© 2013 Elsevier B.V. All rights reserved.
1. Introduction
The Environmental Quality Standards (EQS) for metals established by the Water Framework Directive (WFD) for ensuring a good water quality status of freshwater systems are related to the total dissolved concentrations of the metals (directive 2008/105/CE of the European
Parliament and Council). However, the bioavailability and toxicity of dissolved metals are not only related to their concentrations but also, and primarily, to their speciation, which depends on the water compo-sition (Campbell et al., 1995; Meylan et al., 2004a). For instance, the concentration and type of dissolved organic carbon (DOC) have been shown to modify the bioaccumulation of Cu via chemical complexation (Lores et al., 1999; Luider et al., 2004; Ferreira et al., 2008; Zhong et al., 2012). Furthermore, some studies have shown that speciation alone is insufficient for predicting accumulation and toxicity because competi-tion with cacompeti-tions can affect the processes. For instance, the presence
⁎ Corresponding author at: CEA de Saclay, IRAMIS/SIS2M/LIONS, 91190 Gif sur Yvette, France. Tel.: + 33 1 69 08 65 67.
E-mail address:[email protected](A. Bourgeault). 0048-9697/$– see front matter © 2013 Elsevier B.V. All rights reserved.
http://dx.doi.org/10.1016/j.scitotenv.2013.01.097
Contents lists available atSciVerse ScienceDirect
Science of the Total Environment
of competing cations such as Ca2+, Mg2+, H+, Na+or K+reduces the bioavailability of Cu (De Schamphelaere and Janssen, 2002; Ferreira et al., 2009). Considering this background information, three categories of approaches or techniques are candidates for improving the risk assessment of metals in water bodies.
First, analytical and sampling methods have been developed to approach metals in freshwater systems. The free metal ion activity can be measured using an ion selective electrode (ISE) (e.g.,Rachou et al., 2007). Differential pulse anodic stripping voltammetry (DPASV) and diffusive gradient in thinfilm (DGT) techniques can provide operational concentrations of labile metals, which are defined as the addition of free metal ions and easily dissociating complexes (e.g.,Meylan et al., 2004a; Rachou et al., 2007; Priadi et al., 2011; Feldmann et al., 2009).
Second, integrative biological indicators (or biomonitors) have been used because they can accumulate metals to high concentrations, there-by facilitating the measurement of these contaminants. Furthermore, potential biological effects can be assessed in these biomonitors through the measurement of various biomarkers as an early response to chemical contamination (Vasseur and Cossu-Leguille, 2003). With respect to freshwater, the use of aquatic bryophytes and gammarids has been proposed for water monitoring (Say and Whitton, 1983; Siebert et al., 1996; Geffard et al., 2007). Indeed, these two species are widespread in freshwater systems throughout France and Europe and are net accumulators of trace metals which make them reliable biomonitors of metal bioavailability.
Finally, models have been developed to predict metal speciation, bioaccumulation and/or toxicity. One of the most commonly used models to estimate metal speciation is the WHAM (Windermere Humic Aqueous Model) (Tipping et al., 1998). This model allows the prediction of different metal species as long as the input data (pH, dissolved metal, DOC and ion concentrations) are available. However, the variable nature of organic matter adds uncertainty to the aquatic speciation model. To consider competition with cations that affects tox-icity processes, speciation models such as the WHAM have also been coupled to models that simulate the accumulation of metals onto the biotic membrane, and the result of this coupling is the so-called Biotic Ligand Models (BLM) (Paquin et al., 2002). In the complete version of the BLM, the metal toxicity is predicted according to 13 water chemistry parameters. More recently, the freely downloadable Bio-Met Bioavail-ability Tool (www.bio-met.net) was designed to use a limited number of variables (dissolved Cu concentration, DOC, Ca and pH). However, some studies have reported some limits of the BLM. For instance, the Cu-BLM do not adequately predict the toxicity of Cu to rainbow trout in soft water (Ng et al., 2010).
In the present study, tools belonging to each of these three categories (i.e., monitoring speciation, biological tools and modelling tools) were used to investigate how the speciation of copper affects its accumulation and toxicity in freshwater organisms. The following techniques were
compared on samples obtained from common ex-situfield experiments: to fully characterise the copper speciation, ISE, DPASV and DGT tech-niques were used; as biomonitors able to provide information about the bioaccumulation potential, two species were selected (Gammarus pulex and Fontinalis antipyretica), and oxidative stress measurements were performed to assess the toxicity of copper in these two species; finally, the WHAM and BLM-BioMet models were applied to the inves-tigated waters. Furthermore, the physicochemical parameters of the waters (especially concentrations of ions and dissolved organic matter) were measured to evaluate their impact on the accumulation and toxic-ity of Cu.
Exposures with ex-situflow-through field mesocosms were used to compare these techniques on a common basis and to provide better insight into the complexation and competing processes involved in natural freshwaters. Indeed, unlike in-situ experiments, the mesocosms used here, which were continuously supplied with natural water spiked with various environmental Cu concentrations, allowed the comparison of processes along a Cu gradient in waters that had the same physico-chemistry. To better understand the factors that affect the bioavail-ability of Cu and to improve the risk assessment of this metal, three different freshwaters were studied (with low, medium and high ionic concentration). A lower Cu bioavailability is expected with a higher concentration of competing cations and organic matter in the exposure water. Accordingly, the goal of the present study was to investigate the predictive powers of modelling and speciation analysis and to consequently determine the Cu fraction (e.g., free Cu, weakly complexed Cu, and total dissolved Cu) that best correlated with bioaccumulation and toxicity.
2. Materials and methods
2.1. Collection and handling of organisms
Aquatic mosses (F. antipyretica) and gammarids (G. pulex) were collected from July to August 2011 from two low-contaminated sites: the Sauldre River (Ménétréol-sur-Sauldre, France) for the collection of aquatic mosses and the rill Ru de L'Etang (Doue, France) for the gammarids. New green tips (2–3 cm) of aquatic mosses and male gammarids (12–15 mm) were selected and returned to the laboratory in thefield water. Precopulas of the gammarids were collected in the field to easily identify males. Alder leaves were also collected near the Sauldre River and dried for 3 days at 60 °C. The organisms were acclimated in the laboratory in aerated water at 18 °C with a 14 h:8 h light:dark photoperiod for 3 days before the experiments. During this acclimation, thefield water in the containers was progressively replaced with exposure water and the gammarids were fed ad libitum with alder leaves.
Fig. 1. Exposure system composed of a pump set at 0.5 L min−1(1), a lamellar decanter (2), a purge valve (3), a 6 L Cu stock solution (10 or 30 mg L−1) (4), a peristaltic pump set at 0.25 mL min−1(5), a 20 L reservoir for Cu-contaminated water (6), a 20 L tank (7), a multi-parameter probe (8), an aeration system (9) and a system overflow (10).
2.2. Experimental design
Exposures were conducted in 3 natural waters with different chemical compositions: a mineral water (MontCalm) (low ionic concen-tration, referred to as Site 1), the Loire River water from Belleville/France (moderate ionic concentration, referred to as Site 2) and the Moselle River water from Cattenom/France (high ionic concentration, referred to as Site 3). For each site, three exposure systems were deployed: the first one for natural concentration and two others spiked with Cu to reach a concentration of 5 or 15μg L−1. These concentrations are environmentally realistic. For instance, the mean concentration of dissolved copper in the water of Loire River is 3.3μg L–1 (min: 0.6μg L–1, max: 45μg L–1) (data obtained from the network monitoring of the French Water Agency Loire-Bretagne available at http://www.eau-loire-bretagne.fr/). The exposure device used in thefield at Sites 2 and 3 is described inFig. 1.
This device is composed of a lamellar decanter that is continuously fed withfield water. The decanted water is then continuously spiked using a peristaltic pump in a 20 L reservoir with a Cu stock solution (CuNO3, laboratory reagent grade, Fisher Scientific) to reach a final spiked dissolved Cu concentration of 0, 5 or 15μg L−1. The Cu-contaminated water is then directed to a 20 L tank where the gamma-rids and aquatic mosses are exposed to the water. The acid-washed exposure device was conditioned for 24 h before the start of the experiment, and the tank was continuously aerated. In the case of the laboratory experiment with the MontCalm mineral water (Site 1), the exposure system was used in a semi-static way. The Cu-contaminated water was supplied from a 100 L reservoir and continuously circulated in the tank using peristaltic pumps. The concentration of dissolved Cu was measured daily in each of the exposure systems and adjusted, if nec-essary, with a Cu stock solution (CuNO3, purity>95%, Fisher chemicals, 120 mg L−1) to the nominal Cu concentration (i.e., 5 or 15μg L−1).
Each experiment was conducted outdoors to provide similar expo-sure conditions (natural light/dark cycle, daily variation of temperature). For the Site 1 exposure, the 100 L reservoir of Cu contaminated water was stored in a thermostated room at 18 °C to avoid a significant warming of the exposure medium in the tanks that were exposed outdoors. In addition, the three exposure experiments were performed on a short time scale (from July 5th to August 12th, 2011) with calibrated organisms (i.e., male gammarids and new green tips of aquatic mosses) to limit biological variability. Male gammarids were selected since Correia et al. (2003)show that level of lipid peroxide in Gammarus locusta is 40% higher in adults males compared to adults females or juveniles.
Adult male gammarids (75 organisms) were divided into 3 pools and each pool was placed into polypropylene cylinder (diameter×length: 3×10 cm) whose ends were capped with pieces of net (mesh size: 1 mm) and positioned parallel to the waterflow. Dried alder leaves (0.16 g) were supplied to each cage to feed the gammarids and to provide a resting surface to minimise cannibalism. Aquatic mosses (300 green tips) were directly exposed in the tank.
Water samples were automatically collected from the tank every 30 min by autosampling devices (ISCO 6700) to obtain 4 composite samples of 500 mL per day for each exposure system. To prevent con-tamination, the bottles of the autosampling devices were cleaned with 10% nitric acid and then rinsed with Milli-Q water (Millipore). Before autosampling, 10 mL of NaN3(0.05 M) was added to each bottle to prevent any biological activity in the collected samples.
2.3. Water chemical analyses 2.3.1. Physico-chemical parameters
The temperature, conductivity, pH, chlorophyll and oxygen con-centrations were measured in the tanks every 10 min using a multiparameter probe (YSI 6600 V2). Composite water samples collected by the autosampling devices were used to monitor the physicochemical parameters (anions, cations, and dissolved organic
and inorganic carbon concentrations) and metal contamination (total and dissolved Cu concentrations). The major cation and anion concen-trations were determined using inductively coupled plasma atomic emission spectroscopy (ICP-AES Ultima C, Jobin-Yvon Horiba) and capillary electrophoresis (CIA type, Waters), respectively, afterfiltration through a 0.45μm cellulose nitrate filter. The dissolved organic and inorganic carbon (DOC/DIC) concentrations were measured using a TOC-analyser (Shimadzu TOC-VCSH analyser) afterfiltration through a pre-combusted GFFfilter (Whatman). Raw water samples for the analysis of total copper (45 mL) were acidified with 1 mL of HNO3 (65% suprapur Merck) and 4 mL of HCl (30% suprapur, Merck). These samples were then microwave digested in a Teflon vessel (Mars Xpress, CEM) during a 15 min ramp to 180 °C at 1600 W and a 15 min stable period at 180 °C at 1600 W. The samples for the analysis of dissolved Cu werefiltered through a 0.45 μm cellulose nitrate filter (Whatman) and acidified with 1% (v/v) HNO3before the metal analysis with a graphite furnace atomic absorption spectrometer (GF-AAS, iCE 3000 series, ThermoFisher).
2.3.2. DGT-labile copper concentration
The 5-day integrative concentration of labile Cu was monitored using DGT technique (Davison and Zhang, 1994). Three preassembled DGT open-pore units (DGT research, Landcaster, UK) were used for each water sample. The DGT devices are composed of Chelex resins and open-pore diffusive gels that are covered with a 0.45μm poly-ether sulfone (PES)filter. After retrieval of the DGTs, the Chelex resins were eluted in 1 mL of 1 M HNO3(65% suprapur Merck) in which the Cu analysis was performed by GF-AAS after sample dilution. The integrated labile concentrations and the associated standard deviations were calculated using the method described byTusseau-Vuillemin et al. (2007).
2.3.3. DPASV-labile copper concentration
Water samples were analysed by pseudopolarography to assess the concentration of the most available forms of Cu, following an analytical protocol adapted from previous studies (Louis et al., 2008; Nicolau et al., 2008; Bravin et al., 2012). Voltammetric measurements were performed using aμAutolabIII potentiostat (EcoChemie) coupled to a Metrohm 663 VA stand (Metrohm). Polynomial baseline sub-traction was applied for each obtained voltammogram to determine the Cu peak area (Omanović et al., 2010). Details of the experimental procedure are provided in the Supporting information. Briefly, the following procedure was applied:
(1) Measurements of pseudopolarograms (varying the deposition potential, Edep, from−1.5 to +0.1 V with a step of 0.1 V) at natural pH.
(2) Cu standard additions with DPASV measurements (Edep−1.5 V) to determine the sensitivity of the technique at natural pH. (3) Measurements of pseudopolarograms (using minimal Edepof
−1.1 V) after acidification to fully dissociate the organic Cu complexes
(4) Cu standard additions with DPASV measurements (Edep−1.1 V) to determine the sensitivity of the technique under acidic pH conditions and to calculate the concentration of total dissolved Cu. (5) In addition to the“inorganic” Cu fraction, 2 other fractions, which were called“weak” and “strong” Cu complexes fractions, were op-erationally defined in reference to the measurements performed at natural pH with an Edep−0.9 V and −1.5 V. Finally, from the difference between the concentration of the total dissolved Cu (pHb2) and the sum of the 3 Cu fractions (“inorganic”, “weak” and “strong” Cu complexes), a 4th fraction was defined as“inert” Cu complexes, which correspond to organic Cu com-plexes that are not electrochemically detectable in the defined conditions (e.g., Nicolau et al., 2008; Feldmann et al., 2009; Bravin et al., 2012).
2.3.4. Free copper concentration
The free Cu concentration was measured in the 4 water samples obtained daily using an ion selective electrode (ISE, Orion Cupric elec-trode 96–29, Thermo Electron Corporation) following the methodology described byRachou et al. (2007). Briefly, 9 standard solutions were used for the daily calibration of the electrode. These solutions were made to 500 mL using 1 mM IDA (iminodiacetic acid), 0.1 mM Cu(NO3)2, 6 mM NaOH, 2.5 mM potassium acid phthalate and 0.01 M KNO3. The ionic strengths of the standard solutions were adjusted to the ionic strength of the water samples using varying amounts of KNO3, and the pH was adjusted from 3 to 10 using HNO310% v/v. The measured value in mV (acceptation of the value atb0.1 mV/min) was converted to free Cu2+activity after calculating the speciation of Cu in each standard solution using the chemical equilibrium software PHREEQC (Parkhurst and Appelo, 1999).
2.4. Biological responses
2.4.1. Bioaccumulation measurements
The metal content in the organisms was determined at 0 and 5 days of exposure from three pools of 5 gammarids andfive pools of 15 new green tips of aquatic mosses. This time of exposure was chosen based on a previous study (Ferreira et al., in press) in which Cu bioaccumulation in mosses reached equilibrium after 5 days. Each pool of the 15 green tips of aquatic mosses was washed for 1 h in 50 mL of 1 mM EDTA (normapur grade, Acros Organics) to evalu-ate the adsorbed metal (Meylan et al., 2003). The Cu concentration in the EDTA solution was analysed to measure the adsorbed metal on the biological membrane. Then, the EDTA-washed mosses and gammarids were dried for 4 days at 60 °C and microwave digested (Mars Xpress, CEM) with 5 ml of HNO3(65% suprapur Merck) and 1 ml of H2O2 (30% suprapur Merck). The Cu concentrations were determined using GF-AAS. Reference materials (BCR-60 aquatic mosses and ERM-CE278 mussel tissue) were used to validate the microwave di-gestion. The deviation for Cu from the certified values was b7% (n=10) andb10% (n=6) for BRC-60 and ERM-CE278, respectively.
2.4.2. Oxidative stress
Oxidative stress parameters were measured on three pools of 5 gammarids andfive pools of 10 tips of aquatic mosses collected at 0, 2 and 5 days of exposure and immediately frozen in liquid nitrogen. In the mosses, the lipid peroxidation level was assessed through the measurement of thiobarbituric acid reactive substances (TBARS), as described byAravind and Prasad (2003). Moss strands were weighed before being homogenised in a 0.5% TBA–20% TCA solution. After centrifugation (10,000 ×g, 10 min), the samples were incubated at 95 °C for 30 min andfinally transferred onto ice to stop the reaction. The non-specific absorbance of the supernatant was measured at 600 nm and subtracted from the absorbance at 532 nm. The TBARS concentration was determined using an extinction coefficient of 155 mM−1cm−1.
To determine the guaiacol peroxidase (GPX) activity level, the moss samples were homogenised in a 50 mM phosphate buffer with a pH of 6.0. The supernatant from centrifuging at 15,000 ×g (10 min) was used as the enzyme extract. The GPX level of the mosses was spectrophoto-metrically assayed according toRoy et al. (1996)with no modifications. For calculating the GPX activity level, a molar extinction coefficient of 26.6 mM−1cm−1at 470 nm for tetraguaiacol was used, and the protein concentration in the enzyme extracts was determined using Bradford's method (1976).
The lipid peroxidation level was measured in the gammarids from the malondialdehyde (MDA) levels determined using an HPLC method adapted from Behrens and Madère (1991) with UV detection at 267 nm. Each pool of gammarids was homogenised with a manual Potter Elvejehm tissue grinder in a 50 mM phosphate buffer of KH2PO4/K2HPO4 (pH 7.6) supplemented with 1 mM phenylmethylsulphonylfluoride
(PMSF) and a 1 mM serine–borate mixture as protease inhibitors. The homogenisation buffer was adjusted to a volume two-times greater than the wet weight of the sample pool. Seventy microliters of the total homogenate were diluted four-fold in 95% ethanol (HPLC grade) and cooled on ice for 1.5 h to deproteinise them. The mixture was then centrifuged at 18,000 ×g for 30 min at 4 °C. The resulting supernatant (100μL) was injected into the HPLC separation system (Merck Itachi, Lachrom).
2.5. BLM and WHAM simulations
For each experiment, a user-friendly Cu-BLM (www.bio-met.net) was used to predict a bioavailability factor (BioF) and a bioavailable Cu concentration, which is the total dissolved Cu concentration multiplied by the BioF from a limited number of input parameters (dissolved Cu concentration, DOC, Ca and pH).
To predict the dissolved copper speciation and particularly its complexation with organic ligands, the WHAM VI Model was applied (Tipping, 1994).
2.6. Statistical analysis
The results are expressed as the mean± standard deviation. The normal distribution of the data was examined using the Shapiro–Wilk test. Differences in responses were evaluated by ANOVA followed by a post hoc HSD Tukey test of the log of the transformed data. Statistical significance was set at pb0.05, and analyses were performed using the SigmaStat 3.5 software package.
Principal component analysis (PCA) was applied to evaluate the relationship between the water chemical parameters, copper specia-tion, Cu-BLM predictions and copper bioaccumulation in the mosses exposed to the 3 types of water. Computations were performed on standardised variables using XLStat 2010 4.03.
3. Results
3.1. Water chemistry and copper speciation
The average conductivity measured over the 5 days of exposure (i.e., 40μS cm−1, 280μS cm−1and 1870μS cm−1for Sites 1, 2 and 3, respectively) covered a wide range of ionic strengths, which is explained by the different contents of Cl−, SO42−, Ca2+, Mg2+, Na+ and K+in each water sample (Table 1). Furthermore, for each experi-ment, a daily evolution exhibited a decrease in the temperature at night combined with a decrease in the oxygen and pH (Fig. S1).
The dissolved Cu concentrations were very similar to the total ones that included the particulate phase, which indicates that the
Table 1
Physico-chemical parameters measured during the 5-day exposures at Sites 1, 2 and 3. Mean ± SD (n = 20).
Site 1 Site 2 Site 3
Cl−(mg L−1) 0.7 ± 0.0 17.2 ± 0.1 377.7 ± 2.2 SO42−(mg L−1) 10.3 ± 0.1 13.7 ± 0.1 132.6 ± 1.6 Ca2+ (mg L−1) 2.8 ± 0.1 28.7 ± 0.7 177.6 ± 2.7 Mg2+ (mg L−1) 0.7 ± 0.0 4.9 ± 0.1 21.8 ± 0.4 K+ (mg L−1) 0.9 ± 0.1 4.6 ± 0.3 17.0 ± 1.1 DOC (mg L−1) 2.6 ± 0.9 5.0 ± 1.1 5.3 ± 1.5 DIC (mg L−1) 0.7 ± 0.6 15.8 ± 1.4 17.3 ± 2.37 pH 6.9 ± 0.0 8.6 ± 0.2 7.6 ± 0.1 Temperature (°C) 18 ± 1 18 ± 1 23 ± 1 Chlorophyll (μg L−1) 0.9 ± 0.7 5 ± 1 – Conductivity (μS cm−1) 40 ± 1 280 ± 3 1870 ± 32 Oxygen (mg L−1) 9.5 ± 0.2 9.6 ± 0.3 6.3 ± 0.6 DOC: dissolved organic carbon.
DIC: dissolved inorganic carbon.
experimental design and especially the efficiency of the lamellar de-canter allowed only dissolved exposures. Furthermore, rather stable dissolved copper concentrations were obtained over time (see Fig. S2 for Site 3); the temporal variations of the dissolved Cu concentra-tion were 10% on average in the tank, with a maximum of 15% for the exposures at Site 2. Similarly, the semi-static exposure in the labora-tory, which involved a large reservoir (100 L) of MontCalm water (Site 1) and a daily copper spiking, maintained a constant concentra-tion of dissolved copper throughout the exposure (time variaconcentra-tion of 10% on average). The measured dissolved copper concentrations were closer to the nominal concentrations for Sites 1 and 3 (4.6± 0.5μg L−1and 6.5±0.6μg L−1, respectively, for the 5μg L−1exposure; 17.2±1.5μg L−1 and 15.1±0.6μg L−1for the 15μg L−1exposure). For Site 2, the measured total dissolved concentrations were less than the nominal ones (i.e., 1.8±0.3μg L−1and 11.8±1.8μg L−1for 5 and 15μg L−1, respectively).
The concentrations of total dissolved Cu measured by DPASV were very similar to the ones determined by GFAAS (r2= 0.98). Additionally, due to its greater sensitivity, DPASV allowed the determination of the total Cu concentrations in the unspiked samples from Site 1 (Table 2). In the unspiked samples, the Cu speciation appeared to be strongly controlled by organic ligands (dominated by inert com-plexes) as the inorganic fraction represents less than 10% (Fig. 2), which confirms the high affinity of this metal for dissolved organic matter, as observed in various environments (Donat and Bruland, 1995; Meylan et al., 2004a; Louis et al., 2008; Bravin et al., 2012). When increasing the Cu concentration, the proportion of inorganic Cu also increases, which signifies the progressive saturation of the organic ligands. In the spiked samples from Site 1, Cu appears to be quasi-fully inorganic; therefore, it is likely considerably more bio-available for the organisms. As an example, Fig. S3 shows the results obtained from Site 3 for individual samples and composite ones (obtained by a mixing of the 5 sub samples). The Cu speciation appeared to be stable between the different samples collected during the timescale of the organism exposition at a defined Cu concentra-tion, which is in contrast to the observed variation when increasing the total Cu concentration. This result is of particular importance when compared to the DGT measurements, which correspond to an integrative value. The DGT-labile Cu accounted for 12% to 82% of the total dissolved Cu (Table 2). As also observed by the DPASV
measurements, the fraction of DGT-labile Cu increased when Cu was added to the exposure water.
The free Cu concentration was only measured using the ISE in the exposure water spiked at 5 and 15μg L−1because the potential mea-sured in the non-contaminated water was less than the quantification limit (i.e.,b0.01 ng L−1) (Table 2). The free Cu concentration ranged between 0.06 ng L−1in the water spiked at 5μg L−1and 4.8 ng L−1 in the water spiked at 15μg L−1depending on the site considered. The free Cu fractions were between 0.002% and 0.033% of the total dissolved Cu, and the Cu2+concentrationfluctuated over time by a factor of 3–6 depending on the exposure.
3.2. Bioaccumulation measurement
The Cu concentration in the gammarids slightly increased with the dissolved exposure concentration, although it was not statistically significant. The copper content in the gammarids exposed to 17.2μg L−1 (Site 1) reached a maximum of 99.6μg g
dw
−1, whereas the initial copper content in the gammarids was 69.3μg gdw−1(Table 2).
Table 2
Total, DGT-labile, DPASV-labile, BLM-predicted (μg L−1) and free (ng L−1) copper concentrations in exposure waters and copper content in mosses and gammarids (μg g dw −1).
Site 1 Site 2 Site 3
Total dissolved Cu μg L−1 Mean bLQ 4.6 17.2 0.9 1.9 11.8 1.9 6.5 15.1 sd 0.5 1.5 0.3 0.3 1.8 0.2 0.6 0.6 Labile Cu (DGT) μg L−1 Mean bLQ 3.7 12.5 0.2 0.5 6.6 0.2 3.8 9.5 sd 0.6 1.0 0.0 0.0 1.6 0.0 0.3 0.8 % Mean 82 73 19 25 56 12 58 63 sd 17 9 7 4 16 3 7 6 Labile Cu (DP-ASV) μg L−1 CuT 1.03 4.75 16.84 1.03 1.93 11.84 1.89 3.92 12.65 μg L−1 Cu−1.5 V 0.33 4.75 16.84 0.32 0.60 6.19 0.55 2.04 7.19 μg L−1 Cu−0.9 V 0.27 4.67 16.84 0.22 0.37 5.76 0.28 1.66 6.21 μg L−1 Cu−0.3 V 0.04 4.08 16.84 0.11 0.26 2.84 0.20 0.94 3.60 % Cu−1.5 V 32 100 100 31 31 52 29 52 57 % Cu−0.9 V 26 98 100 21 19 49 15 42 49 % Cu−0.3 V 4 86 100 10 13 24 11 24 29
Free Cu (ISE) ng L−1 Mean bLQ 6.1 4.2 bLQ 0.1 1.9 bLQ 0.1 4.8
sd 2.3 0.6 0.0 0.7 0.0 1.6 Bioavailable Cu (BLM BioMet) μg L−1 0.02 0.59 1.80 0.11 0.22 1.32 0.10 0.34 0.54 Cu in gammarids μg g−1 Mean 69.2 78.5 99.6 59.8 69.8 84.4 71.0 75.1 93.2 sd 7.9 3.6 9.7 6.0 8.1 18.8 6.9 13.0 2.3 Cu in mosses μg g−1 Cu int 7.4 19.5 113.4 9.2 10.4 58.5 9.5 28.5 76.7 sd 0.2 4.9 18.0 1.6 0.4 11.6 0.4 7.0 8.7 Cu ext 1.7 38.1 452.2 4.9 11.8 327.2 7.7 112.5 388.9 sd 0.1 10.3 44.5 0.5 1.0 30.3 0.5 12.9 20.3 % Cu ext 19 66 80 35 53 85 45 80 84 sd 1.1 9 1 5 2 3 2 2 2 0% 20% 40% 60% 80% 100% 0 5 15 0 5 15 0 5 15
Site 1 Site 2 Site 3
Cu - inert Cu - strong Cu - weak Cu - inorganic
Fig. 2. Evaluation of the different Cu fractions (“inorganic”, “weak”, “strong” and “inert”) measured using DPASV (%) for Sites 1, 2 and 3 as a function of the nominal copper expo-sure concentrations (0, 5 and 15μg L−1).
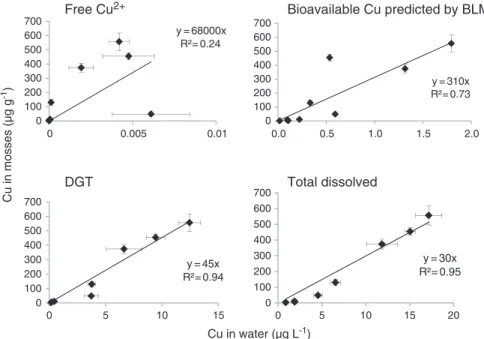
A significant Cu accumulation was observed in the aquatic mosses (Table 2). For instance, the total Cu concentration (=Cint+ Cext) in the mosses exposed to 1.9, 6.5 and 15.0μg L−1of Cu in Site 3 is 17 ± 1, 141 ±19 and 466 ±24μg gdw−1, respectively, with a mean initial copper content of 11μg gdw−1. The proportion of extracellular Cu in the mosses is a function of the Cu exposure concentration (Table 2). Furthermore, sig-nificant correlations were observed between the Cu content of the mosses and the dissolved Cu (r2=0.95, pb0.01), DGT-labile Cu (r2= 0.94, pb0.01) or BLM-predicted concentrations (r2
= 0.73, pb0.01) but not with the free Cu concentrations (r2b0.24, p>0.29) (Fig. 3). 3.3. Oxidative stress
No effect of Cu exposure on lipid peroxidation was observed in the mosses and gammarids (pb0.05), regardless of the site or the concen-tration considered (data not shown). The induction of GPX enzymes in the mosses was observed after 5 days of exposure in Site 1 water spiked at 5 and 15μg L, although the result was only significant (pb0.05) for the exposure at 15 μg L−1(Fig. 4).
3.4. BLM
The simulations conducted using the BioMet-BLM (Table 2) were determined from the average measured pH, Cu, Ca and DOC concen-trations (Table 1). The average pH at Site 2 (i.e., 8.6) and the average Ca concentration at Site 3 (i.e., 178 mg L−1) exceeded the range for the use of the BioMet-BLM (i.e., 5.5–8.5 for pH and 3.1–93 mg L−1 for Ca). Therefore, the maximal pH and Ca concentration for the range of applications were used for the simulations.
4. Discussion 4.1. Copper speciation
The characterisation of Cu speciation is an important step to un-derstand bioaccumulation. This characterisation can be performed due to the different tools, such as ISE, DGT, DPASV and WHAM, which were used here to measure the different Cu fractions.
The DGT-labile Cu concentration and the sum of the inorganic Cu and weak organic Cu complexes obtained by DPASV exhibited a sim-ilar response pattern; the slope was 1.002 ± 0.047 (r2= 0.76), which is in agreement with a previous study (Bravin et al., 2012).
The WHAM model was applied to predict the copper speciation. Typically, 50% of dissolved organic matter (DOM) is considered to be composed of fulvic acid (i.e., active DOM). Under this consider-ation, the agreement between the WHAM predictions and the exper-imental inorganic and free Cu concentrations was poor (data not shown).Craven et al. (2012)also observed a poor correlation when comparing Cu2+predicted by WHAM to the measured concentration and suggested that the WHAM predictions could be improved by re-fining the Cu-DOM binding constant. With respect to the inorganic fraction, a mean difference of 2 orders of magnitude was observed for the 3 exposure waters. A primary input parameter in the WHAM is the concentration of active DOM because it determines the number of binding sites available to copper. Because the composition of DOM
Cu in mosses (µg g -1) Cu in water (µg L-1) y = 45x R²= 0.94 0 100 200 300 400 500 600 700
DGT
y = 30x R²= 0.95 0 100 200 300 400 500 600 700 0Total dissolved
y = 310x R²= 0.73 0 100 200 300 400 500 600 700Bioavailable Cu predicted by BLM
y = 68000x R²= 0.24 0 100 200 300 400 500 600 700Free Cu
2+ 0 0.005 0.01 0.0 0.5 1.0 1.5 2.0 5 10 15 0 5 10 15 20Fig. 3. Total copper concentration in moss (μg gdry weight−1 ) as a function of the copper concentration in water (free Cu2+, DGT-labile, and total dissolved concentrations are represented as
temporal mean±SD) or bioavailable copper concentration predicted by BioMet-BLM (μg L−1).
* 0% 40% 80% 120% 160% D2 D5 D2 D5 D2 D5 GPX (%) Site 1 Site 2 Site 3 Cu = 0 µg L-1 Cu = 5 µg L-1 Cu = 15 µg L-1
Fig. 4. GPX activity (as % of D2 value of unexposed group) measured in Fontinalis antipyretica after 2 and 5 days of exposure at 0, 5 and 15μg L−1of copper for the 3 sites. * Significantly
was not known, the WHAM was conducted to adjust the percentage of active DOM (i.e., fulvic acids) that bestfitted the inorganic copper concentration measured by DPASV. In this manner, the binding ca-pacities of DOM were characterised. The bestfit was obtained when the percentage of active DOM was set to 2%, 13% and 16% for Site 1 (r2= 0.988), Site 2 (r2= 0.988) and Site 3 (r2= 0.940), respectively. These values are low when compared to other studies. For instance, Dwane and Tipping (1998)observed that the best match between the WHAM-calculated and ISE-measured Cu2+was obtained when 40% to 80% of the DOM was considered to be active fulvic acid. De-spite the fact that Cu speciation is primarily controlled by organic ligands (Fig. 2), especially at ambient total Cu concentration, the WHAM modelling suggested that this distribution of the Cu form is assessed by a few organic ligands, which can be oversaturated when increasing the Cu concentration (e.g., during a pollution event). Fur-thermore, these Cu organic complexes appear to be weak (in terms of binding strength) because they are dissociated by DGT and electro-chemically reducible by DPASV at−0.9 V; therefore, they are poten-tially bioavailable for organisms.
With the optimised percentages of active DOM (i.e., 2%, 13% and 16% for Sites 1, 2 and 3, respectively), the Cu2+concentrations predicted by WHAM are 1–3 orders of magnitude less than the Cu2+
concentrations measured using the ISE. Several other studies that have compared the WHAM-predicted and measured Cu2+ concentrations have also ob-served a poor agreement and a predicted stronger binding of DOC to Cu (Nolan et al., 2003). Despite this poor agreement, the WHAM suc-cessfully predicts the relative daily variation of Cu2+measured using the ISE. Indeed, the WHAM-predicted values vary by 0.4–1.7 log units on a daily basis, and the measured ones vary by 0.4–1.6 log units (data not shown). This daily variation could be explained as a decrease in photosynthetic activity at night that leads to an acidification of the water and consequently to an increase of the Cu2+ concentration (Superville et al., 2011).
4.2. Comparison of biological responses, chemical measurements and modelling
A principal component analysis (PCA) was performed to determine the variables that explain the majority of the data variability and to evaluate the contribution of each variable (Fig. 5). Axis 1 reflects the ionic and DOC gradient, whereas axis 2 reflects the copper concentra-tion. Axes 1 and 2 account for 49% and 34%, respectively, of the total variance. The PCA revealed that the bioaccumulation of copper in mosses is highly correlated with the copper concentration (either total dissolved, DGT-labile, inorganic or predicted with BioMet-BLM) and less so with the chemical parameters of water.
With respect to the bioaccumulation, the PCA indicated that bryophytes display a high sensitivity to the dissolved concentration of Cu and its speciation and, to a lesser extent, to physico-chemical charac-teristics (Fig. 5). In contrast, the oxidative stress measured in the mosses via their GPX activity did not reveal a strong influence of the Cu con-centration, but it is inversely correlated with the gradient of ions and DOC. In comparison to the waters from Sites 2 and 3, the water from Site 1 has very low ionic concentrations. Nutrient deficiencies may lead to oxidative stress in terrestrial plants (Tewari et al., 2004), notably in the case of Mg (Anza et al., 2005; Tewari et al., 2006), but this has not yet been described for aquatic plants. To investigate whether any nutri-ent deficiency resulted from exposure to the Site 1 water, a growth test was conducted. The size of the green tips was followed during a 40 day exposure in unspiked waters from Sites 1, 2 and 3. After 40 days, the growth rate was 30% on average, but no significant size difference was observed between the three exposure waters. This result suggests that no deficiency occurred, but the hypothesis of an oxidative stress resulting from the low concentration of Mg in the water from Site 1 re-mains to be investigated in the moss becauseChou et al. (2011)observed an oxidative stress in rice submitted to a Mg deprivation for 12 days without altering the plant growth. However, in the present study, we observed that the GPX activity only increased in the water from Site 1 spiked with 15μg L−1and not the other two groups. In this condition, the internalised Cu reached maximal values (113.4μg gdw−1), which suggests a threshold effect of Cuinton the GPX activity.
4.3. Effect of the ionic gradient and DOC on copper uptake
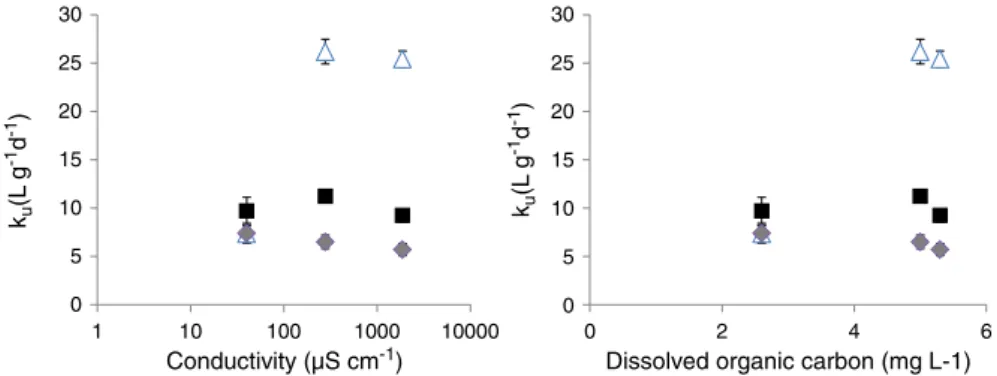
Because the DOC and ions displayed similar gradients among the exposure waters, the PCA did not allow the effect of the DOC to be distinguished from the effect of the ions. However, a primary objec-tive of this study was to investigate how the speciation of Cu (driven by DOC) and competing processes (depending on the concentrations of ions) affect bioaccumulation. To accurately distinguish the effect of the ionic gradient from the effect of the DOC gradient, the results were expressed as uptake rate constants (ku) (Fig. 6), as explained in the details ofBourgeault et al. (2012). Briefly, the uptake rate con-stant (L g−1d−1) is calculated as the slope of Cu influx (which is the copper content in organisms at the end of the exposure divided by the exposure time) (μg g−1d−1) vs. the exposure concentrations of Cu (μg L−1). Expressing the results as k
u allows a comparison of the bioaccumulation measurements in the 3 sites while ignoring that the Cu concentrations are not precisely similar, and also allows the kuvalues to be calculated from various Cu fractions (e.g., total dissolved, inorganic or labile fraction). Therefore, the effect of DOC
Cu Tot Cu DGT pH T°C Ca Mg Na DOC BB Cu BioMet Cl SO4 K DIC Cu in Cu in+w Cu in+w+s GPX Cu2+ -1 -0,75 -0,5 -0,25 0 0,25 0,5 0,75 1 F1 (48.72 %) S1-Cu0 S1-Cu5 S1-Cu15 S2-Cu0 S2-Cu5 S2-Cu15 S3-Cu0 S3-Cu5 S3-Cu15 -3 -2 -1 0 1 2 3 4 5 -7 -6 -5 -4 -3 -2 -1 0 1 2 3 4 5 6 F2 (34.51 %) F1 (48.72 %) -1.00 -0.75 -0.50 -0,25 0.00 0.25 0.50 0.75 1.00
Fig. 5. PCA plot of chemical and biological responses measured after exposures from Site 1 (S1), Site 2 (S2) and Site 3 (S3). BB: Bioaccumulation Bryophytes, DOC: dissolved organic carbon, DIC: dissolved inorganic carbon. in: inorganic, w: weak complexes, s: strong complexes, tot: total, BioMet: predicted by BioMet BLM model.
can be indirectly assessed by calculating kufrom these different Cu fractions.
The uptake rate constant was not calculated for the gammarids because the accumulation was not significant along the Cu gradient. For the mosses, when the kuvalues were calculated from the total dissolved Cu concentration or the DGT-labile Cu concentration, no significant differences were observed along either the DOC gradient or the ionic gradient (Fig. 6). In contrast, when kuwas calculated from the inorganic copper concentration (i.e., the DPASV concentration measured at−0.3 V), the results widely varied. This variation in the results can be attributed to the bioavailability of weak DOC-complexes of copper that are not considered when the kuvalues are calculated from the inorganic Cu concentrations, which leads to higher kuvalues. Some studies have also reported that organisms can access weakly complexed Cu (Meylan et al., 2004b; Ferreira et al., 2008; Ytreberg et al., 2011). Note that the kuvalues are similar for Site 1 (i.e., the values at low DOC concentrations) regardless of the Cu fraction considered because >80% of Cu is inorganic in this exposure water (Fig. 2). When the kuvalues were plotted with the ionic concentration on the X-axis, the same pattern was observed as that for the DOC concentration on the X-axis (Fig. 6). No additional decrease of Cu uptake was observed as the ionic concentration increased, which indicates that no competi-tion process occurs. Therefore, thanks to a full characterisacompeti-tion of Cu speciation, it appears that the uptake is controlled more by organic copper complexation than through competition by major ions.
4.4. A potential effect of moss physiology on copper accumulation? A previous study has shown that bioaccumulation in mosses is governed by ionic competition for membrane ligands, and the impact has been modelled using a two-compartment model calibrated under a wide range of water compositions (Ferreira et al., 2009, in press). However, in the present study, the copper bioavailability appears to be controlled more by organic complexation than major competing ions. Similarly, Peters et al. (2009, 2011)mentioned that calcium have less influence on Cu toxicity, and thus on the overall result of the BLM, than either pH or DOC. As a result, the bioaccumulation model described byFerreira et al. (in press)did not succeed to predict the Cu content measured in the present study in mosses (Fig. S4). The predicted Cu accumulation in mosses is overestimated by a factor 2 to 75. This observation is quite surprisingly since similar exposure design was used. This poor predictive capacity of the model can be attributed to a difference in Cu (i) adsorption/desorption or (ii) internalisation/elimination capacities among seasons (see below). Indeed, the model described byFerreira et al. (in press)was validated in thefield in winter whereas the present study was conducted in sum-mer. As noticed byVazquez et al. (1999), the physiological characteris-tics of mosses (i.e. external binding sites and detoxification potency) are probably subject to seasonal modification.
We further investigated the physiological processes (either adsorption/desorption or internalisation/elimination) at the root of accumulation changes. In Ferreira et al. (in press) model, the internalisation/elimination processes, formalised as the ratio of an internalisation rate constant and an elimination rate constant, is constant and can be assess through the intra/extra-cellular distribu-tion. In the present study, this intra/extra-cellular distribution is actually fairly constant when mosses are exposed to 5–20 μg L−1of copper and is comparable to the one reported by Ferreira et al. (in press)(Fig. S5). Thus, the overestimation of Cu accumulation by the model for the exposures at 5–20 μg L−1could not be explained by a seasonal effect on internalisation/elimination processes. Never-theless, it can be observed that the intra/extra ratio decreased when the exposure concentration was less than 5μg L−1(Fig. S5), which suggests a poorer predictive capacity of the model for low Cu con-centrations because the model considers that the ratio is constant regardless of the concentration. Nonetheless, as the poor predictive capacity of the model cannot be attributed to internalisation/elimination processes (at least for 5–20 μg L−1exposure concentrations), the season likely modifies the adsorption/desorption processes by acting on extra cellular binding sites of the biological membrane. We are utilising a rela-tively small data set. It is likely that the inferred hypothesis could be validated from experiments that cover the entire life cycle of mosses.
The present study emphasises the major role of speciation on the bioavailability of Cu in natural waters and supports the incorporation of BLM-BioMet into regulations. However, it is also of considerable importance to consider the biological behaviour of organisms. Indeed, differences in the metal uptake capacity of aquatic organisms can be observed among different seasons (resulting either from physiologi-cal modification and/or from the physico-chemical characteristics of water systems evolution). A modification of the organisms' physiolo-gy can also occur (Vazquez et al., 1999; Bourgeault et al., 2010), which is not explicitly considered in the BioMet-BLM. For instance, an increase in the DOC concentration from 0.2 to 1.1 mgC L−1 increases thefiltration rate of freshwater mussels by a factor of 6 and consequently enhances the accumulation of metals (Bourgeault et al., 2010). Furthermore, because Cu speciation is related to the strength of organic binding sites, a seasonal variation of Cu bioavail-ability could also be expected with the seasonal type of DOC. For instance,Luider et al. (2004) have shown that allochthonous natural organic matter (NOM) (terrestrial derived) decreases the Cu bioaccumulation better than autochthonous NOM (algal derived). 5. Conclusions
Chemical speciation and biological responses were analysed in mesocosms to obtain insight into the site-specific bioavailability of copper. The mesocosms allowed organisms to be exposed to different environmental Cu concentrations (natural level and spiked with 5 and 15μg L−1) in the same natural water, which consequently
0 5 10 15 20 25 30 1 10 100 1000 10000 0 5 10 15 20 25 30 0 2 4 6
Conductivity (µS cm-1) Dissolved organic carbon (mg L-1) ku (L g -1d -1) ku (L g -1d -1)
Fig. 6. Uptake rate constant of copper (L g−1d−1) (ku) calculated in moss from the total dissolved copper concentration ( ), the inorganic copper concentration determined using
allowed an accurate estimation of the confounding factors on the uptake of Cu. Aquatic mosses exhibited high enrichment rates that were above the background levels compared to gammarids.
WHAM calculations using the default parameters failed to simu-late the distribution of Cu measured by DPASV. However, a simple adjustment of the percentage of reactive organic matter allows the actual reactivity of dissolved organic ligands present in the studied systems to be obtained. This adaptation appears to be necessary to avoid inaccurate evaluations of metal speciation in novel ecosystems. The DGT and DPASV techniques were demonstrated to be efficient tools for assessing Cu speciation and for providing useful information to understand the uptake processes. Indeed, by determining the uptake rate constants from the DGT or DPASV-Cu concentrations, the results suggest that the major ions exert no significant effect on the bioaccumulation in mosses and that organic complexation accounts for the bioavailability of Cu. Furthermore, weak organic complexes of Cu were identified as being bioavailable for aquatic mosses. To assess the hazard and risk posed by Cu to aquatic organ-isms, BLM appears to be a promising approach for predicting the site-specific bioavailability of Cu. However, to fully validate the predictive capacity of the user-friendly BLM, a study implying seasonal variations should be conducted to assess an eventual effect of the phys-iological state of aquatic organisms. Indeed, the adsorption/desorption process of Cu is likely modified in mosses by the season.
Conflict of interest
There is no conflict of interest. Acknowledgement
The authors thank S. Maestri, H. Salhi, S. Gaillard and V. Landrault for their support infield work and sample analysis.
Appendix A. Supplementary data
Supplementary data to this article can be found online athttp:// dx.doi.org/10.1016/j.scitotenv.2013.01.097.
References
Anza M, Riga P, Garbisu C. Time course of antioxidant responses of Capsicum annuum subjected to progressive magnesium deficiency. Ann Appl Biol 2005;146:123–34. Aravind P, Prasad MNV. Zinc alleviates cadmium-induced oxidative stress in Ceratophyllum
demersum L.: a freefloating freshwater macrophyte. Plant Physiol Biochem 2003;41: 391–7.
Behrens W, Madère R. Malonaldehyde determination in tissues and biologicalfluids by ion-pairing high performance liquid chromatography. Lipids 1991;26:232–6. Bourgeault A, Gourlay-Francé C, Tusseau-Vuillemin MH. Modeling the effect of water
chemistry on the bioaccumulation of waterborne cadmium in zebra mussels. Environ Toxicol Chem 2010;29:2182–9.
Bourgeault A, Gourlay-Francé C, Ayrault S, Tusseau-Vuillemin MH. Bioaccumulation of waterborne Ni in Dreissena polymorpha: a stable isotope experiment to assess the effect of zinc, calcium and dissolved organic material. Environ Toxicol Chem 2012;31:819–27.
Bradford MM. A rapid and sensitive method for the quantification of microgram quantities of protein utilizing the principle of protein–dye binding. Anal Biochem 1976;72: 248–54.
Bravin MN, Garnier C, Lenoble V, Gérard F, Dudal Y, Hinsinger P. Root-induced changes in pH and dissolved organic matter binding capacity affect copper dynamic speciation in the rhizosphere. Geochim Cosmochim Acta 2012;84:256–68.
Campbell PGC, Tessier A, Turner DR. Metal speciation and bioavailability in aquatic systems. John Wiley & Sons; 1995.
Chou TS, Chao YY, Huang WD, Hong CY, Kao CH. Effect of magnesium deficiency on antioxidant status and cadmium toxicity in rice seedlings. J Plant Physiol 2011;168: 1021–30.
Correia AD, Costa MH, Luis OJ, Livingston DR. Age-related changes in antioxidant enzyme activities, fatty acid composition and lipid peroxicdation in whole body Gammarus locusta (Crustacea: Amphipoda). J Exp Mar Biol Ecol 2003;289:83-101.
Craven AM, Aiken GR, Ryan JN. Copper(II) binding by dissolved organic matter: importance of the copper-to-dissolved organic matter ratio and implications for the biotic ligand model. Environ Sci Technol 2012;46:9948–55.
Davison W, Zhang H. In situ speciation measurements of trace components in natural waters using thin-film gels. Nature 1994;367:546–8.
De Schamphelaere KAC, Janssen CR. A biotic ligand model predicting acute copper toxicity for Daphnia magna: the effects of calcium, magnesium, sodium, potassium, and pH. Environ Sci Technol 2002;36:48–54.
Donat JR, Bruland KW. Trace elements in the oceans. Trace elements in natural waters. Boca Raton FL: CRC Press; 1995.
Dwane GC, Tipping E. Testing a humic speciation model by titration of copper-amended natural waters. Environ Int 1998;24:609–16.
Feldmann J, Salaün P, Lombi E. Critical review perspective: elemental speciation analysis methods in environmental chemistry— moving towards methodological integration. Environ Chem 2009;6:275–89.
Ferreira D, Tousset N, Ridame C, Tusseau-Vuillemin MH. More than inorganic copper is bioavailable to aquatic mosses at environmentally relevant concentrations. Environ Toxicol Chem 2008;27:2108–16.
Ferreira D, Ciffroy P, Tusseau-Vuillemein MH, Garnier C, Garnier JM. Modelling exchange kinetics of copper at the water-aquatic moss (Fontinalis antipyretica) interface: influence of water cationic composition (Ca, Mg, Na and pH). Chemosphere 2009;74:1117–24. Ferreira D, Ciffroy P, Tusseau-Vuillemin MH, Bourgeault A, Garnier JM. DGT as surrogate
of biomonitors for predicting the bioavailability of copper in freshwaters: an ex situ validation study. Chemosphere (in press), http://dx.doi:10.1016/j.chemosphere. 2012.10.016.
Geffard A, Queau H, Dedourge O, Biagianti-Risboug S, Geffard O. Influence of biotic and abiotic factors on metallothionein level in Gammarus pulex. Comp Biochem Physiol C 2007;145:632–40.
Lores EM, Snyder RA, Pennock JR. The effect of humic acid on uptake/adsorption of copper by a marine bacterium and two marine ciliates. Chemosphere 1999;38: 293–310.
Louis Y, Cmuk P, Omanović D, Garnier C, Lenoble V, Mounier S, et al. Speciation of trace metals in natural waters: the influence of an adsorbed layer of natural organic mat-ter (NOM) on voltammetric behaviour of copper. Anal Chim Acta 2008;606:37–44. Luider CD, Crusius J, Playle RC, Curtis PJ. Influence of natural organic matter source on copper speciation as demonstrated by Cu binding tofish gills, by ion selective elec-trode, and by DGT gel sampler. Environ Sci Technol 2004;38:2865–72.
Meylan S, Behra R, Sigg L. Accumulation of copper and zinc in periphyton in response to dynamic variations of metal speciation in freshwater. Environ Sci Technol 2003;37: 5204–12.
Meylan S, Odzak N, Behra R, Sigg L. Speciation of copper and zinc in natural freshwater: comparison of voltammetric measurements, diffusive gradients in thinfilms (DGT) and chemical equilibrium models. Anal Chim Acta 2004a;510:91-100.
Meylan S, Behra R, Sigg L. Influence of metal speciation in natural freshwater on bioaccumulation of copper and zinc in periphyton: a microcosm study. Environ Sci Technol 2004b;38:3104–11.
Ng TYT, Chowdhury MJ, Wood CM. Can the biotic ligand model predict cu toxicity across a range of pHs in softwater-acclimated rainbow trout? Environ Sci Technol 2010;44:6263–8.
Nicolau R, Louis Y, Omanović D, Garnier C, Mounier S, Pižeta I. Study of interactions of concentrated marine dissolved organic matter with copper and zinc by pseudopolarography. Anal Chim Acta 2008;618:35–42.
Nolan AL, McLaughlin MJ, Mason SD. Chemical speciation of Zn, Cd, Cu, and Pb in pore waters of agricultural and contaminated soils using Donnan dialysis. Environ Sci Technol 2003;37:90–8.
Omanović D, Garnier C, Louis Y, Lenoble V, Mounier S, Pižeta I. Significance of data treatment and experimental setup on the determination of copper complexing parameters by anodic stripping voltammetry. Anal Chim Acta 2010;664:136–43. Paquin PR, Gorsuch JW, Apte S, Batley GE, Bowles KC, Campbell PGC, et al. The biotic
ligand model: a historical overview. Comp Biochem Physiol C 2002;133:3-35. Parkhurst DL, Appelo CAJ. User guide to PHREEQC (Version 2): a computer program for
speciation, batch-reaction, one-dimensional transport, and inverse geochemical calculations. Investigations. U.S.G.S.W.R; 1999. p. 312.
Peters A, Merrington G, Brown B. Using biotic ligand models to help implement environ-mental quality standards for metals under the Water Framework Directive. Science Report— SC080021/SR7b; 2009. p. 83.
Peters A, Merrington G, De Schamphelaere KAC, Delbeke K. Regulatory consideration of bioavailability for metals: simplification of input parameters for the chronic copper biotic ligand model. Integr Environ Assess Manag 2011;7:437–44.
Priadi C, Bourgeault A, Ayrault S, Gourlay-Francé C, Tusseau-Vuillemin MH. Spatio-temporal variability of solid, total dissolved and labile metal: passive vs discrete sampling evalu-ation in river metal monitoring. J Environ Monit 2011;13:1470–9.
Rachou J, Gagnon C, Sauvé S. Use of an ion-selective electrode for free copper measurements in low salinity and low ionic strength matrices. Environ Chem 2007;4:90–7.
Roy S, Sen CK, Hänninen O. Monitoring polycyclic aromatic hydrocarbons using‘moss bags’: bioaccumulation and responses of antioxidant enzymes in Fontinalis antipyretica Hedw. Chemosphere 1996;32:2305–15.
Say PJ, Whitton BA. Accumulation of heavy-metals by aquatic mosses. 1. Fontinalis antipyretica Hedw. Hydrobiologia 1983;100:245–60.
Siebert A, Bruns I, Krauss GJ, Miersch J, Markert B. The use of the aquatic moss Fontinalis antipyretica L ex Hedw as a bioindicator for heavy metals. Sci Total Environ 1996;177: 137–44.
Superville PJ, Louis Y, Billon G, Prygiel J, Omanovic D, Pizeta I. An adaptable automatic trace metal monitoring system for on line measuring in natural waters. Talanta 2011;87:85–92.
Tewari RK, Kumar P, Tewari N, Srivastava S, Sharma PN. Macronutrient deficiencies and differential antioxidant responses-influence on the activity and expression of superoxide dismutase in maize. Plant Sci 2004;166:687–94.
Tewari RK, Kumar P, Sharma PN. Magnesium deficiency induced oxidative stress and antioxidant responses in mulberry plants. Sci Hortic-Amsterdam 2006;108:7-14. Tipping E. WHAM— a chemical equilibrium model and computer code for waters,
sedi-ments, and soils incorporating a discrete site/electrostatic model of ion-binding by humic substances. Comput Geosci 1994;20:973-1023.
Tipping E, Lofts S, Lawlor AJ. Modelling the chemical speciation of trace metals in the surface waters of the Humber system. Sci Total Environ 1998;210:63–77. Tusseau-Vuillemin M, Gourlay C, Lorgeoux C, Mouchel J, Buzier R, Gilbin R, et al.
Dissolved and bioavailable contaminants in the Seine River basin. Sci Total Environ 2007;375:244–56.
Vasseur P, Cossu-Leguille C. Biomarkers and community indices as complementary tools for environmental safety. Environ Int 2003;28:711–7.
Vazquez MD, Lopez J, Carballeira A. Uptake of heavy metals to the extracellular and intracellular compartments in three species of aquatic bryophyte. Ecotoxicol Envi-ron Saf 1999;44:12–24.
Ytreberg E, Karlsson J, Ndungu K, Hassellöv M, Breitbarth E, Eklund B. Influence of salinity and organic matter on the toxicity of Cu to a brackish water and marine clone of the red macroalga Ceramium tenuicorne. Ecotoxicol Environ Saf 2011;74: 636–42.
Zhong H, Evans D, Wang WX. Uptake of dissolved organic carbon-complexed Cu-65 by the green mussel Perna viridis. Environ Sci Technol 2012;46:2383–90.