Inverse procedure for mechanical characterization of multi-layered non-rigid
1composites parts with applications to the assembly process
2Ngoc-Hung Vu1, Xuan-Tan Pham1*, Vincent François2 and Jean-Christophe Cuillière2 3
Abstract
4
In assembly process, non-rigid parts in free-state may have different shapes compared to the 5
designed model due to geometric variations, gravity load and residual stresses. For non-rigid parts 6
made by multi layered fiber-reinforced thermoplastic composites, the assembly process becomes 7
much more complex due to the nonlinear behavior of the material. This paper presented an inverse 8
procedure for characterizing large anisotropic deformation behavior of four-layered, carbon fiber 9
reinforced polyphenylene sulphide, non-rigid composites parts. Mechanical responses were 10
measured from the standard three points bending test and the surface displacements of composite 11
plates under flexural loading test. An orthotropic hyperelastic material model was implemented in 12
the user-defined material subroutine of Abaqus for finite strain shell elements to analyze the behavior 13
of flexible fiber-reinforced thermoplastic composites. Error functions were defined by subtracting 14
the experimental data from the numerical mechanical responses. Minimizing the error functions 15
helps to identify the material parameters. These material parameters were validated for the case of 16
an eight-layered composite material. 17
Keywords: Finite element method; Finite strain shell element; Anisotropic material model;
Fiber-18
reinforced composites; Assembly process. 19
20 21 22
1. Introduction
23
One important element in the quality control of products is to analyze whether the post-assembly 24
shape fulfills the designer’s geometric specifications. This task is performed by evaluating the 25
component’s shape after having mounted it into the final assembled configuration. Large non-rigid 26
parts in free-state, such as aerospace panels may have deviations from their nominal (CAD) shape 27
caused by geometric variations, gravity load and residual stresses. It makes the assembly process 28
difficult, even impossible when the deviation is out of tolerance. To solve this problem, a non-rigid 29
part must be mounted on special fixtures to simulate the assembly-state. Then, the mismatches 30
between its real geometry and its target nominal geometry are evaluated. This process is usually 31
carried out by using coordinate measuring systems or laser scanners. Figure 1 shows an example of 32
an aerospace panel restrained by known forces (weight) on its inspection fixture before the 33
measurement process. This inspection task is generally laborious and time-consuming. Therefore, 34
there is a great interest in the industry towards developing virtual inspection methods, which can 35
significantly reduce inspection time and cost. 36
37
Figure 1. An aerospace panel restrained by known forces on its inspection fixture [1]
38
Some researchers [2-5] proposed virtual inspection methods based on numerical approaches by 39
building a finite element (FE) model of the non-rigid part considerd in free-state. Boundary 40
conditions were then imposed on this FE model to constrain the part to its working shape. The virtual 41
restrained part was compared to the nominal CAD model to evaluate profile deviation. Obviously, 42
the accuracy of numerical simulation is one of the most important aspects of a virtual inspection 43
process. The deformation of non-rigid parts must be simulated accurately by finite element analysis 44
which requires good material models and an appropriate characterization method for assessing 45
material parameters associated with these models. For a non-rigid composite part, this work becomes 46
highly challenging because of its complicated anisotropic nonlinear behavior. Thin orthotropic 47
materials, such as fiber reinforced composites, can be described by a lamina constitution with four 48
independent in-plane elastic parameters (longitudinal Young’s modulusE1, transverse Young’s 49
modulus E2 , in-plane shear modulus G12 and Poisson’s ratio12 ) [6-8]. However, during its
50
assembly process, a non-rigid part undergoes large deformation, which makes that material 51
constitutive properties change considerably. As a consequence, this model is no longer valid for 52
assembly processes. Instead, hyperelasticity provides a framework for modelling large anisotropic 53
deformation. According to the Lagrangian description, the constitutive properties of the material 54
(stiffness) varies with the gradient of deformation and the anisotropic effect is characterized by the 55
fiber’s reorientation. This framework was successfully used in characterizing the behavior of fiber-56
reinforced composites. Pham et al. [9], Aimene et al. [10], Peng et al. [11] and Gong et al. [12] 57
proposed hyperelastic constitutive material models and demonstrated their suitability for modelling 58
large anisotropic deformation of fiber reinforced composites in manufacturing processes. Therefore, 59
a hyperelastic constitutive model in the form of a strain energy function could be an appropriate 60
approach to characterize the anisotropic behavior of flexible fiber-reinforced thermoplastic 61
composites (FRTPC) during assembly processes. 62
Even if a very well-suited constitutive model is chosen, determining accurate material parameters 63
is also one of the most important prerequisites in order to obtain reliable results from an assembly 64
process simulation. Therefore, parameters of the constitutive model considered must be estimated by 65
the most appropriate method. Simulation-based inverse characterization is a powerful and efficient 66
tool to characterize the mechanical behavior of materials. This procedure is based on an optimization 67
process that minimizes a multi-objective function that expresses discrepancies between experimental 68
data of characterization tests and computed responses for these tests. Here, the computed responses 69
are used as “function evaluation” and the material parameters employed in the numerical model are 70
the variables to be determined in this optimization process. Over the past decades, a number of 71
researchers used the inverse procedure to get the constitutive material behaviors from standard tests 72
such as tensile tests, compression tests, bending tests, torsion tests, etc. [13-18]. However, the 73
deformation fields generated from the standard tests in many cases cannot represent the complex 74
deformation fields of some particular applications. In a previous study [19], the bending properties 75
of multi-layered carbon fiber reinforced polyphenylene sulphide (CF/PPS) were obtained from three-76
point bending tests, but results showed that this approach needs to be improved to better characterize 77
the behavior of non-rigid composite parts during the assembly process. To overcome this problem, 78
non-standard experiments were developed by some researchers to be able to more accurately capture 79
real deformation behaviors. Wang et al. [20] proposed an inverse method to determine elastic 80
constants using a circular aluminum disk. Pagnotta [21] identified the elastic properties of materials 81
from displacements of a thin, simply supported isotropic square plate. Bruno et al. [6] presented a 82
method for identifying the elastic properties of aluminum and unidirectional Graphite/PEEK 83
laminate from measurements of the displacements of plates under loading configurations. It can be 84
seen that the selection of a test type greatly affects the accuracy of characterization. During assembly, 85
the complexity of a non-rigid composite part behavior cannot be well characterized using a single 86
experimental test. Obviously, the combination of results obtained from both standard and non-87
standard tests could lead to a more realistic description of material behavior. 88
In this study, in order to characterize the large bending behavior of multi-layered CF/PPS during 89
the virtual assembly process, an inverse multi-objective optimization process combining standard 90
and specific non-standard tests was developed. Four-layer CF/PPS sheet specimens were used for 91
characterization. Three-point bending tests with two different stacking sequences
0,90 and
4
454 92were performed as the standard method. Flexural loading tests with a large multi-layer composite 93
sheet in different support configurations were carried out as non-standard tests. These non-standard 94
tests were chosen because the deformation state in these tests is close to that in the assembly process. 95
Therefore, the characterized material properties obtained from the combination of experimental data 96
from the three-point bending test and flexural loading tests is more appropriate to represent the 97
behavior of non-rigid composite parts during the assembly process. For the optimization procedure, 98
numerical simulations were performed using an orthotropic hyperelastic shell formulation, which is 99
available in ABAQUS. In this work, the anisotropic hyperelastic material model developed by Vu et 100
al. [19] was used and implemented in ABAQUS as a user-defined material model (UMAT). The 101
material parameters obtained from the inverse characterization procedure were validated for the case 102
of an eight-layered CF/PPS material. 103
2. Experimental work
104
In this study, the thermoplastic composite used for the experimental works was a pre-consolidated 105
plate of 4 layers of CF/PPS commercialized by Royal Tencate Corp. In each layer, a polyphenylene 106
sulphide (PPS) matrix was reinforced by two orthogonal families of carbon fiber (CF). The fiber 107
volume fraction (Vf) was of 50%. The total thickness of the four-layer laminate was approximately 108
1.24 mm (0.31 mm / layer). 109
2.1 Three-point bending test
110
Specimens with two different stacking sequences
0,90 and
4
45 4 with dimensions 300 mm × 11134 mm × 1.24 mm were used for the three-point bending test. The tests were performed on the MTS 112
testing machine. Table 1 shows the test parameters. Each specimen (5 pieces for each stacking 113
sequence) was supported on two rollers and loaded in its center with displacement control (Figure 114
2). The applied force and the displacement at the center of the specimen were then recorded. 115
116
Figure 2. (a) Test specimens and (b) three point bending test using the MTS machine.
117 118 119 120 121 122 123 124
Table 1. Test parameters
Parameters Value
Specimen dimensions 300 mm × 34 mm × 1.24 mm
Support span 140 mm
Velocity 4 mm/min
Max displacement at center
of support span 20 mm
Radius of loading noses and
supports 25 mm
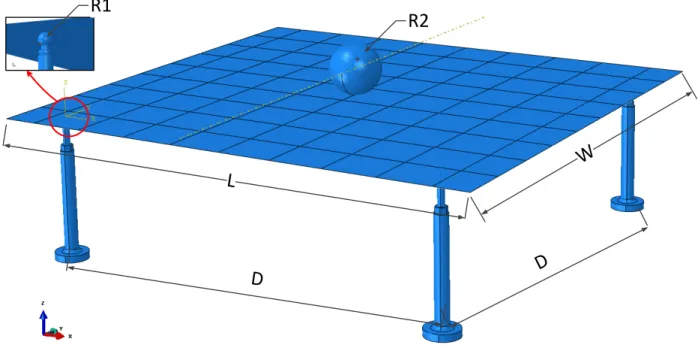
2.2 Flexural loading test
126
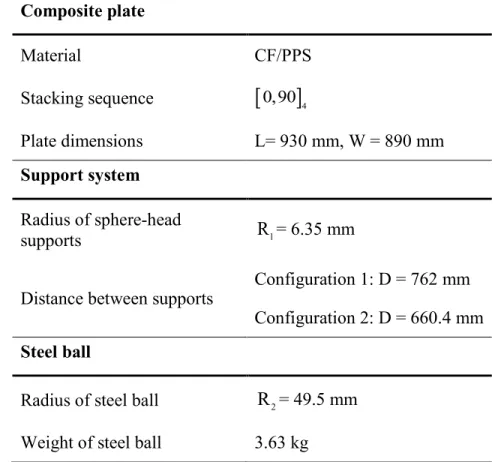
Figure 3 shows a schematic of the flexural loading test used. A plate with dimensions 930 mm × 127
890 mm was supported by a system of four rigid spherical-head supports. Two different 128
configurations of support systems were used in this test. This plate then underwent bending 129
deformation imposed by a 3.63 kg ball applied at its center point. Table 2 summarizes experimental 130 parameters. 131
D
D
L
W
R2
R1
132Figure 3. Flexural loading test schematic
133 134
Table 2. Experimental parameters 135 Composite plate Material CF/PPS Stacking sequence
0,90
4 Plate dimensions L= 930 mm, W = 890 mm Support system Radius of sphere-head supports R1= 6.35 mmDistance between supports Configuration 1: D = 762 mm Configuration 2: D = 660.4 mm
Steel ball
Radius of steel ball R2= 49.5 mm
Weight of steel ball 3.63 kg
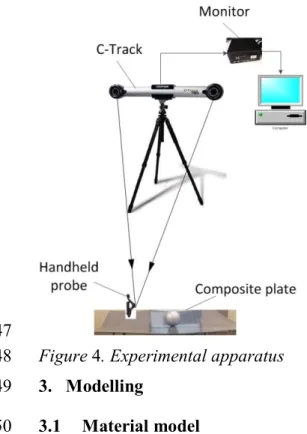
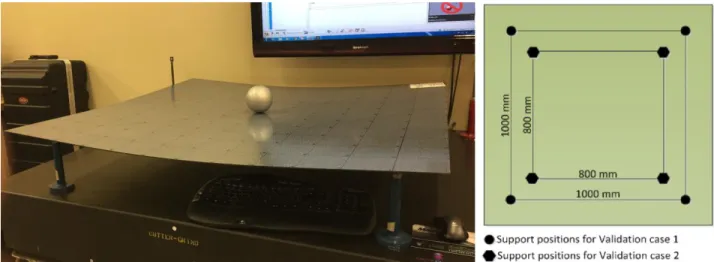
By using a Creaform HandyPROBE device, the displacement of the plate was measured at 110 points 136
on the plate surface. Three measurements were performed for each support configuration to get 137
average values. The HandyPROBE device consists of a tracking system equipped with a C-track and 138
a handheld probe as shown in Figure 4. The triangulation obtained from two video cameras on the 139
C-track device and the retroreflective target of the handheld probe were used to calculate the 140
coordinates of each point. 141
The accuracy of the measurement is limited by uncertainty of the support system as well as the 142
measurement process. In this work, uncertainty of the support system is approximately ±0.03 mm 143
and ±0.02 mm for Configuration 1 and Configuration 2, while uncertainty of the measurement 144
process is up to ±0.2 mm. 145
147
Figure 4. Experimental apparatus
148
3. Modelling
149
3.1 Material model
150
The hyperelasticity modeling concept is based on the existence of a strain energy function using 151
the Lagrangian variables, which are appropriate for the description of large deformations. The 152
mechanical behavior of a thermoplastic reinforced by two families of fiber can be represented by a 153
strain energy function of the right Cauchy-Green deformation tensor C F F T and the initial fiber
154
directional unit vectors a0 and g0: 155
0 0
Ψ Ψ , , C a g (1)
156 157
where F x X is the deformation gradient. / Xrepresents the position vector of each point of the 158
solid body in the reference configuration, andxrepresents the position vector of the corresponding
159
point in the current configuration. For an orthotropic hyperelastic model, the initial directions of the 160
two fibers are orthogonal, i.e. a g0 0 and the strain energy function in Equation (1) can be written 161
in terms of invariants of C as:
162
1 2 3 4 6
Ψ Ψ , , , , I I I I I (2)
where
2
2
1 2 3 4 0 0 2 6 0 0 2 1 tr , tr tr , det , . , . 2 C C C C a Ca a g gC g I I I I I . Here, 164 2 aand 2g are the square of the stretching of fibers along their initial directions a0 and g0.
165
The second Piola-Kirchhoff stress tensor is derived directly from the hyperelastic strain energy 166
function and given by: 167 6 1 2 4 1 2 4 6 Ψ 2 2 S C C C C C I I I I (3) 168 where 1 1 Ψ I , 2 2 Ψ I , 4 4 Ψ I , 6 6 Ψ I . 169
The Cauchy stress tensor can be simply obtained by: 170 T 3 1 I σ FSF . (4) 171
The mechanical response of CF/PPS material used in this study is represented by an orthotropic 172
incompressible hyperelastic model proposed by Vu et al. [19]. Its strain energy function has the 173 following form: 174
2 4 12 4 6 12
1 1 2 2 3 1 2 1 3 3 1 Ψ 3 3 3 3 e 1 e 1 1 2 k I k I M I M I M I I k k p I (5) 175where M1, M2, M3, k1, k2, k3, k4are the material parameters. Please refer to reference [19] for 176
more details. 177
3.2 Computational experiment
178
The numerical simulations corresponding to the three-point bending test and flexural loading test 179
presented in the previous section were performed using the commercial FE package 180
Abaqus/Standard. Four-node shell elements (S4R) with a four layer composite section were used to 181
model the specimens. Each layer behaves like an orthotropic material characterized by the 182
constitutive model of Equation (5). A frictionless contact between the support system and the 183
specimen was defined for both tests. For the flexural loading test, a 35.59 N concentrated force, 184
which is equivalent to the weight of the steel ball, is set on the center point of the plate. The 185
computational models for the three-point bending test and flexural loading test are depicted in Figure 186 5. 187 188 189
Figure 5. Computational models: (a) Three-point bending test, (b) Flexural loading test
190
4. Identification of constant material parameters
191
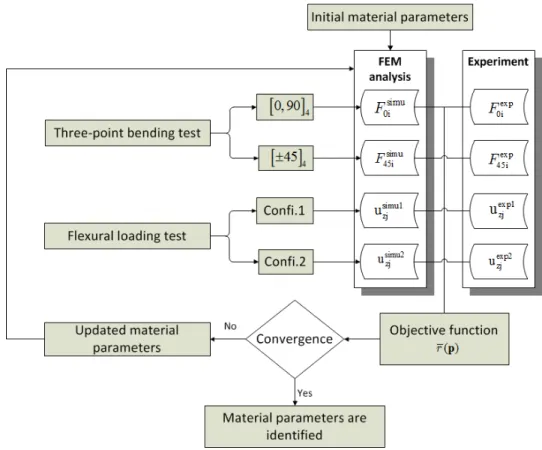
192
Figure 6. Inverse characterization flowchart
The material parameters M1, M2, M3, k1, k2, k3, k4 of the strain energy function in Equation (5 194
) for multi-layered carbon fiber reinforced material are identified by minimizing objective functions 195
that represent discrepancy between experimental test data and numerical simulation results. The 196
updated material parameters were performed with the Global Response Surface Method for multi-197
objective optimization. As presented in (equation 6?) Figure 6, the difference of loads between 198
experimental data and numerical results was taken into account for building the objective function 199
associated with the three-point bending test while vertical plate displacements were used to build the 200
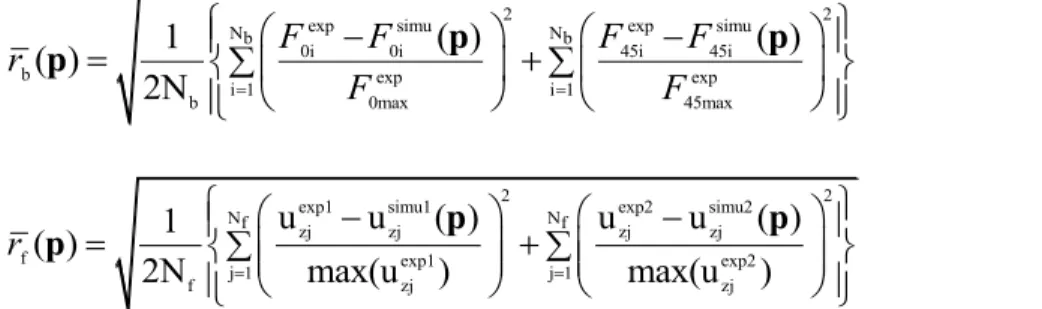
objective function associated with the flexural loading test. These objective functions are as follows: 201
2 2
exp simu exp simu
Nb Nb 0i 0i 45i 45i b i 1 exp i 1 exp b 0max 45max ( 1 ( ) 2N ) ( ) p p p F F F F r F F (6) 202 2 2
exp1 simu1 exp2 simu2
Nf zj zj Nf zj zj f j 1 exp1 j 1 exp2 f zj zj u u u u 1 ( ) 2N max( ( ) ( ) ) ) u max(u p p p r (7) 203
Herein, p is the list of unknown parameters. The relative error values rb( )p and rf( )p represent the
204
objective functions of the three-point bending test and flexural loading test respectively. Nb is the 205
number of displacement steps at which loads were measured in the three-point bending test. exp 0i F and 206
simu 0i
F represent the experimental and computed loads respectively at step i for the stacking sequence 207
0,90 .
4 exp 45i F and simu 45iF represent the experimental and computed loads respectively at step i for the 208
stacking sequence
45 4. Nf is the number of measured points on the plate surface in the flexural 209loading test. exp1 zj
u and simu1 zj
u denote the experimental and numerical vertical displacements at point j 210
for Configuration 1. exp2 zj
u and simu2 zj
u denote the experimental and numerical vertical displacements 211
at point j for Configuration 2. 212
Convergence criterion is set to be reached when the updated parameter values are (difference ?) 213
inferior to 0.5% of actual parameter values. The iterative process ended after 11 steps of the updating 214
process. Table 3 shows the converged parameter values. 215
Table 3. Optimized parameter values
1
M (MPa) M2 (MPa) M3 (MPa) k1 (MPa) k2 k3 (MPa) k4
703.3 915.0 512.0 1131.0 46.2 1131.0 46.2
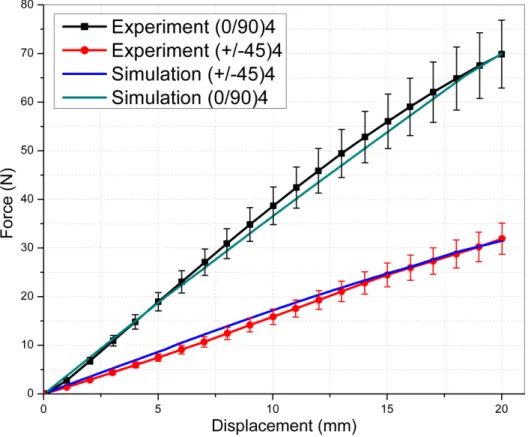
Good agreement was found between experimental and computed loads associated with the three-217
point bending test versus displacement for the optimized parameters set (Figure 7). With the small 218
value of relative errors rb( )p = 0.0173, it turned out that the inverse procedure leads to a good fit 219
between experimental and numerical loads. 220
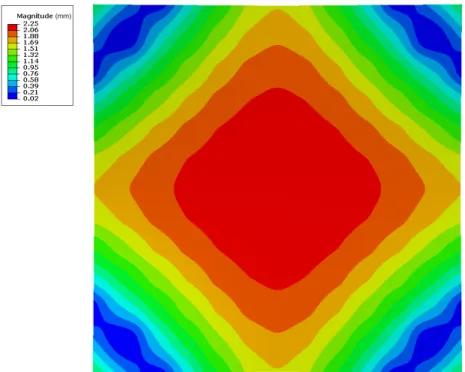
Figure 8 and Figure 9 show the residual difference between measured and calculated vertical 221
displacement of composite plate for flexural loading tests. The average differences between 222
experimental and numerical results were found to be 1.53 mm for Configuration 1, and 0.88 mm for 223
Configuration 2. The relative error rf( )p is 0.056. It demonstrated that a good match of the calculated 224
and the measured vertical displacement was achieved as well for the flexural loading test. 225
226
Figure 7 Comparison between numerical results and experimental data for three-point bending test
228
Figure 8. Residual difference between measured and calculated vertical displacement for
229
Configuration 1
230
231
Figure 9. Residual difference between measured and calculated vertical displacement for
232
Configuration 2
5. Validation of material model
234
In this study, the material used for validating the material model is a consolidated plate of eight 235
layers of CF/PPS with 2.48 mm thickness (0.31 mm/layer). The stacking sequence of plates is 236
(0,90) / 45/ 45/ (0,90)
s. The flexural loading test for this plate of eight-layer laminate was 237performed using the same experimental set up as that used for the four-layer laminate in the previous 238
section. Dimensions of the plate were 1200 mm x 1200 mm x 2.48 mm. Two validation cases with 239
two different configurations were performed in this work (see Figure 10). Vertical displacement was 240
measured at 169 points on the plate surface. 241
242
Figure 10. Validation test
243 244
A FEA simulation procedure with Abaqus was applied to compute vertical plate displacements. The 245
material parameters obtained from the inverse characterization procedure were used to simulate the 246
deformation of this composite plate. 247
Figure 11 and Figure 12 show the residual difference between measured and calculated vertical 248
displacement of the composite plate for these two validation cases. The average difference between 249
experimental and numerical results was found to be 1.42 mm and 0.55 mm respectively for validation 250
case 1 and case 2. Small relative errors obtained (r1= 0.0582 for validation case 1 and r2= 0.0283
251
for validation case 2 demonstrated that the material model used here is appropriate for assessing the 252
mechanical behavior of this multilayered composite and that the identification procedure developed 253
in this paper is suitable for the characterization of this composite material. 254
255
Figure 11. Residual difference between measured and calculated vertical displacement for
256
Validation case 1
257
Figure 12 Residual difference between measured and calculated vertical displacement for 259 Validation case 2 260 261 6. Conclusion 262
In this paper, an inverse procedure was developed for characterizing the large bending 263
deformation behavior of four layers of CF/PPS material. A three-point bending test with two different 264
stacking sequences and a flexural loading test with two different configurations for boundary 265
conditions were performed to study the mechanical responses. FEA modelling was performed using 266
the Abaqus/Standard commercial FE package based on an orthotropic hyperelastic model for finite 267
strain shell elements. Material parameters associated with this hyperelastic model were identified by 268
minimizing discrepancy between experimental and numerical data. The material model parameters 269
obtained from the inverse characterization were validated for the case of an eight-layer CF/PPS 270
material. Results showed that the proposed method is appropriate for characterizing the behavior of 271
multi-layered composites in large deformation. The method presented in this paper can be applied 272
to characterize and simulate the large anisotropic deformation behavior of non-rigid composite parts 273
during the virtual assembly process. 274
Acknowledgments
275
The authors would like to thank the National Sciences and Engineering Research Council (NSERC) 276
and our industrial partner: Bombardier Aerospace, Consortium for Aerospace Research and 277
Innovation in Québec (CRIAQ) for their support and financial contribution. 278 279 280 281 282 283 284 285
References
286
1. Aidibe, A., Tahan, A.: Adapting the coherent point drift algorithm to the fixtureless 287
dimensional inspection of compliant parts. The International Journal of Advanced 288
Manufacturing Technology 79(5), 831-841 (2015). doi:10.1007/s00170-015-6832-9. 289
2. Aidibe, A., Tahan, A.S., Abenhaim, G.N.: Distinguishing profile deviations from a part’s 290
deformation using the maximum normed residual test. Wseas Transaction on Applied and 291
Theorical Mechanics 7(1), 18-28 (2012). 292
3. Abenhaim, G.N., Tahan, A.S., Desrochers, A., Maranzana, R.: A Novel Approach for the 293
Inspection of Flexible Parts Without the Use of Special Fixtures. Journal of Manufacturing 294
Science and Engineering 133(1), 011009-011009-011011 (2011). doi:10.1115/1.4003335. 295
4. Gentilini I and Shimada K. Predicting and evaluating the post-assembly shape of thin-walled 296
components via 3D laser digitization and FEA simulation of the assembly process. Computer-297
Aided Design 2011; 43: 316-328. DOI: 10.1016/j.cad.2010.11.004. 298
5. Weckenmann, A., Weickmann, J.: Optical inspection of formed sheet metal parts applying 299
fringe projection systems and virtual fixation. Metrology and Measurement Systems Vol. 13, 300
nr 4, 321-334 (2006). 301
6. Bruno L, Felice G, Pagnotta L, et al. Elastic characterization of orthotropic plates of any shape 302
via static testing. International Journal of Solids and Structures 2008; 45: 908-920. DOI: 303
10.1016/j.ijsolstr.2007.09.017. 304
7. Genovese K, Lamberti L and Pappalettere C. A new hybrid technique for in-plane 305
characterization of orthotropic materials. Experimental Mechanics 2004; 44: 584-592. DOI: 306
10.1007/BF02428248. 307
8. Wang WT and Kam TY. Material characterization of laminated composite plates via static 308
testing. Composite Structures 2000; 50: 347-352. DOI: https://doi.org/10.1016/S0263-309
8223(00)00112-4. 310
9. Pham X-T, Bates P and Chesney A. Modeling of Thermoforming of Low-density Glass Mat 311
Thermoplastic. J. Reinf. Plast. Compos. 2005; 24: 287-298. 312
10. Aimène Y, Vidal-Sallé E, Hagège B, et al. A Hyperelastic Approach for Composite 313
Reinforcement Large Deformation Analysis. Journal of Composite Materials 2009; 44: 5-26. 314
11. Peng X, Guo Z, Du T, et al. A simple anisotropic hyperelastic constitutive model for textile 315
fabrics with application to forming simulation. Composites Part B: Engineering 2013; 52: 275-316
281. 317
12. Gong Y, Peng X, Yao Y, Guo Z. An anisotropic hyperelastic constitutive model for 318
thermoplastic woven composite prepregs. Compos. Sci. Technol. 2016;128:17-24. 319
13. Kajberg J and Lindkvist G. Characterisation of materials subjected to large strains by inverse 320
modelling based on in-plane displacement fields. International Journal of Solids and Structures 321
2004; 41: 3439-3459. DOI: https://doi.org/10.1016/j.ijsolstr.2004.02.021. 322
14. Lecompte D, Smits A, Sol H, et al. Mixed numerical–experimental technique for orthotropic 323
parameter identification using biaxial tensile tests on cruciform specimens. International 324
Journal of Solids and Structures 2007; 44: 1643-1656. DOI: 325
https://doi.org/10.1016/j.ijsolstr.2006.06.050. 326
15. Belhabib S, Haddadi H, Gaspérini M, et al. Heterogeneous tensile test on elastoplastic metallic 327
sheets: Comparison between FEM simulations and full-field strain measurements. 328
International Journal of Mechanical Sciences 2008; 50: 14-21. DOI: 329
https://doi.org/10.1016/j.ijmecsci.2007.05.009. 330
16. Guélon T, Toussaint E, Le Cam JB, et al. A new characterisation method for rubber. Polymer 331
Testing 2009; 28: 715-723. DOI: https://doi.org/10.1016/j.polymertesting.2009.06.001. 332
17. Liu H, Shen Y, Yang S, et al. A comprehensive solution to miniaturized tensile testing: 333
Specimen geometry optimization and extraction of constitutive behaviors using inverse FEM 334
procedure. Fusion Engineering and Design 2017; 121: 188-197. DOI: 335
10.1016/j.fusengdes.2017.07.016. 336
18. Cooreman S, Lecompte D, Sol H, et al. Identification of Mechanical Material Behavior 337
Through Inverse Modeling and DIC. Experimental Mechanics 2007; 48: 421-433. DOI: 338
10.1007/s11340-007-9094-0. 339
19. Vu N-H, Pham X-T, François V, et al. Characterization of multilayered carbon-fiber– 340
reinforced thermoplastic composites for assembly process. Journal of Thermoplastic 341
Composite Materials 2018: 0892705718772878. DOI: 10.1177/0892705718772878. 342
20. Wang Z, Cárdenas-García JF and Han B. Inverse method to determine elastic constants using 343
a circular disk and moiré interferometry. Experimental Mechanics 2005; 45: 27-34. DOI: 344
10.1007/BF02428987. 345
21. Pagnotta L. Determining elastic constants of materials with interferometric techniques. Inverse 346
Problems in Science and Engineering 2006; 14: 801-818. DOI: 10.1080/17415970600838806. 347