Abstract— Although Lithium Ion batteries have penetrated the hybrid electric vehicles and pure electric vehicles; they suffer from significant power capability losses and reduced energy at low temperatures. In order to evaluate those losses and to make an efficient design, good models are required for system simulation. Sub-zero battery operation involves non classical thermal behavior. Consequently, simple electrical models are not sufficient to predict bad performance or damage to systems involving batteries at sub-zero temperatures. This paper presents the development of an electrical and thermal model of a hybrid electrical vehicle (HEV) lithium-ion battery pack. This model has been developed with MATLAB/Simulink® in order to investigate the output characteristics of lithium-ion batteries over the selected operating range of currents and battery capacities. In addition, a thermal modeling method has been developed for this model so that it can predict the battery core and crust temperature by including the effect of internal resistance. First, various discharge tests on one cell are carried out, and then cell’s parameters and thermal characteristics are obtained. The single cell model proposed is shown to be accurate by analyzing the simulation data and test results. Next, real working conditions tests are performed and simulation calculations on one cell are presented. In the end, the simulation results of a battery pack under HEV driving cycle conditions show that the characteristics of the proposed model allow a good comparison with data from an actual lithium-ion battery pack used in a HEV.
Index Terms— Lithium - ion battery, Hybrid vehicles, temperature effect, self-heating process.
I. INTRODUCTION
n recent years, hybrid electric vehicle (HEV) and electric vehicle (EV) technologies are considered to be one of the most promising solutions to cope with environmental and energy problems caused by the automotive industry. In particular, plug-in HEV and vehicle-to-grid concepts have assumed a prominent role in both industry and academic research due to their potential impacts on the reduction of greenhouse gases and electricity distribution systems. A key element to the success of this system is the battery technology. Among the major candidates for EV/HEV batteries, the specific energy and energy density of li-ion batteries have made them the first choice for EVs and HEVs. Even though they have been
broadly established in automotive products, the HEV/EV market is limited by technical barriers such as their safety [1, 2], cost issues [3] and recycling issues [4]. Above all, one other issue remains significant: the batteries’ reduced energy and power densities at low temperatures [5].
On the whole, at sub-zero temperatures, Li-ion batteries or other technologies lose their performances. As an illustration, in [6] the authors compare the thermal effect on the three energy storage devices being considered in the HEV/EV industry: lead-acid, lithium-ion and NiMH. As a conclusion, even if NiMh appears to have a lower sensitivity to ambient temperatures, lithium-ion remains the greatest potential for HEV/EV due to its longer life and power-to-energy ratio [7].
Generally, a drop in ambient temperature implies a significant rise of the internal resistance of the cell creating a high opposing force while operating the battery. Thereby, it limits the amount of energy extracted and reduces cell energy and power capability. For example, at -20° only 50% of the battery energy is available [8].
Hence, operating HEVs/VEs at low temperatures becomes a serious issue in countries such as Canada, Russia or Scandinavian countries where the temperature during winter plummets under -20°C and lasts for at least four to six months.
Some strategies exist to tackle that issue [9-13]. For instance, some of them [9, 10] consist of warming up the cell before use with an external heating system powered either by an external source or mostly by the battery itself. Therefore, it induces a remarkable temperature rise of the cell, implying a decreased internal resistance [5] thereby it restores cell performances. As a consequence, these strategies imply a new thermal management of the battery system in any HEV/EV in order to consider the low temperature effect.
At the end, since all these challenges are related to thermal effects on the battery system, a proper way to establish a new battery thermal management starts with the conception of a thorough battery model.
Experimental results show an important interaction between the electrical and thermal phenomena. However, some models do not consider the temperature effect on the internal resistance of the battery [14, 15, 19] or the range of the battery cell temperature modeled does not fit hard winter applications [14, 16, 20-21] where low temperatures (-15, -20°C) are in order. In addition, some models only reproduce low capacity battery behaviors [15-18] and then are not suitable for HEV/EV
Characterization and Modeling of a Hybrid
Electric Vehicle Lithium – Ion Battery Pack at
Low Temperatures
J. Jaguemont, L. Boulon, and Y. Dubé.
I
POSTPRINT VERSION. The final version is published here:
Jaguemont, J., Boulon, L., & Dubé, Y. (2016). Characterization and modeling of a hybrid-electric-vehicle lithium-ion battery pack at low temperatures. IEEE Transactions on Vehicular Technology, 65(1), 1-14. http://dx.doi.org/10.1109/TVT.2015.2391053
© 2016 IEEE. Personal use of this material is permitted. Permission from IEEE must be obtained for all other uses, in any current or future media, including reprinting/republishing this material for advertising or promotional purposes, creating new collective works, for resale or redistribution to servers or lists, or reuse of any copyrighted component of this work in other works.
applications where a large battery is required. A more accurate electro-thermal model can be obtained by considering the impacts of these significant statements quoted above.
Therefore, the objective of this paper is to propose an effective lithium ion battery model appropriate for HEV thermal management. The main objective of this model is to simulate and replicate the behavior of a HEV Li-ion battery in a cold environment for future thermal optimizations. Simulations are used to check the performance of the developed lithium-ion battery model. First, the model is validated by comparing it with experimental data obtained from various discharge tests on an actual battery used in a HEV tested for Canadian winter temperatures. Then, the model is tested under representative driving cycle tests performed on one HEV cell. Finally, the output voltage and thermal characteristics of a lithium-ion battery pack over genuine working conditions are studied and analyzed, which provides the theoretical support for Battery Thermal Management System (BTMS) design.
The rest of this paper is structured as follows: Section II presents the experimental setup and the results associated with it. Section III describes the electrical and thermal models, respectively. Section IV shows the extracted parameters needed for the model. Section V discusses the results of simulations carried out to observe the changes in battery output characteristics under different discharging cycles, and temperatures. Section VI presents the studies on performance of a single cell and lithium-ion battery pack, respectively, in HEV under various working conditions. Finally, conclusions are given in Section VII.
II. EXPERIMENTAL SETUP
This section describes the experimental setup in order to obtain the data required for the characterization and validation of the model.
A. Battery feature
The tested cell in this paper is a 3.3V / 100Ah rectangular LiFePO4 cell, with a working voltage between 2.5V and 3.8V. B. Experimental Test bench
All the tests were carried out using the test set-up shown in Fig. 1. The cell under test is placed into a climatic chamber in order to recreate the cold environment climate. The temperature inside the chamber is regulated by liquid Nitrogen and controlled by a PC interface. A power supply (TSSerieIV 15kW) drives the current flowing in the cell (up to 150 A). As far as the cell discharge is concerned, an electronic load Dynaload XBL 12kW is used and controlled with a National Instruments NI PCIe-6323 DAQ. The same DAQ reads the analog output of the TSSerieIV and also senses the temperature probes of the cell through two thermocouples SA1-K-SRTC displayed along the length of the cell. Software developed with LabVIEW2010 controls all the equipment.
Fig. 1. Experimental test bench. C. Measurement system
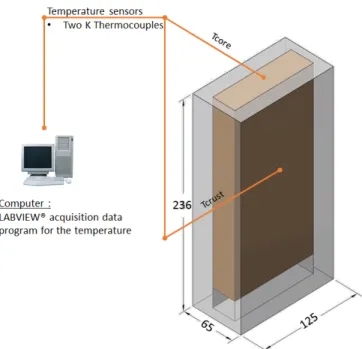
Two thermocouples are installed on the battery to monitor the temperature of the cell’s core, Tcore, and the crust of the cell,
Tcrust, as shown in Fig 2. Battery voltage Vcell and current Ibatt are measured too. All the data measured are directly transferred to the PCIe-6323DAQ acquisition card.
Fig. 2. Display of the two K thermocouples for temperature data acquisition. D. Description of the discharging cycles
The test was initiated with three constant discharging currents covering the admissible current range of the battery, namely 300A (3C), 100A (1C) and 50A (0.5C). Regarding the temperature tests, the discharging cycles were executed at four different ambient temperatures through the climatic chamber: -20°C, -10°C, 0.0°C, and +25°C.
E. Experimental protocol
temperature, which evaluates the behavior of the cell measured as in the actual operating cycle drive in winter. The second phase is the recharging test at room temperature. The objective is to ensure the same energy level in the cell at the beginning of each discharge test.
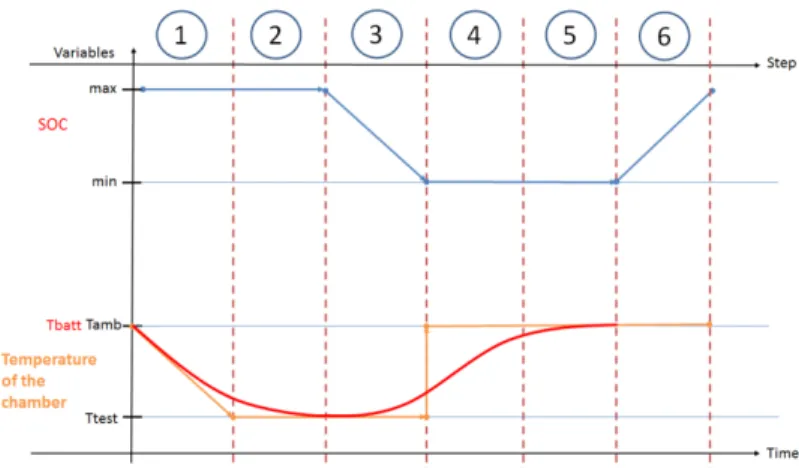
Fig. 3 shows the applied testing procedure, for both testing temperatures and discharge currents, it consists of the following steps:
Step 1: the cooling chamber temperature Tamb, is lowered to the temperature, Ttest.
Step 2: meanwhile, cells are kept in the chamber until the temperature of the battery, Tcore, reaches thermal equilibrium, i.e. the temperature test, Ttest.
Step 3: is the core of the discharging protocol. All the tests discharge the cell from maximum state of charge (SOC) to the minimum voltage discharge limit of 2.5V, recommended by the manufacturer because discharging beyond accelerates rapidly the battery’s deterioration as regards [22]. Also, during the discharge tests, Tbatt is rising up because of a heat generation happening from the electrochemical reaction inside the cell which shows what occurs truthfully in a realistic HEV driving cycle. Finally, the amount of energy extracted from the cell during tests is calculated with [7]:
𝑊 = ∫ 𝑉𝑐𝑒𝑙𝑙(𝑡). 𝐼𝑏𝑎𝑡𝑡(𝑡)𝑑𝑡 Where, W is the energy delivered (J)
Step 4: once the discharge cycle is done, the cooling chamber is set off, and Ttest is warming slowly to Tamb. Step 5: before each charge process, the cell is maintained at the same temperature, 25°C, to ensure an identical SOC of the battery at the beginning of the protocol and also in order to compare the test results. Because of the heat generation happening at step 3, one night’s rest is used for Tcore to reach 25°C. Step 6: the charge process is performed with a basic
protocol presented in Fig. 4 [23]. At room temperature, the cell is firstly charged by a constant current, 20A (0.2C) until Vcell value reaches 3.8V. Then, a constant voltage phase (3.8V) with 1/20 C cutoff current. Other thorough charging protocols could have been chosen [24, 25], but the one presented in Fig. 4 is sufficient to ensure the same energy level in the cell.
Fig. 3. Schematic of the discharging protocole.
Fig. 4. Charge protocol for the charge cycle performed under the same conditions.
F. Experimentation results
All test results and Wh characteristics at four different ambient temperatures are shown in TABLE I. To be noted that for Ttest of-20°C and constant current of 300A; the test did not start because the voltage, Vcell was too low due to the current and the temperature. The electronic load limitation would not initiate the test. Therefore, the test will not be shown here.
Fig. 5 to 6 compare discharge curves of a Li-ion cell at various temperatures, Ttest, and show Tcore evolution for two currents during discharge: 300A and 100A. It confirms the poor performance of the battery at low temperatures:
- The battery voltage decreases significantly with temperature drop, possibly due to the decreasing diffusivity of Li+ ions inside the cell [26]. And at -20°C, the voltage goes under the battery management limit (BMS) generally of 2V.
- Given equation (1), battery energy consequently decreases sharply with a decrease in the operating temperature.
This decreased operating voltage can be ascribed to an increased internal resistance of the cell mainly due to the decreasing diffusivity of Li+ ions inside the cell [26].
Nevertheless, during the operation of Li-ion cells at sub-zero temperatures, Fig. 5 and 6 show a significant temperature
increase on high current tests. This effect has to be taken into account in a battery model in order to design relevant thermal management in winter conditions. Actually, the self-heating allows an important energy recovery and, for instance, the delivered energy at -20°C is more important at 100A than at 50A (Table 1). Deeper detailed information of all the test results can be found here [27].
As a result, data show that electrical and thermal phenomena are extremely connected which hardens the battery model development. Indeed, two parts of modelling have to be considered for the future thermal optimization. Therefore, a thorough battery model that can determine the energy of the battery through a range of temperatures is pursued.
Fig. 5. Battery discharging cycles and battery temperature at three temperatures tests for a constant discharging current of 300A.
Fig. 6. Battery discharging cycles and battery temperature evolutions at four temperatures tests for a constant discharging current of 100A.
TABLE I. OUTPUT CHARACTERISITCS OF THE LOW
TEMPERATURE TESTS Test temper ature Test characteristics Max Temperature of the cell (°C) Discharging time (s) Energy deliver ed (Wh) Disc hargi ng curre nt (A) 25°C 29.63 7022 302 50 34.25 3541 293 100 64.20 1213 276 300 0°C -0.62 6206 238 50 7.45 3132 233 100 24.74 1096 231 300 -10°C -.9.73 6264 225 50 0.86 3217 226 100 20.89 1084 212 300 -20°C -13.75 5491 183 50 -5.61 3198 215 100
III. MODEL DESCRIPTION A. State-of-art
Various battery models are being introduced and studied in HEV applications. They can be categorized as electrochemical [28, 29], empirical [30, 31] and semi-empirical [32-34]. Here, the objective is to obtain a representation of the battery’s behavior which has a good balance between accuracy, tuning simplicity and simulation duration. Consequently, a semi-empirical model is designed (electric circuit based). The main advantages are to allow a simple parameterization and to stay close to the physical behavior [35]. It is especially suitable for system-level modeling.
Electrical models replicate battery behavior by means of a simple electrical circuit. They use passive components such as impedance, resistances and capacitors, and active elements like a variable voltage source. Therefore, because of their simplicity and easy use, electrical models are more widely used for EV/HEV applications among different battery models and are also suitable for thermal effect assignment.
As a result, in order to establish in the future a new battery thermal management capable of preventing cold battery performance losses, an electrical model coupled with a thermal branch is chosen in this paper.
B. Electrical model
In this subsection, the equivalent electrical model of the Li-ion battery is presented, and the composing parameters will be described.
A number of models have been developed in the past to characterize and simulate lithium cells. In this case, the goal is to establish a direct correlation between electrochemical phenomena inside the cell and the circuit elements. These models can capture nonlinear electrochemical phenomena, and yet avoid lengthy electrochemical process calculations.
The most commonly used electrical model is shown in Fig.
200 400 600 800 1000 1200 2,0 2,5 3,0 3,5 0 20 40 60 200 400 600 800 1000 1200 -10°C 25°C Voltag e ( V) Time (s) 0°C -10°C 0°C Tb att (°C) 25°C 1000 2000 3000 4000 2,75 3,00 3,25 3,50 -20 0 20 40 1000 2000 3000 4000 -20°C -20°C -10°C -10°C 0°C 0°C 25°C Voltag e ( V) Time (s) 25°C Tb att (°C) 25°C 0°C -10° -20°
7, [37, 38]. This model is based on the Rint model [36], it implements an ideal voltage source Voc to define the battery circuit voltage, a parallel RC network, and the internal resistance includes an ohmic resistance Ro and a polarization resistance R1 to take into account both the temperature and the SOC dependence.
Also, the state of charge of the battery is defined as [7]:
𝑆𝑂𝐶 = 𝑆𝑂𝐶0− ∫
𝐼𝑏𝑎𝑡𝑡
𝐶𝑖𝑛𝑖𝑡 𝑑𝑡
Where, SOC0 is the initial state-of-charge of the cell, Cinit is the initial capacity of the cell (Ah).
The choice of this model structure responds to a compromise between the ability to fit experimental data and equivalent circuit complexity. An extremely complex equivalent circuit or electrochemical model would fit experimental data sets well, but would be experimentally expensive and time consuming. Also, on contrary to [36], this model takes into account the varying characteristics of the internal impedance of the battery with both the varying state of charge, and an important rise of the cell temperature.
Such a model defines itself as suitable in some circuit simulations where the temperature and the state-of charge matter like a battery system.
Fig. 7. Schematic of the Thevenin model[36-38]. C. Thermal model
In this case, the thermal model of a single cell from a HEV battery pack is considered. It is elaborated to differentiate the temperature at the core and the crust of the cell. As illustrated in Fig. 8, the active material represented by the core is connected to the casing of the battery characterized by crust, with a conductive resistance in between. The heat generated,
Qgen, while operating happens in the core is mainly transferred to the crust through the conductive resistance while the crust rejects heat to the convective air surrounding. Thus, the heat transfer can be divided into two types: conductive heat transfer and convective heat transfer.
Fig. 8. Schematic of the battery thermal model.
In general, the thermal aspect of the cell can be interpreted by an energy balance solved by the thermal model. The governing equations for the energy balance are described as follows. According to the first law of thermodynamic, the thermal energy balance is expressed as [39]:
𝑑𝑈/𝑑𝑡 = 𝑄𝑔𝑒𝑛 (𝑡) − 𝑄𝑙𝑜𝑠𝑠 (𝑡)
Where U, the internal energy, is the total energy contained by a thermodynamic system, the core, expressed in Joules. The thermal model used in this paper has the following assumptions:
1. Due to the moving liquid electrolyte inside the core, the temperature of the core, Tcore, is guessed to be uniform. However in [40], the authors have proven the non-uniformity of Tcore along the cell core but a more sophisticated model like an electrochemical one is used to model thermal rejections. In this paper, uniformity of Tcore happened to be sufficient for thermal simulation.
2. By reason of the uniformity of Tcore, a linear temperature gradient settles between Tcore and the temperature of the crust;
Tcrust.
3. Current distribution and heat generation in core is uniform during operation process. It’s difficult to acquire the thermal conductivities of battery in x, y and z directions, so this paper assumes that the heat conductivity inside the lithium core is uniform and invariant with the operating status.
4. The thermal capacity of the crust of the cell is assumed as is negligible against the thermal capacity of the core.
According to these assumptions and [40], U is determined by:
𝑑𝑈 = 𝑚. 𝐶𝑝. 𝑑𝑇𝑐𝑜𝑟𝑒
Where, m is the mass of the cell (kg), dTcore is the temperature variation of the core with time (K) and Cp is the specific heat capacity of the cell (J/kg/K). Also, Qgen is the generating heating rate, meaning the rate of the heat generation occurring in the core. Furthermore, the volume heat generation rate in a battery body is the sum of numerous local losses like active heat generation, reaction heat generation, Ohmic heat generation
[26]. In this paper, Qgen is characterized only by ohmic losses, because of their simplicity to model, contrary to other losses where an electro-chemical usually simulates them [41]. Ohmic losses are stated in Watts and expressed here as:
𝑄𝑔𝑒𝑛 = 𝑅0. (𝐼𝑏𝑎𝑡𝑡)2+ 𝑅1. (𝐼1)2 Then, Qloss , expressed in W, results all the heat transfers as a consequence of a temperature difference between the core and its surrounding, i.e. the crust and the ambient air. And because of assumption 3 Qloss is expressed as:
𝑄𝑙𝑜𝑠𝑠= 𝑄𝑐𝑜𝑛𝑑= 𝑄𝑐𝑜𝑛𝑣
The following subsections propose a thorough description of the conductive heat transfer, Qcond (W) and the convective heat transfer, Qconv (W).
1) Modeling of Conductive Heat Transfer
The conductive heat transfer between the core and the crust can be calculated as:
𝑄𝑐𝑜𝑛𝑑 =(𝑇𝑐𝑜−𝑇𝑐𝑟)
𝑅𝑐
Where Tcore and Tcrust represent the temperature at the core and the crust of the cell, respectively. Rc is the thermal conductivity resistance associated with the conductive heat flux. Since the representation of the modeled cell isn’t a cylinder; the heat region used for the computation in the battery cell can be infinite. In order to simplify the model, it’s assumed that the heat flux within the cell occurs uniformly along the thickness (x axis) and the length of the cell (y axis) as shown in the figure 9. With this assumption, the conductive heat transfer is considered to happen only from the bottom of the core (y axis), and from both sides of the core (x axis).
2) Modeling of Convective Heat Transfer
The heat transfer from the crust to the surrounding is estimated and determined by:
𝑄𝑐𝑜𝑛𝑣= ℎ𝑐𝑜𝑛𝑣𝑆𝑎𝑟𝑒𝑎(𝑇𝑐𝑟𝑢𝑠𝑡− 𝑇𝑎𝑖𝑟)
Hence Qconv depends on the air flow temperature, Tair, the area of heat exchange, Sarea, and the convective heat transfer coefficient hconv. The same assumption made before is maintained, the differentiation of crust and air is done by radial direction convection. The heat rejection appears at the top and from the sides of the cell.
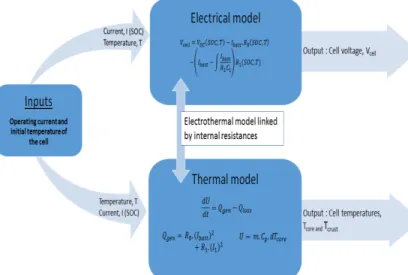
D. Electrical and thermal model combination
In this paper, a coupled electro thermal model of a Li-Ion battery is proposed. In this model, the inputs are the operating current and the air temperature Tair as shown in Fig. 9. This model is considered both thermal and electrical since the temperature makes difference on three parameters that link the electrical part to the thermal one, Ro, R1 and C1. Therefore, as the electrical model is calculating the voltage of the cell, the
thermal part is giving evolution of the cell temperature. Also, with equation (1), cell energy is also acquired in the model.
Fig. 9. Schematic of the electro thermal model of the Li-Ion cell.
IV. EXTRACTING MODEL PARAMETERS
The model of Figure 7 implies that the fitting procedure involves the estimation of four independent parameters, namely
Voc, Ro, R1 and C1, which vary with temperature and SOC of the cell.
A. Static parameter Voc
Voc. can be obtained from experimentation with a pulse discharge characterization test: the cell is initially charged and then summited to partial discharge-rest phase cycles. Fig. 10 describes these tests. The cell is submitted shortly to a constant discharging current Ibatt and left to rest. At the end of each 20 minute rest, the voltage was found to be stable enough as to be considered a good estimate of Voc. Fig. 11 presents the Voc versus SOC plot.
Three temperatures Ttest and two discharging currents Ibatt, have been performed. Temperature and current based variations are minimal compared to SOC dependence. Consequently, temperature and current are not taken into account in the Voc modeling. This fact is emphasized by literature. Indeed, in [38], the authors have shown the insignificant temperature influence on the values of the open circuit voltage.
Then, a curve fitting was done using MATLAB Curve Fitting Tool. The type of fit employed was Rational with a third degree numerator and denominator as described in (9).
𝑉𝑜𝑐(𝑆𝑜𝐶) =
𝑝1.𝑆𝑜𝐶3+𝑝2.𝑆𝑜𝐶2+𝑝3.𝑆𝑜𝐶+𝑝4
𝑆𝑜𝐶3+𝑞1.𝑆𝑜𝐶2+𝑞2.𝑆𝑜𝐶+𝑞3 p1 =2135; p2 =9680; p3 6889; p4 5004; q1 =4137; q2
=-2759; q3 =-1415.
Figure 12 shows the result of the fitting. The Voc data was acquired at room temperature (around 25 °C) for 10 different values of SOC.
Fig. 10. Experimental pulse discharge curves at 25°C and 100A constant discharging current.
Fig. 11. Open-circuit voltage as a function of Ttest, SOC and Ibatt.
Fig. 12. Open-circuit voltage as a function of SOC, at 25 °C.
B. Internal impedances R0, R1 and capacitance C1
The numerical extraction proposed here is based on nonlinear least-square algorithm. Each pulse discharge curve obtained experimentally (see Fig. 10) was run individually through an estimation task where, each parameter (R0, R1 and C1) was determined by fitting to experimental data each pulse using the parameter estimation tool in Simulink Design Optimization™. The pulse discharge tests were performed at three ambient temperatures Ttest: 25°C, 0°C and -20°C, at the end, this produced a two dimensional (Ttest, SOC) lookup table for each element (R0, R1 and C1).
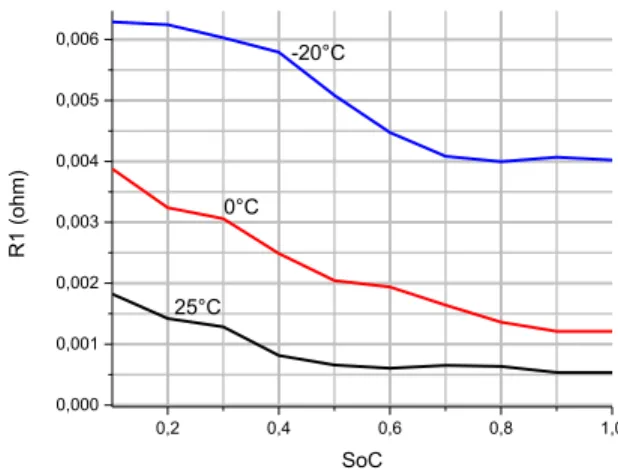
Fig. 13 - 15 shows examples of the parameter estimation extraction results (at 100A discharging current and the three temperatures Ttest) that constitute the look-up tables for the three parameters: R0 (T, SOC), R1 (T, SOC) and C1 (T, SOC).
In Figure 13, R0 shows much more dependence on temperature than on SOC. As shown in Fig. 15, R1 depends on temperature and increases at low SOC. Finally, as illustrated on Fig. 15, the capacitance C1 appears to depend on temperature, but it also shows a particular shape with SOC. The cause of this behavior is not well-known at the moment but has been highlighted in literature [16, 38]. Also, in [42-44], the value of this parameters tends to be of the same order of magnitude (>105 Farads) nevertheless, no explanation has yet to be found. This estimation process was repeated for each discharging current, and the same observations were made.
As a result, three sets of parameters for each variable characterize the cell impedance under temperature and SOC consideration. Several methods are proposed to evaluate experimentally these impedances [20, 45] which could be the next step for the estimation phase but the model validation presented in the next section confirms the accuracy of the model with computed impedances data.
Fig. 13. Ohmic internal resistance R0 vs SOC for three tests temperatures at
100A. 0 2000 4000 6000 8000 10000 12000 2,0 2,2 2,4 2,6 2,8 3,0 3,2 3,4 3,6 Voltage Vcell (A) Time (s) 2000 4000 6000 8000 10000 12000 -100 -80 -60 -40 -20 0 Current Iba tt ( A) Time (s) 0,0 0,2 0,4 0,6 0,8 1,0 2,00 2,25 2,50 2,75 3,00 3,25 Ope n cir cuit vo ltag e ( V) SOC
Voc Ttest 25°C Ibatt 100A Voc fitting curve 0,2 0,4 0,6 0,8 1,0 0,002 0,004 0,006 0,008 0,010 0,012 0,014 0,016 0,018 -20°C 0°C R0 ( oh m) SoC 25°C
Fig. 14. Polarization internal resistance R1 vs SOC for three tests temperatures at 100A.
Fig. 15. shunt capacitance C1 vs SOC for three tests temperatures at 100A.
C. Physical parameters: Cp, m, hcond, etc.
The physical parameters can be found in literature or with an experimental exploration. In this paper, the first choice has been made and TABLE II shows all the parameters needed to operate the model.
V. SINGLE CELL MODEL RESULTS A. Simulation Results
In this section, the improved battery model that incorporates temperature and SOC effects is simulated, and its output responses are compared with the experimental battery data for validations purposes. Tests results and Wh characteristics at four different ambient temperatures are shown in TABLE III.
1) Thermal Model Validation
In this subsection, the measures obtained by the discharging protocol are compared to simulated data. Fig. 16 shows the battery core and crust temperatures output for different initial temperatures and all three discharging constant currents (300A, 100A and 50A).
As expected, in Fig. 16, the temperature of the core is higher than the crust since the heat generation is originating from the active material where electrochemical processes occur.
Moreover, one of the difficulties encountered in II.F has been well replicated. Indeed the simulation results agree well with experimental data during the discharging process, showing the self-heating phenomenon.
Also, to complete the thermal validation, another test not part of the protocol was executed at a random value of Ibatt (262A) and simulated at the same time in the model. Fig. 17 shows the results.
The simulation results match well with experimental data. Meaning this model is capable of reproducing the battery temperatures measured by the experimental tests. As a result, this thermal model is adequate for the optimization assignment of a HEV battery thermal system.
0,2 0,4 0,6 0,8 1,0 0,000 0,001 0,002 0,003 0,004 0,005 0,006 25°C 0°C R1 ( oh m) SoC -20°C 0,2 0,4 0,6 0,8 1,0 0 50000 100000 150000 200000 250000 300000 -20°C C1 ( F) SoC 25°C 0°C TABLEII PHYSICAL PARAMETERS
Symbol QUANTITY Value
Cp Specific heat capacity
(J/kg/°K). 915[7]
λ Thermal conductivity
of air (W/m/°K) 0.02620 at 20°C[46]
hcond Conductive heat
transfer coefficient (W/(m²/°K)
0.30 at 20°C[46]
hconv Convective heat
transfer coefficient (W/(m²/°K
5 (natural convection)[46]
Fig. 16. (From top to bottom) Graphs of battery temperature of the core and the crust (in °C) . (a) at 25°C and 100A,(b) at 0°C and 300A, (c) at -10°C and 300A, (d) at -20°C for 50A respectively.
Fig. 17. Graphs of battery temperature core and crust for a 262 A discharing current and Ttest of -20°C
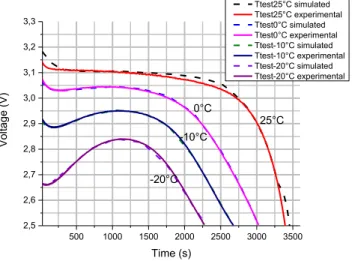
2) Electrical Model Validation
In this subsection, experiment data of battery potential under the discharging curves (presented in section II.F) are compared with the simulation results. As a reminder, the discharging curves were executed at four ambient temperatures (20°C, -10°C, 0°C, 25°C) and for each one, three constant discharging currents were applied. As an example for the validation, one discharging current (100A) is compared against simulated data. The good agreements in Fig. 18 show that the electro-thermal model is able to simulate battery discharge performance at different temperatures Ttest. But as the thermal model validation,
the test of 262A discharging current has been simulated to complete the electrical validation. Fig. 19 illustrates that validation and shows that simulation and experiment agree well, meaning that this model is capable of reproducing battery voltage curve at low temperatures.
To emphasize this validation, energy delivered from simulation and experimentation collected in TABLE III shows a good match between model and test results proving that this simple electrical model predicts thorough battery performances under low temperatures so it is sufficient for future optimization.
Fig. 18. Battery electrical model validation against 4 sets of temperatures (-20,-10,0 and 25°C) and one discharging current of 100A. (a) at ambient temperature 25°C, (b) at cold temperatures (0°C,-10°C and -20°C).
Fig. 19. Battery electrical model validation against a 262A discharging current at -20°C.
TABLE III. OUTPUT CHARACTERISITCS OF THE MODEL
AGAINST EXPERIMENTAL DATA
Test temper ature
Test inputs Model outputs Test results
Discharging
current (A) Energy delivered (Wh)
25°C 50 300 302 100 292 293 300 271 276 0°C 50 234 238 500 1000 1500 2000 2500 3000 3500 2,5 2,6 2,7 2,8 2,9 3,0 3,1 3,2 3,3 -20°C -10°C 0°C Voltag e ( V) Time (s) Ttest25°C simulated Ttest25°C experimental Ttest0°C simulated Ttest0°C experimental Ttest-10°C simulated Ttest-10°C experimental Ttest-20°C simulated Ttest-20°C experimental 25°C 0 200 400 600 800 1000 1,0 1,5 2,0 2,5 3,0 Vba tt (V) Time (s)
Ibatt 262A experimental Ibatt 262 simulated
Test temper ature
Test inputs Model outputs Test results
Discharging
current (A) Energy delivered (Wh)
100 231 233 300 230 231 -10°C 50 100 222 223 225 226 300 209 212 -20°C 50 100 181 210 183 215 262 186 193
VI. STUDIES ON THERMAL AND ELECTRICAL PERFORMANCE OF A SINGLE CELL AND A LITHIUM-ION BATTERY PACK IN HEV
UNDER REALISTIC DRIVING CYCLE CONDITIONS.
A. Driving cycle conditions
In these studies, the driving cycle is derived from real time current data that was taken from a hybrid electric vehicle using an on board data acquisition system designed at University of Québec of Trois-Rivières (UQTR). The following subsection describes this vehicle.
1) The Némo HEV
The Némo HEV is designed as a small, low-speed vehicle; it is meant to be used in industrial settings, in an indoor/outdoor utility role. Now, the vehicle is used as a mobile laboratory and includes an on-board Polymer Electrolyte Membrane Fuel Cell (PEMFC), nine lead/acid cells serial connected and an Internal Combustion Engine (ICE). From a research point of view, the ownership of a physical vehicle provides an essential real-life scientific platform onto which models and experiments can be validated. In this paper, the hydrogen devices and the ICE are not considered (Némo is used as a simple battery electric vehicle). Fig. 20 illustrates the aforementioned HEV.
Fig. 20. Picture of the Némo hybrid electric vehicle. [47] 2) The realistic driving cycle condition
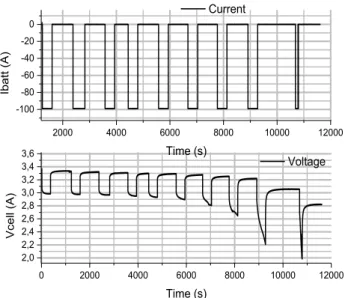
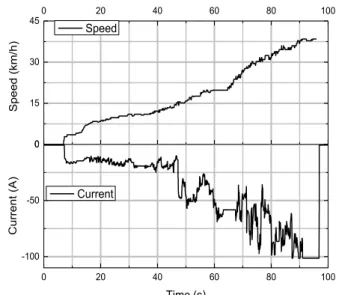
The hybrid electric vehicle Némo was driven on a typical acceleration phase for 85s while the battery current was recorded (Fig. 1). Fig. 21 details the speed chart of the acceleration phase. Then, this current is replayed on the battery test bench (Fig. 21). The battery pack is in serial connection and consequently, the single cell current is equal to the pack current. This realistic condition was used to exercise Li-ion cells; three of them were tested at three different temperatures, namely
25°C, 0.0°C, -20°C. As for voltage boundary condition, the realistic cycle test used operates between 2.5 volts to 3.8 volts which is a normal charging and discharging single LiFePO4 cells [7].
Fig. 21. Top : speed chart of the 85s acceleration phase. Bottom : current measurement of the battery pack for the acceleration phase.
B. Single cell results
Examples of electrical and thermal validation are presented in this part. Fig. 22 shows the experimental and simulation results of the electrical part of one cell placed at ambient temperature of 0°C. It has to be underlined that the electrical model predictions agree well with experimental results at this temperature Ttest.
Fig. 22. Validation of the single cell electrical model. Top to bottom. Current: electrical current corresponding to the acceleration phase. Voltage: experimental and simulated potential (V) evolution.
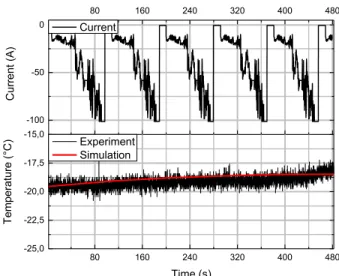
Fig. 23 shows the experimental and simulation results of the thermal part of one cell placed at the temperature of -20°C. The cell temperature has a slow dynamic and so, the 90s record is repeated several times in order to show the thermal variation. As stated before (Fig. 5 and Fig. 6), the battery is self-heating depending on the input current. Even though the temperature has not raised much, and there is little temperature variation in the cell. Fig. 23 shows also the single cell thermal model tends
0 15 30 450 20 40 60 80 100 0 20 40 60 80 100 -100 -50 0 Spee d ( km/h ) Speed Curr en t ( A) Time (s) Current -100 -50 0 20 40 60 80 100 20 40 60 80 100 2,8 3,0 3,2 3,4 Curr en t ( A) Current Voltag e ( V) Time (s) Experiment Simulation
to follow the cell temperature evolution generated by the experimental tests which verifies the effectiveness of the simulation model. Finally, the mean value error estimated for this simulation stays under 3%.
Fig. 23. Validation of the single cell thermal model. Top to bottom. Current: electrical current corresponding to the acceleration phase. Temperature: experimental and simulated temperature (V) evolution.
C. Battery pack results
A preliminary analysis of the main performance and features offered by the single cell model has been described in the previous section, using input data coming from a realistic driving cycle test, driven by the Némo. Afterwards, a thorough experiment and simulation have been conducted with the battery pack tested with the same realistic test at a low temperature of 0°C. The results of the thermal and electrical simulation are going to be described independently in the following sub-section together with the experimental tests that have been realized referring to the driving profile cycle and the battery pack.
1) The Simulation model of the battery pack
The studied battery pack includes four cells (Fig. 24). In order to increase the voltage, the cells are connected in series. To simplify calculation and guarantee precision, necessary and reasonable assumptions are proposed: imperfect contact at the interface of two surfaces of the cells is being found (represented by the dashed red arrows on the left of Fig. 24) and thus contact resistance is non-negligible, according to literature [40], the relationship between the heat flow, Q, and the thermal interface resistance, Rth is defined by:
𝑅𝑡ℎ =
𝛥𝑇
𝑄/𝐴
Where A is the area of the interface and ΔT is the temperature difference between two contact surfaces. A representation of the contact resistance is shown in Fig. 24.
Moreover, the conduction between electrodes on temperature field is ignored. Additionally, cells at both end of pack reject heat only throw natural air convection. Furthermore, the current
distribution in each cell is uniform during charge-discharge process. Finally, cells 1 and 2 are separated from cells 3 and 4 symmetrically through the middle of the pack (along axe z). Therefore, by considering a plane of symmetry, the temperatures of cell 2 and 3 are assumed equal during simulation and thermal equations of cells 1-2 are identical to cells 3-4.
The thermal aspect of the pack is a system of equations solved by the thermal model. The thermal balance on cell 1 is based on [39] and equations (3) and (4) and is determined by:
{ 𝑚. 𝐶𝑝. 𝑑𝑇1 𝑑𝑡 = 𝑄𝑔𝑒𝑛 (𝑡) − 𝑄𝑙𝑜𝑠𝑠 (𝑡) 𝑄𝑔𝑒𝑛 (𝑡) = 𝑅0. (𝐼𝑏𝑎𝑡𝑡)2+ 𝑅1. (𝐼1)2+ 𝐴𝑐. ( 𝑇2−𝑇1 𝑅𝑡ℎ ) 𝑄𝑙𝑜𝑠𝑠 (𝑡) = 𝑇𝑎𝑖𝑟−𝑇1 [𝑅𝑐𝑜𝑛𝑣1+𝑅𝑐𝑜𝑛𝑑1] 𝑅𝑐𝑜𝑛𝑣1= ( 1 ℎ1𝑆1)
Where Rth is the thermal contact resistance in (W/m²/K) between cells 1-2 defined by (10) associated with Ac is the contact area between two cells (in m²). Rcond1 is the thermal conductivity resistance associated with the conductive heat flux through cell 1 in (W/ (m/K)). Finally, Rconv1 the conductive heat resistance with h1 the conductive heat transfer (W/ (m²/K)) and
S1 the external surface of cell 1 in contact with natural air (m²), which according to Fig.24 is the side, top and the bottom of cell 1.
The equations used for T2 calculation are very similar.
{ 𝑚. 𝐶𝑝. 𝑑𝑇2 𝑑𝑡 = 𝑄𝑔𝑒𝑛 (𝑡) − 𝑄𝑙𝑜𝑠𝑠 (𝑡) 𝑄𝑔𝑒𝑛 (𝑡) = 𝑅0. (𝐼𝑏𝑎𝑡𝑡)2+ 𝑅1. (𝐼 1)2 𝑄𝑙𝑜𝑠𝑠 (𝑡) = 𝑇𝑎𝑖𝑟−𝑇2 [𝑅𝑐𝑜𝑛𝑣2+𝑅𝑐𝑜𝑛𝑑2]+ 𝐴𝑐. ( 𝑇2−𝑇1 𝑅𝑡ℎ ) 𝑅𝑐𝑜𝑛𝑣2= ( 1 ℎ2𝑆2)
Where S2 is the area in contact with ambient air (Tair) in m², which is the top and the bottom of cell 2. Furthermore, the same physical parameters have been chosen for the simulation of the thermal part (See Table II, Section IV.C) since no cell materials nor have dimensions been changed, thus: h1 = h2 = hcond and
Rconv1 = Rconv2 = Rconv .
An estimation of the thermal contact resistance is mandatory to calculate the temperature distribution within the pack. In this work, a mean square algorithm is used (Rth=5.6x10⁻³ m².K/W). -100 -50 0 80 160 240 320 400 480 80 160 240 320 400 480 -25,0 -22,5 -20,0 -17,5 -15,0 Curr en t ( A) Current Te mp er atu re (°C) Time (s) Experiment Simulation
Fig. 24. Battery pack geometry, 3D and side view from left to right respectively and schematic of the thermal contact resistance, Rth.
2) Temperature fields tests and voltage assessment of the
battery pack
Due to the pack geometry, the thermal analysis has been conducted in a more precise way, because more necessary thermal input data have to be installed on the experimental setup with now eight thermocouples (Fig.25). Four thermocouples measure the temperature of each cell (Tcore), all are placed on the electrode of each cell and the four remaining evaluate Tcrust, defined as the surface of the cell. Three of them should be placed between two cells to reflect the temperature evolution due to conductive heat.
The voltage excursion of the battery pack is from 11.2V to 14.4V (rated voltage of 13.5V), according to the manufacturer. A lack of acquisition spots on the DAQ card encouraged us to use one voltage sensor for measuring the tension of the pack.
3) The battery pack results analysis: electrical part.
Fig. 25 shows the current profile imposes to the battery, the battery pack voltage response (experimental and simulation) at a Ttest of 0°C. As it can be pointed out from the analysis of the results, the electrical model provides a good estimation of the voltage and the measurement error for this test remains under 1% error. Thus, it is assumed that the electrical model is working for a battery pack application.
Fig. 25. Validation of the battery pack electrical model. Top to bottom. Current: electrical current corresponding to the acceleration phase. Voltage: experimental and simulated potential (V) evolution. Error: voltage difference between model and experiment (%).
4) The battery pack results analysis: thermal part.
After the analysis of the voltage characteristic under a driving cycle, it is necessary to continue the validation of the model with the prediction of the thermal behavior of the pack. As pointed before, thermal validation test was carried out longer than one cycle in order to observe temperature variations. Fig. 26 shows the main results acquired from the tests at -20°C. During the experimentations, the thermal variations between cells 1-4 were observed similar, the same goes concerning cells 2 and 3.Considering it; Fig. 26 displays the temperature evolutions of cell 1 and cell 2 which also account for cell 4 and cell 3, respectively. It can be easily observed that cell 2 and 3 (inside the pack) had always a higher temperature than cell 1 and 4 (on the edge). These wilder variations in the temperature of cell 2 and 3 can be explained by their geometric arrangement which allows them less contact with ambient air, thus less heat rejected. But, at higher temperatures, the cell 2 and 3 will degrade faster than cell 1 and 4 because the difference between the center and the surface temperature will enhanced and elevated temperatures increase promotes also the aging of the battery [47]. Therefore, predicting and managing temperature variations in a pack are important to design a thermal management system for the battery.
The battery pack and its surface temperature variations are represented in Fig. 26. Again, the proposed model captures the dynamic responses and predicts the thermal behavior of the battery pack accurately under realistic driving conditions
Fig. 26. Validation of the battery pack thermal model. Clockwise from top left. Current: electrical current corresponding to the acceleration phase. Error: temperature difference between model and experiment (%).Temperature: experimental and simulated temperature (V) evolution of cell2-3 and cell1-4, respectively.
VII. CONCLUSION
In this paper, a Li-ion battery has been characterized and an improved electro-thermal model has been developed.
It is shown that with low temperatures, both the operating voltages and energy delivered are reduced because a cold environment lengthens the diffusivity of Li+ inside the cell. The -100 -50 0 20 40 60 80 20 40 60 80 12,4 12,8 13,2 Curr en t ( A) Current Voltag e ( V) Time (s) Simulation Experiment -100 -50 0 80 160 240 320 400 480 -25,0 -22,5 -20,0 -17,5 80 160 240 320 400 480 -25,0 -22,5 -20,0 -17,5 Curr en t ( A) Current T Cell1-4 (°C) Experiment Simulation TCe ll2-3 (°C) Time (s) Experiment Simulation
experimental results highlighted an important self-heating phenomenon, especially at high current. Moreover, this phenomenon implies important consequences on the electric behavior and has to be taken into account for modeling.
Experiments were performed at different scenarios to compare with corresponding simulation results to validate the proposed battery model, where the voltage and thermal dynamics characteristic are represented by the proposed model. For all scenarios, the experimental results / simulation data comparison has shown that the model is capable of running and predicting cell temperature under cold environment. Moreover, the simulated energy delivered by the cell which was the milestone of this model has been a good match to the experimental results. So in this case, this model proposes a good prediction and is sufficient for energy management design.
This model differs from the battery electro-thermal models currently proposed. Firstly, the model is applicable for HEVs/VEs battery pack studies. Secondly, this model has a feature that follows the thermal and energy output characteristics of the cell for sub-zero temperatures, which can be useful for winter application cases where low temperature affects electro—chemical systems.
In Section VI, a general two-dimensional battery pack electro-thermal model has been developed to predict the temperature distribution and the voltage output inside a battery pack under different boundary and initial conditions. In particular, the battery pack model, consisted of four prismatic LiFePO4 cells, with boundary conditions, was exercised under a realistic driving cycle taken from an operating HEV at different low temperatures. The comparison with experimental data was used to validate the results, as discussed in Section VI. The accuracy found with the experimental results makes the model an ideal candidate for simulation of battery packs, design of cooling systems or thermal management systems.
As a consequence, with the data acquired and the validated model, an innovative heating strategy is now workable. However, high current values accelerate cell deterioration [48-51] and this point has to be investigated.
ACKNOWLEDGEMENT
This work is supported by the Natural Sciences and Engineering Research Council of Canada.
REFERENCES
[1] D. Doughty and E. P. Roth, “A General Discussion of Li
Ion Battery Safety,” Electrochem. Soc. Interface, vol. 21, no. 2, pp. 37–44, 2012.
[2] H.P. Jones; J.T. Chapin; M. Tabaddor,“Critical Review of
Commercial Secondary Lithium-Ion Battery Safety Standards,” UL presentation at 4th IAASS Conference,
Making Safety Matter, May 2010.
[3] A. Lajunen, “Evaluation of energy storage system requirements for hybrid mining loader,” 2011 IEEE Veh.
Power Propuls. Conf., pp. 1–6, Sep. 2011.
[4] S. Sloop, “Recycling Methods for Lithium-Ion and other
Batteries,” 13th International Battery Materials Recycling
Seminar, March 2009.
[5] S. S. Zhang, K. Xu, and T. R. Jow, “The low temperature performance of Li-ion batteries,” J. Power Sources, vol. 115, no. 1, pp. 137–140, Mar. 2003.
[6] K. Qian, C. Zhou, V. Yuan, and M. Allanl, “Temperature
Effect on Electric Vehicle Battery Cycle Life in Vehicle-to-Grid Applications,” Electr. Distrib. (CICED), 2010
China Int. Conf. Electr. Distrib., pp. 1–6, 2010.
[7] D. Linden and T. B. Reddy, HANDBOOK OF BATTERIES 3rd Edition. McGraw-Hill, 2002.
[8] R. Bugga, M. Smart, J. Whitacre, and W. West, “Lithium
Ion Batteries for Space Applications,” 2007 IEEE Aerosp.
Conf., pp. 1–7, 2007.
[9] Y. Ji and C. Y. Wang, “Heating strategies for Li-ion batteries operated from subzero temperatures,”
Electrochim. Acta, vol. 107, pp. 664–674, Sep. 2013. [10] H. Song, J. Jeong, B. Lee, and D. H. Shin, “Experimental
Study on the Effects of Pre-Heating a Battery in a Low-Temperature Environment,” Veh. Power Propuls. Conf., pp. 1198–1201, 2012.
[11] C. Alaoui, “Solid-State Thermal Management for
Lithium-Ion EV Batteries,” IEEE Trans. Veh. Technol., vol. 62, no. 1, pp. 98–107, 2013.
[12] A. Tani, M. B. Camara, and B. Dakyo, “Energy Management Based on Frequency Approach for Hybrid Electric Vehicle Applications :,” IEEE Trans. Veh.
Technol., vol. 61, no. 8, pp. 3375–3386, 2012.
[13] L. Wang, E. G. Collins, S. Member, H. Li, and S. Member,
“Optimal Design and Real-Time Control for Energy Management in Electric Vehicles,” IEEE Trans. Veh.
Technol., vol. 60, no. 4, pp. 1419–1429, 2011.
[14] Y. K. Tan, J. C. Mao, and K. J. Tseng, “Modelling of
Battery Temperature Effect on Electrical Characteristics of Li-ion Battery in Hybrid Electric Vehicle,” Power
Electron. Drive Syst. 2011 IEEE Ninth Int. Conf., pp. 637
– 642, 2011.
[15] S. Bhide and T. Shim, “Novel Predictive Electric Li-Ion
Battery Model Incorporating Thermal and Rate Factor Effects,” IEEE Trans. Veh. Technol., vol. 60, no. 3, pp. 819–829, 2011.
[16] M. Chen, S. Member, and G. A. Rinc, “Accurate Electrical Battery Model Capable of Predicting Runtime and I – V Performance,” IEEE Trans. Energy Convers., vol. 21, no. 2, pp. 504–511, 2006.
[17] A. Szumanowski, “Battery Management System Based on
Battery Nonlinear Dynamics Modeling,” IEEE Trans. Veh.
Technol., vol. 57, no. 3, pp. 1425–1432, May 2008. [18] O. Tremblay, L.-A. Dessaint, and A.-I. Dekkiche, “A
Generic Battery Model for the Dynamic Simulation of Hybrid Electric Vehicles,” 2007 IEEE Veh. Power
Propuls. Conf., pp. 284–289, Sep. 2007.
[19] O. Erdinc, B. Vural, and M. Uzunoglu, “A dynamic lithium-ion battery model considering the effects of temperature and capacity fading,” 2009 Int. Conf. Clean
Electr. Power, pp. 383–386, Jun. 2009.
[20] D. V. Do, C. Forgez, K. El, K. Benkara, G. Friedrich, and S. Member, “Impedance Observer for a Li-Ion Battery
Using Kalman Filter,” IEEE Trans. Veh. Technol., vol. 58, no. 8, pp. 3930–3937, 2009.
[21] N. Watrin, S. Member, R. Roche, S. Member, H.
Ostermann, B. Blunier, A. Miraoui, and S. Member, “Multiphysical Lithium-Based Battery Model for Use in State-of-Charge Determination,” IEEE Trans. Veh.
Technol., vol. 61, no. 8, pp. 3420–3429, 2012.
[22] S. Kelouwani, K. Agbossou, Y. Dubé, and L. Boulon,
“Fuel cell Plug-in Hybrid Electric Vehicle anticipatory and real-time blended-mode energy management for battery life preservation,” J. Power Sources, vol. 221, no. 3, pp. 406–418, Jan. 2013.
[23] H. J. Bergveld, “Battery Management Systems Design by
Modelling,” Universiteit Twente, 2001.
[24] J. Jiang, C. Zhang, J. Wen, W. Zhang, and S. M. Sharkh,
“An Optimal Charging Method for Li-Ion Batteries Using a Fuzzy-Control Approach Based on Polarization Properties,” IEEE Trans. Veh. Technol., vol. 62, no. 7, pp. 3000–3009, Sep. 2013.
[25] E. Inoa, S. Member, and J. Wang, “PHEV Charging
Strategies for Maximized Energy Saving,” vol. 60, no. 7, pp. 2978–2986, 2011.
[26] J. Wang, P. Liu, J. Hicks-Garner, E. Sherman, S. Soukiazian, M. Verbrugge, H. Tataria, J. Musser, and P. Finamore, “Cycle-life model for graphite-LiFePO4 cells,” J. Power Sources, vol. 196, no. 8, pp. 3942–3948, Apr.
2011.
[27] J. Jaguemont, L. Boulon, Y. Dubé, and D. Poudrier, “Low Temperature Discharge Cycle Tests for a Lithium Ion Cell,” Veh. Power Propuls. Conf. (VPPC), 2014 IEEE, pp. 1 – 6, 2014.
[28] M. Doyle, T.F. Fuller and J. Newman, “Modeling of galvanostatic charge and discharge of the Lithium/Polymer/Insertion Cell,” Journal of the
Electrochemical Society, vol 140, no6, pp. 1526–1533,
1993.
[29] L. Song and J.W. Evans, ”Electrochemical-thermal model of lithium polymer batteries,” Journal of the
Electrochemical Society, vol 147, issue 6, pp. 2086–2095,
2000.
[30] D. Panigrahi, C. Chiasserini, S. Dey, R. R. Rao, A.
Raghunathan, and K. Lahiri, “Battery Life Estimation of Mobile Embedded Systems,” VLSI Des. 2001. Fourteenth
Int. Conf. VLSI Des., pp. 57–63, 2001.
[31] C. Chiasserini, R. R. Rao, and S. Member, “Energy
Efficient Battery Management,” IEEE J. Sel. AREAS
Commun., vol. 19, no. 7, pp. 1235–1245, 2001.
[32] K. C. Syracuse and W. D. K. Clark, “A statistical approach to domain performance modeling for oxyhalide primary lithium batteries,” Twelfth Annu. Batter. Conf. Appl. Adv., pp. 163–170, 1997.
[33] M. Pedram, “Design considerations for battery-powered
electronics,” Proc. 1999 Des. Autom. Conf. (Cat. No.
99CH36361), pp. 861–866, 1999.
[34] A. Barré, F. Suard, M. Gérard, M. Montaru, and D. Riu, “Statistical analysis for understanding and predicting
battery degradations in real-life electric vehicle use,” J.
Power Sources, vol. 245, pp. 846–856, Jan. 2014.
[35] H. He, R. Xiong, X. Zhang, F. Sun, J. Fan, and S. Member,
“State-of-Charge Estimation of the Lithium-Ion Battery Using an Adaptive Extended Kalman Filter Based on an Improved Thevenin Model,” IEEE Trans. Veh. Technol., vol. 60, no. 4, pp. 1461–1469, 2011.
[36] H. He, R. Xiong, H. Guo, and S. Li, “Comparison study on
the battery models used for the energy management of batteries in electric vehicles,” Energy Convers. Manag., vol. 64, pp. 113–121, Dec. 2012.
[37] A. Tani, M. B. Camara, and B. Dakyo, “Energy Management Based on Frequency Approach for Hybrid Electric Vehicle Applications :,” IEEE Trans. Veh.
Technol., vol. 61, no. 8, pp. 3375–3386, 2012.
[38] T. Huria, M. Ceraolo, J. Gazzarri, and R. Jackey, “High Fidelity Electrical Model with Thermal Dependence for Characterization and Simulation of High Power Lithium Battery Cells,” Electr. Veh. Conf. (IEVC), 2012 IEEE Int., pp. 1 – 8, 2012.
[39] F. P. Incropera, D. De Witt, T. L. Bergman, and A. Lavine,
Fundamentals of Heat and Mass Transfer, John Wiley.
New York, 2011.
[40] S. Chacko and Y. M. Chung, “Thermal modelling of Li-ion
polymer battery for electric vehicle drive cycles,” J. Power
Sources, vol. 213, pp. 296–303, Sep. 2012.
[41] Y. Ye, Y. Shi, and A. a. O. Tay, “Electro-thermal cycle life model for lithium iron phosphate battery,” J. Power
Sources, vol. 217, pp. 509–518, Nov. 2012.
[42] S. Barsali, M. Ceraolo: “Dynamical models of lead-acid
batteries: implementation issues”, IEEE Transactions on
Energy Conversion, vol. 17, no. 1, pp. 16-23, Mar 2002. [43] M. Ceraolo, G. Lutzemberger, T. Huria,
“Experimentally-Determined Models for High-Power Lithium Batteries”,
Advanced Battery Technology 2011, SAE, April 2011. [44] M. Ceraolo: “New Dynamical Models of Lead-Acid
Batteries”, IEEE Transactions on Power Systems, vol. 15, no. 4, pp. 1184-1190. November 2000.
[45] R. Al Nazer, V. Cattin, P. Granjon, M. Montaru, and M. Ranieri, “Broadband Identification of Battery Electrical Impedance for HEVs,” IEEE Trans. Veh. Technol., vol. 62, no. 7, pp. 2896–2905, Sep. 2013.
[46] CRC Handbook of Chemistry and Physics, 90th ed. FL:
Boca Ration, 2011.
[47] F. Martel, Y. Dubé, L. Boulon, and K. Agbossou, “Hybrid electric vehicle power management strategy including battery lifecycle and degradation model,” Veh. Power
Propuls. Conf. (VPPC), 2011 IEEE, pp. 1 – 8, 2011. [48] M. A. Roscher, S. Member, J. Assfalg, and O. S. Bohlen,
“Detection of Utilizable Capacity Deterioration in Battery Systems,” IEEE Trans. Veh. Technol., vol. 60, no. 1, pp. 98–103, 2011.
[49] J. Kim, S. Member, and B. H. Cho, “State-of-Charge
Estimation and State-of-Health Prediction of a Li-Ion Degraded Battery Based on an EKF Combined With a
Per-Unit System,” IEEE Trans. Veh. Technol., vol. 60, no. 9, pp. 4249–4260, 2011.
[50] Z. Chen, A. Member, Y. Fu, and C. C. Mi, “State of Charge
Estimation of Lithium-Ion Batteries in Electric Drive Vehicles Using Extended Kalman Filtering,” vol. 62, no. 3, pp. 1020–1030, 2013.
[51] R. Xiong, S. Member, H. He, F. Sun, and K. Zhao, “Evaluation on State of Charge Estimation of Batteries With Adaptive Extended Kalman Filter by Experiment Approach,” vol. 62, no. 1, pp. 108–117, 2013.

![Fig. 7. Schematic of the Thevenin model[36-38].](https://thumb-eu.123doks.com/thumbv2/123doknet/14606303.731800/5.918.482.881.75.353/fig-schematic-thevenin-model.webp)