HAL Id: tel-00942719
https://tel.archives-ouvertes.fr/tel-00942719
Submitted on 6 Feb 2014
HAL is a multi-disciplinary open access
archive for the deposit and dissemination of sci-entific research documents, whether they are pub-lished or not. The documents may come from
L’archive ouverte pluridisciplinaire HAL, est destinée au dépôt et à la diffusion de documents scientifiques de niveau recherche, publiés ou non, émanant des établissements d’enseignement et de
Plasticity of human replication program during
differentiation in relation with change in gene expression
and chromatin reorganization
Hanna Julienne
To cite this version:
Hanna Julienne. Plasticity of human replication program during differentiation in relation with change in gene expression and chromatin reorganization. Other [cond-mat.other]. Ecole normale supérieure de lyon - ENS LYON, 2013. English. �NNT : 2013ENSL0868�. �tel-00942719�
Thèse
en vue de l’obtention du grade de
Docteur de l’Université de Lyon, délivré par l’École Normale Supérieure de Lyon
Discipline : Physique
Laboratoire de Physique de l’ENS Lyon
École doctorale de Physique et Astrophysique de Lyon présentée et soutenue publiquement le 11/12/2013
par Madame Hanna Julienne
Plasticité du programme spatio-temporel de réplication
au cours du développement et de la différenciation
cellulaire
Plasticity of the human replication program during
differentiation in relation with change in gene expression
and chromatin reorganization
Directeur de thèse : Alain Arneodo Après l’avis de :
Marie-Noëlle Prioleau Bernard Prum
Devant la commission d’examen formée de : Alain Arneodo, ENS Lyon, Directeur Benjamin Audit, ENS Lyon, Membre
Emmanuel Barillot, Institut Curie Paris, Membre Olivier Hyrien, ENS Paris, Membre
David MacAlpine, Duke Institute for Genome Sciences & Policy, Membre Philippe Pasero, Institut de Génétique Humaine Montpellier, Membre Marie-Noëlle Prioleau, Institut Jacques Monod Paris, Rapporteur Bernard Prum, Université d’Évry Val d’Essonne, Rapporteur
Remerciements
Ces trois années de thèse ont été pour moi l’occasion de mûrir tant sur le plan intellectuel que sur le plan personnel. Cette expérience fut riche de sens et j’aimerais témoigner ma gratitude aux personnes qui m’ont accompagnée tout au long de cette épreuve. En premier lieu, je voudrais remercier Alain Arnéodo pour son encadrement rigoureux et son sens du détail. Sa persévérance et son attention continue à l’égard de mon travail m’ont permis de mener à bien cette thèse. Sans cette constance, nombre de projets seraient restés lettre morte. Benjamin Audit a pris part au travail d’encadrement tout au long de la thèse. La rigueur scientifique avec laquelle il m’a conseillée fait de ce travail un travail rigoureux et sûr. Je le remercie aussi de m’avoir fait part de ses idées salvatrices quand je butais sur un problème scientifique.
Je remercie Bernard Prum et Marie-Noëlle Prioleau d’avoir accepté de rap-porter ma thèse. Marie-Noëlle Prioleau, biologiste expérimentale, a bien voulu se plonger dans ce travail de statistique multivariée appliquée à la biologie. Je la remercie d’avoir accepté de se confronter à ce domaine et de nous avoir livré son avis de biologiste sans lequel une approche interdisciplinaire n’a de sens. Je remercie Bernard Prum d’avoir relu avec une minutie extrême mon travail et de m’avoir fait part de ses remarques scientifiques alors que j’étais encore en cours de rédaction. Ces réflexions m’ont éclairée et guidée pour l’écriture de mon second chapitre de thèse. Je souhaite remercier les examinateurs de mon jury, Emmanuel Barillot, Olivier Hyrien, David MacAlpine et Philippe Pasero de leur venue et de leurs nombreuses questions pertinentes lors de ma soutenance de thèse. Grâce à eux, ma soutenance fut bien plus qu’une simple formalité et fut extrêmement enrichissante scientifiquement.
Je remercie aussi, Fabien Mongelard et Élise Dumont qui m’ont donné l’occasion d’avoir une expérience positive d’enseignement.
ac-cueillantes que j’ai pu côtoyer au laboratoire Joliot-Curie et au laboratoire de Physique de l’ENS Lyon. En particulier, j’aimerais remercier Benoît pour les discussions scientifiques que nous avons échangé. Antoine, précédent étudi-ant d’Alain Arnéodo, m’a beaucoup éclairée sur la pratique scientifique et je reste, à ce jour, admirative de son travail. Je le remercie chaudement pour les nombreuses explications, toujours très claires, dont il m’a fait part durant ma première année de thèse. Je suis pleine de gratitude envers Marianne qui m’a inspirée et m’inspire toujours, a fait germer en moi de nombreuses idées et m’a poussée à ne pas avoir d’a priori sur moi-même. Je suis très heureuse d’avoir partagé mon bureau avec Rasha, Cristina et Laura. Leur joie de vivre et leur chaleur humaine ont été de véritables points d’appuis dans les moments plus difficiles. Je remercie Simona, pour sa passion scientifique et sa gentillesse. Je souhaite bonne chance aux nouvelles arrivantes Guénola et Qiongxu.
Enfin, je remercie ma famille pour son soutien tout au long de ma thèse et surtout mon compagnon de vie, Stephan, à qui je dédie cette thèse.
Contents
I Introduction 11
II Definitions and methodology 21
II.1 Prerequisites on DNA replication . . . 21
II.1.1 Eukaryotic cell cycle and DNA replication . . . 21
II.1.2 Replication program in one cell cycle . . . 26
II.1.3 Mean Replication Timing . . . 27
II.1.4 Replication U-domains . . . 30
II.2 Chromatin structure and replication . . . 35
II.2.1 Chromatin is formed by successive folding layers . . . 35
II.2.2 Chromatin structure and its influence on DNA replication 38 II.3 Data . . . 40
II.3.1 CHiP-seq assay . . . 40
II.3.2 Assessment of gene expression level by RNA-seq . . . 42
II.4 Statistical methodology . . . 43
II.4.1 Pearson correlation and Spearman correlation . . . 44
II.4.2 Principal Component Analysis . . . 46
II.4.3 Clustering . . . 50
III Human Genome Replication Proceeds Through Four Chro-matin States 53 III.1 Introduction . . . 54
III.2 Results/Discussion . . . 55
III.2.2 Epigenetic content of the four prevalent chromatin states 61 III.2.3 Chromatin states are replicated at different times during
S phase . . . 67
III.2.4 Chromatin states are different functionally . . . 67
III.2.5 Compositional content of chromatin states . . . 74
III.2.6 Repartition of chromatin states along human chromosomes 77 III.2.7 Distribution of chromatin states inside replication timing U-domains . . . 80
III.3 Conclusion/Perspectives . . . 82
III.4 Materials and Methods . . . 85
III.4.1 Mean replication timing data and replication U-domain coordinates . . . 85
III.4.2 Histone marks, H2AZ, CTCF, RNAP II, Sin3A and CBX3 ChIP-seq data . . . 85
III.4.3 Epigenetic profile computation at 100 kb resolution . . . 86
III.4.4 Rank transformation and Spearman correlation matrix . 86 III.4.5 Principal component analysis . . . 86
III.4.6 Clustering strategy . . . 87
III.4.7 Markov transition matrix estimation . . . 88
III.4.8 Annotation and Expression data . . . 88
III.4.9 CpG o/e computation and GC content . . . 89
III.4.10Chromatin state blocks . . . 89
III.4.11GO term enrichment . . . 89
IV Epigenetic regulation of the human genome: coherence between promoter activity and large-scale chromatin environment 91 IV.1 Introduction . . . 92
IV.2 Combinatorial analysis of chromatin marks at human gene pro-moters . . . 93
IV.2.1 Fine-scale analysis of chromatin marks combinatorial com-plexity . . . 93
IV.2.3 Epigenetic content of the four prevalent promoter
chro-matin states . . . 98
IV.2.4 A synthetic view of epigenetic regulation of gene activity 101 IV.3 Interplay between promoter activity and large-scale chromatin environment . . . 103
IV.3.1 Distribution of promoter states in the four prevalent large-scale chromatin states . . . 103
IV.3.2 Conditional analysis of promoter activity and large-scale chromatin environment . . . 105
IV.4 Repartition of promoter chromatin states along human chromo-somes . . . 109
IV.4.1 Distribution of promoter chromatin states inside repli-cation timing U-domains . . . 109
IV.4.2 Distribution of promoter chromatin states outside repli-cation U-domains . . . 111
IV.5 Conclusion/Perspectives . . . 113
IV.6 Materials and methods . . . 115
IV.6.1 Annotation and expression data . . . 115
IV.6.2 Histone marks, H2AZ, CTCF, RNAP II, Sin3A and CBX3 ChIP-Seq data . . . 115
IV.6.3 Read density computation around promoters . . . 116
IV.6.4 Rank transformation and Spearman correlation matrix . 116 IV.6.5 Principal component analysis . . . 117
IV.6.6 Definition of promoter chromatin states . . . 117
IV.6.7 CpG o/e computation and GC content . . . 117
IV.6.8 100 kb resolution chromatin states . . . 117
IV.6.9 Promoter count definition . . . 118
IV.6.10Mean replication timing data and replication U-domain coordinates . . . 118
V Embryonic stem cell specific master replication origins at the heart of the loss of pluripotency 119 V.1 Introduction . . . 120
V.2 Results . . . 122 V.2.1 Combinatorial analysis of chromatin marks . . . 122 V.2.2 Epigenetic content of prevalent chromatin states in ESCs
versus differentiated cells . . . 127 V.2.3 Chromatin state coverages and chromatin state changes
between cell lines . . . 131 V.2.4 Replication timing of chromatin states . . . 133 V.2.5 Gene content of chromatin states . . . 136 V.2.6 Spatial organization of chromatin states along human
chromosomes . . . 139 V.2.7 Distributions of chromatin states inside and outside
repli-cation U/N-domains . . . 145 V.3 Discussion . . . 148
V.3.1 Specific genome-wide histone signature of pluripotent plastic chromatin . . . 148 V.3.2 Distinct epigenetic mechanisms of heterochromatin
ex-pansion during differentiation . . . 150 V.3.3 Master replication origins at U/N-domain borders are
determinants of cell-fate commitment . . . 153 V.3.4 ESC specific master replication origins as the
corner-stone of pluripotency maintenance . . . 156 V.4 Conclusion/Perspectives . . . 159 V.5 Materials and methods . . . 162
V.5.1 Mean replication timing data and replication U-domain coordinates . . . 162 V.5.2 Histone marks, H2AZ, CTCF, CHD1, NANOG and OCT4
ChIP-seq data . . . 162 V.5.3 Epigenetic profile computation at 100 kb resolution . . . 163 V.5.4 Treatment of H1hesc data set . . . 163 V.5.5 Construction of a shared epigenetic space for
differenti-ated cell lines . . . 163 V.5.6 Rank transformation and Spearman correlation matrix . 164 V.5.7 Principal component analysis . . . 164
V.5.8 Clustering strategy . . . 164
V.5.9 DNase Hypersentive site data . . . 165
V.5.10 Annotation and Expression data . . . 166
V.5.11 CpG o/e computation and GC content . . . 166
V.5.12 Nucleosome free regions (NFR) . . . 167
V.5.13 Chromatin state blocks . . . 167
V.5.14 Replication N-domains . . . 167
V.5.15 Index of conservation for U-domain borders . . . 167
VI General discussion 169 VI.1 Summary of results . . . 170
VI.2 Putative model for the interplay between chromatin and repli-cation . . . 172
VI.3 Designing a statistical analysis: a question of choice . . . 174
Chapter I
Introduction
The initial sequencing of the human genome, a decade ago, was expected to reveal all functional elements encoded in the genomic sequence [1,2]. Instead, the sequence complexity was much higher than expected making the complete annotation of the human genome, still today, a long way down the road. On the one hand, the human genome sequence put an end to the speculation about the number of protein coding genes, revealing fewer than expected. On the other hand, the number of functional elements was much larger than expected. The quantity of functional elements on a genome was estimated by the fraction of conserved sequences through evolution. Recent comparison with 29 eutherian mammal genomes established that ∼ 4% of the human genome is under purifying selection which exceeds, by far, the content in protein coding sequence (∼ 1.5%). Furthermore, 40% of the functional elements identified have an unknown function [3]. The regulatory amount of DNA is greater than the amount of protein-coding DNA demonstrating that the functional role of the primary DNA sequence is not only to code for proteins but also to regulate nuclear functions including transcription, replication and 3D organization [2,4]. Comparative genomics has the advantage to be independent from the cur-rent state of knowledge on the nuclear molecular machinery. Therefore, com-parative analyses reveal in an unbiased fashion evolutionarily constrained el-ements on the genome. However, comparative genomics is unable to assign a role to every discovered elements. By nature, genomics also let unexplored regulatory phenomena that are not encoded in the sequence. Epigenetics emerged as a necessary answer to genomics weaknesses [5, 6]. Epigenomics precisely compensates genomics blind spots by measuring regulatory processes
that let DNA sequences unaltered and by proposing players that could ex-plain the evolutionary constraints. For instance, a CHiP-seq assay can reveal that some functional elements are the binding sites of a transcription factor. Consortium like ENCODE [7] or roadmap epigenomic [8] provide very useful epigenetic databases by describing experimentally the nucleus state in diverse cell types and under a wide range of conditions. In the human genome, of in-terest here, we have at disposal, gene expression data obtained with RNA-Seq technique [9,10], and genome-wide profiling of Mean-Replication Timing (MRT is the moment of the S-phase at which a locus is replicated, see the precise definition in chapter II) in human [11–14] and in different cell lines. We can also access to chromosomal profiles of many epigenetic modifications [9,15,16], nucleosome positioning [17–19] and chromatin accessibility such as sensitivity to DNase I cleavage [9, 20, 21], that all characterize the primary chromatin structure. In addition, the recent development of the Chromosome Confor-mation Capture (3C) technology [22], its high-throughput extensions [23–25] including Hi-C [26], and derivatives [27, 28] have provided quantitative mea-surement of intra- and inter-chromosomal interaction maps [25–30] from which very instructive information can be extracted on the tertiary (3D) chromatin structure and dynamics [26, 29–33]. The different nuclear functions (for in-stance transcription, replication, 3D organization) are so intertwined that an integrated study seems necessary to assess the interplay between them. All data available, should be, as far as possible, taken into account simultane-ously. For instance, differentiation induces important changes in MRT profiles in chromosomal units of size ∼ 400-800 kb [34–36]. Early to late (EtoL) MRT changes were associated with loss of pluripotency while late to early (LtoE) changes associated with germ-layer specific transcriptional activation [36]. Im-portantly, these dynamic changes in MRT come along with some nuclear repo-sitioning [34–40]. EtoL (resp. LtoE) transitions occur simultaneously with a movement from (resp. towards) interior of the nucleus towards (resp. from) a more peripheral location or near nucleoli [40–44]. Transcription is also in-fluenced by MRT changes. Even though most of genes remain at the same expression level in EtoL (reps. LtoE) regions, the number of repressed (acti-vated) genes in these regions is more than expected [34–36]. Additionally, EtoL MRT changes are accompanied by the formation of compact heterochromatin at the nuclear periphery. The four nuclear functions observed (transcription, replication, 3D organization, and chromatin compaction) change successively and impact each other. Therefore, an integrated study seems to be the only
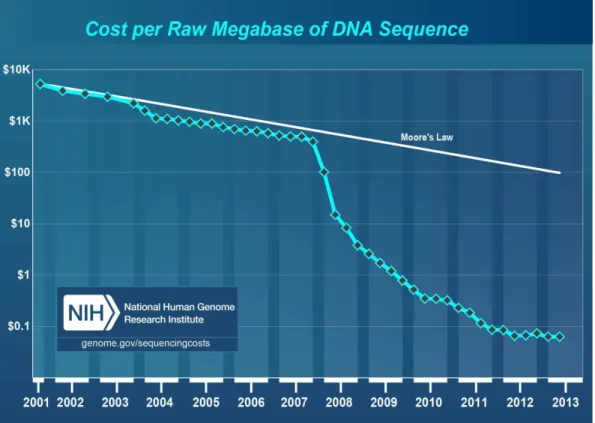
Figure I.1: The cost of DNA sequencing has dramatically fallen during the past twelves years.
way to give the full picture of what is going on in the cell nucleus.
Integrated studies at genome-wide scale are now possible thanks to the high-throughput sequencing technology. Indeed, the falling price of sequencing (Fig. I.1) enables the collection of data on every nuclear process. This trend is not particular to biology, in many fields of application (social network, internet connections, customer transactions) and research (high-throughput sequencing in biology, astronomical data, climate observations), data are intensively col-lected [45], to the point that if we divided all available data colcol-lected between all humans, each person would obtain a quantity of information equivalent to 320 times the library of Alexandria which gathered all human knowledge three century before our era [46]. The promise, inspired by this huge quantity of data, of a better understanding of our surrounding world is accompanied by the daunting task of handling and making sense of these data. In biology, big data require infrastructure and standards to be shared by researchers all over
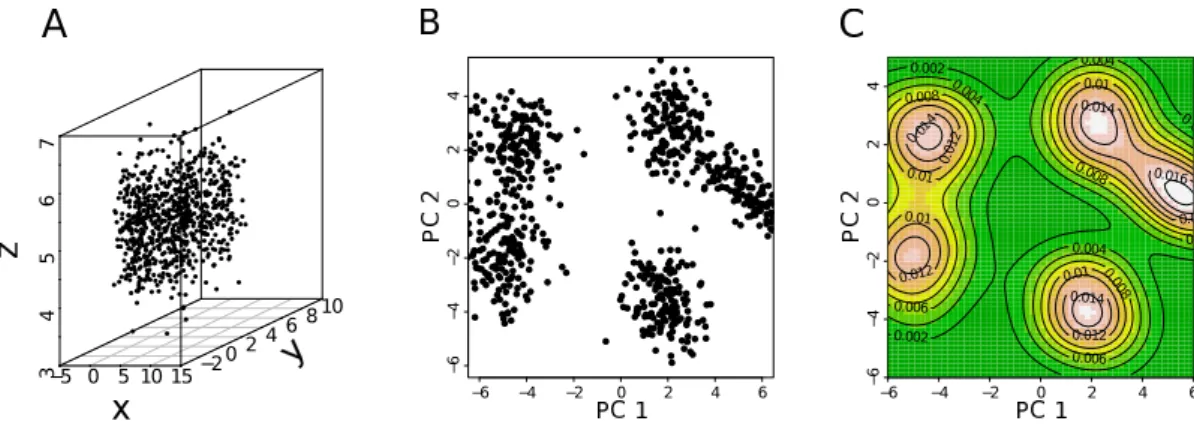
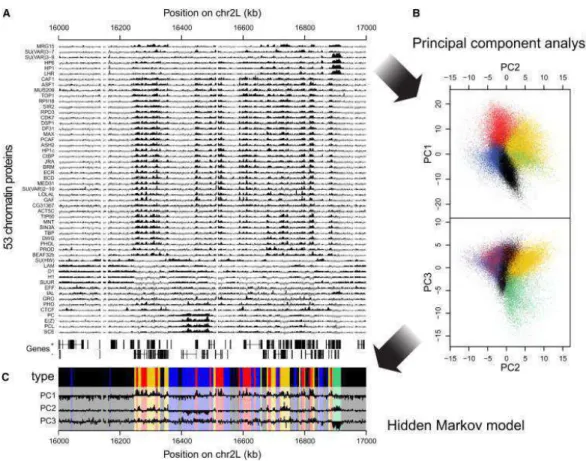
the world [47]. In this perspective, the ENCODE project is a good direction since it provides standards for both experimental procedure and data format-ting and treatment [7, 9, 48, 49]. The second problem with big data in biology is their potential complexity. To illustrate the latent complexity of biological dataset, let us take for example a real integrated study of Drosophila chro-matin by DamID data analysis [50]. DamID is a technique similar to ChIP-seq which identifies the binding sites of a DNA-associated protein. To characterize the chromatin structure of a genome with all players involved (RNA-binding proteins, chromatin remodelers, histone modifications, histone variants, his-tone acetyltransferase, hishis-tone methyltransferase, etc), the authors generated 53 genome-wide DamID profiles. Let us assess the potential complexity of their dataset. To make the argument simpler, we suppose that the DamID sig-nal is binary (the DNA binding protein/histone variant/histone modification is present at one given locus or absent). To study comprehensively the chromatin structure, we have to look at all possible combinations. A simple calculation leads to the conclusion that, for each locus, we would have to consider 253 com-binations i.e. 9007199 billion of cases. In other words, looking at comcom-binations one by one is impossible. Fortunately, chromatin does not explore all possible combinations. Indeed, fluorescence assays show that some proteins colocalize in the nucleus whereas others segregate. Statistically speaking, it means that a lot of information contained in these signals is redundant. Statistical analyses, taking advantage of this redundancy, have shown that this huge combinato-rial complexity can be reduced to a surprisingly small number of predominant chromatin states with shared features namely four in Arabidopsis thaliana [51], five in Caenorhabditis elegans [52] and four [53] or five in our example [50] in Drosophila. Fig. I.2 shows how successful this analysis was, starting from 53 intertwined, unreadable DamID profiles, they ended with 5 distinct chromatin states with an easy interpretation for each one of them.
In this thesis, our focus will be placed on DNA replication. DNA replica-tion, the basis of genetic inheritance, is of fundamental importance to cellular life: when a cell fails to regulate its replication program, it strongly affects the genome integrity, which can lead to cell death or cancer. We would like to shed a new light on human DNA replication by taking advantage of the huge set of data available on human chromatin primary structure. How epigenetic mechanisms and gene expression coordinate with DNA replication has been a long-standing question [4,6,54–57]. Contrary to bacteria, yeast and viruses, the genomes of multi-cellular eukaryotes have no clear consensus DNA sequence
Figure I.2: Example of an efficient dimensionality reduction applied to 53 DamID profiles.
(A) Sample plot of all 53 DamID profiles (log2 enrichment over Dam-only control). Below
the profiles, genes on both strands are depicted as lines with blocks indicating exons. (B) Two-dimensional projections of the data onto the first three principal components. Colored dots indicate the chromatin type of probed loci as inferred by a five-state Hidden Markov Model (HMM). (C) Values of the first three principal components along the region shown in (A). Domains of the different chromatin types are highlighted by the same colors as in (B). Reproduced from [50].
element associated with replication initiation [58, 59]. Metazoan genomes du-plicate through the coordinated activation of hundreds to thousands of replica-tion origins that can be extremely site-specific or poorly defined with a broad site specification [60]. Indeed more origins are prepared in G1-phase than ac-tively needed in S-phase [61]. Epigenetic mechanisms very likely take part in the spatial and temporal control of origin usage and efficiency in relation with gene expression [61–67]. For many years, elucidating the determinants that specify replication origins has been hampered by the very limited number of well established origins in human and more generally in mammals (a few
tens versus a few ten thousands expected) [57, 61, 66, 68]. Only very recently, nascent DNA strands synthetized at origins were purified by various meth-ods to map replication origins genome-wide in different eukaryotic organisms including Arabidopsis thaliana [69], Drosophila [70], mouse [70, 71] and hu-man [16,72–77]. Despite some inconsistency or poor concordance between cer-tain of these studies [57,78], some general trends have emerged confirming the correlation of origin specification with transcriptional organization [56,57,61]. The set of replication origins identified so far are strongly associated with annotated promoters and seem to be enriched in transcription factor binding sites [73,74,79] and in CpG islands [70,71,73]. However a significant proportion of origins do not seem to be controlled in the same way as gene transcription since they are in regions void of DNase-I-hypersensitive sites (DHSs) and of histone marks found at active promoters [56, 73]. Interestingly, it has been recently reported that replication origins may contain specific nucleotide se-quences. Actually G-rich consensus motifs were shown to be associated with Drosophila, mouse and human origins [70, 77, 80]. These analyses have opened new perspectives towards the identification of mechanisms governing origin selection in mammals.
The recent blooming of genome-wide mean-replication timing (MRT) data in yeast [81], plants [82], worm [83], fly [84, 85], mouse [34, 35, 86] and hu-man [11–14] has provided the opportunity to establish links between the spatio-temporal program of replication, transcription and chromatin structure [4,6,56, 57,87]. It is now well established that in higher eukaryotes, GC-rich, gene-rich and early replicating regions colocalize with, as a counterpart, a colocaliza-tion of AT-rich, gene poor and late replicating regions [11, 86, 87]. But recent studies in mammals [12, 34] and Drosophila [88], have shown that during dif-ferentiation, some genes change expression without changes in MRT and vice versa, thereby indicating that transcription is not the only controlling factor and that the chromatin structure is likely to be part of the game [6,56,57,87]. In good agreement with previous studies in Drosophila [50, 88], genome-wide MRT profiles along mouse and human chromosomes in different cell lines re-veal a correlation with epigenetic modifications [89]. Early replicating regions tend to be enriched in open chromatin marks H3K4me1, H3K4me2, H3K4me3, H3K36me3, H4K20me1 and H3K9 and H3K27 acetylation, whereas late repli-cating zones are mostly associated with H3K9me2 and to a lesser extent with H3K9me3 [34,36,62]. The dynamic changes in MRT observed during develop-ment come along with some subnuclear repositioning [34–40], early replicating
euchromatin domains being generally at the interior of the nucleus whereas late replicating heterochromatic domains are more peripheral or near nucle-oli [40–44]. Recent experimental studies of long-range chromatin interactions using chromosome conformation capture techniques [26, 30, 36, 90] have con-firmed that 3D chromatin tertiary structure plays an important role in reg-ulating replication timing. In particular, replicon size, which is dictated by the spacing between active origins, correlates with the length of chromatin loops [67,91,92]. But as questioned in Refs [30,93,94], the dichotomic picture proposed in early studies [26,36,90], where early and late replicating loci occur in separated compartments of open and closed chromatin respectively, is some-how too simple as previously pointed out in a detailed analysis of replication fork velocity [93]. Identifying the chromatin regulators of the spatio-temporal program of DNA replication will be a formidable step towards understand-ing the so-called replicon and replication foci [43, 95–98] in relation with their transcription counterpart, the transcription factories [43, 98–100].
In a recent work [94,101], the analysis of genome-wide MRT data in seven human cell types including Embryonic Stem Cell (ESC), somatic and HeLa cells, revealed that, in each cell type, about half of the genome can be paved by the so-called replication U-domains where the MRT is U-shaped and its deriva-tive N-shaped like the nucleotide compositional asymmetry in the germline skew N-domains [102–106]. These N-shaped patterns are the consequence of large-scale gradients of replication fork polarity [94, 107, 108] originating from early initiation zones separated by several megabases. In that regard, N/U-domains can be thought as an equivalent of bacterial replicon [109]. These “master” replication origins [4, 110] at U/N-domain borders were found to be hypersensitive to DNase I cleavage, to be transcriptionally active and to display a significant enrichment in the insulator binding protein CTCF, the hallmarks of localized (∼ 200-300 kb) open chromatin structures [94, 111, 112]. A cas-cade model of origin firing was recently proposed to account for the observed progressive inversion of replication fork polarity inside U/N-domains [93,109]. This model involves the superposition of specific and efficient initiations at do-main borders with random and less efficient initiations elsewhere, in addition to firing stimulated by propagating forks. The comparative analysis of chro-matin interaction Hi-C [94] and 4C [30] data with MRT profiles further con-firmed that these replication U/N-domains actually correspond to topological domains of self-interacting chromatin. As recently demonstrated using a graph theoretical approach [113], master replication origins at U/N-domain borders
are long-range interconnected hubs of chromatin interactions both within and between different chromosomes. The additional observation of a remarkable gene organization inside U/N-domains with a significant enrichment of ex-pressed genes nearby their borders [94, 104, 114] prompted the interpretation of these replication domains as chromatin units of highly coordinated regula-tion of transcripregula-tion and replicaregula-tion [94, 109, 110]. Replicaregula-tion U/N-domains are also likely to be central to genome regulation since the dynamical changes in MRT profiles observed during differentiation [34–36, 115] mainly occur in the 50% of the genome that are covered by U/N-domains [94]. Overall, these results point out that U/N-domain borders offer a good framework to the un-derstanding of the plasticity of the spatio-temporal replication program, gene expression and chromatin organization across different cell lines during devel-opment and lineage commitment.
In this thesis, we conduct an integrative analysis of the interplay between the chromatin primary structure and the MRT. To do so, we simplify a dataset of several genome-wide CHiP-seq profiles to four prevalent chromatin states that have strongly different MRT distributions. We use U/N-domains as a guide to study the spatial distribution of these chromatin states with respect to the spatio-temporal replication program. The genome-wide CHiP-seq data allow us to assess the distribution of these chromatin states in the 50% of the human genome not covered by U/N-domains. U/N-domains are also our frame-work to describe coordinated changes of chromatin composition and replication program through development.
The manuscript is organized in six chapters. The first chapter is the cur-rent introduction. Chapter II is devoted to definitions and methodological discussions that explain biological (eukaryotic DNA replication, mean replica-tion timing, U-domains, chromatin primary structure and its potential causal link to replication) and statistical (Spearman correlation, Principal compo-nent analysis, clustering) concepts used in the “results” chapters. The results are reported in Chapters III, IV and V. Chapter III deals with an integrative analysis of the genome-wide distributions of thirteen epigenetic marks, at 100 kb resolution, in the human cell line K562. This integrative analysis identifies four major groups of chromatin marks with distinct features. These chromatin states have different MRT, namely from early to late replicating, replication proceeds through a transcriptionally active euchromatin state (C1), a repres-sive type of chromatin (C2) associated with polycomb complexes, a silent state
(C3) not enriched in any available marks, and a gene poor HP1-associated heterochromatin state (C4). Chapter IV is a reproduction of our integrative analysis of epigenetic data in the K562 human cell line at a smaller scale (6 kb) characteristic of gene promoters. By investigating the coherence between the chromatin states obtained at 100 kb and 6 kb, we will assess to what extent pro-moter activity conditions its large-scale chromatin environment and vice-versa. In Chapter V, we extend this study to different cell types including the ESC H1hesc, three hematopoietic cell lines (K562, Gm1278, Monocyte CD14+), a mammary epithelial cell line (Hmec) and an adult fibroblast cell line (Nhdfad). By exploring the global reorganization of replication U/N-domains in these dif-ferent cell types in relation to coordinated changes in chromatin state and gene expression, we shed a new light on the chromatin-mediated epigenetic regula-tion of transcripregula-tion and replicaregula-tion during differentiaregula-tion. Because they are likely to be the cornerstone to a better understanding of pluripotency mainte-nance and lineage commitment, we will pay special attention to the “master” replication initiation zones that border U/N-domains and specially to those that are specific to ESCs. Chapter VI is a general discussion that deals with the interpretation of the reported results. Do the results, gathered in this the-sis, give any information on the causality between primary chromatin structure and replication? Some perspectives will be also given on how the methodology described in Chapters III, IV and V could be applied to cancer.
Chapter II
Definitions and methodology
The current chapter explains the biological concepts and statistical methodol-ogy necessary to understand the chapters reporting results and the discussion. The first section presents basic prerequisites on DNA replication, and gives the definition of the Mean Replication Timing (MRT) and of the U-domains. The second section discusses chromatin structure and plausible causal links between the primary structure of chromatin and DNA replication. The third section is a brief presentation of the experimental protocols used to produce datasets analyzed in this thesis. The fourth part of the chapter is an ed-ucational presentation, on simple artificial examples, of the tools (principal component analysis and clustering) used in the “results” chapters.
II.1
Prerequisites on DNA replication
II.1.1
Eukaryotic cell cycle and DNA replication
Living cells, prokaryotes1 and eukaryotes2, use a universal mechanism to mul-tiply. Cells duplicate their content, among which DNA, and divide. In eu-karyotic cells, this phenomenon is decomposed into 4 phases which form the cell cycle (Fig. II.1). Cell division occurs during the mitosis or M phase. The rest of the cell cycle, called the interphase, is subdivided in the G1, S, and G2
1
The prokaryotes are a group of organisms (bacteria for example) whose cells lack a membrane-bound nucleus (karyon).
2
An eukaryote is an organism (yeast or human for example) whose cells contain a nucleus and other structures (organelles) enclosed within membranes.
Figure II.1: The four phases of an eukaryotic cell cycle. The union of G1, S and G2 is called the interphase, during which the cell grows continuously. The cell divides in two new cells in M phase. The S phase, of particular interest here, is the phase where DNA is replicated.
phases. Cells grow continuously during the interphase, doubling in size and preparing for the next division. Yet, DNA duplication occurs only during the S phase.
DNA replication is an essential genomic function responsible for the accu-rate transmission of genetic information through successive cell generations. Replication follows a simple pattern in bacteria called the “replicon” model [116]; the process starts by the binding of some “initiator” protein complex to a consensus “replicator” DNA sequence called origin of replication. On a bacterial genome, there is only one origin of replication. The recruitment of additional factors initiates the bi-directional progression of two divergent repli-cation forks along the chromosome. Since most bacterial genomes are circular, the two forks join at the terminus of replication usually located at the opposite of the origin on the circular chromosome. One strand is replicated continu-ously (leading strand), while the other strand is replicated in discrete steps towards the origin (lagging strand) (Fig. II.2B).
In eukaryotic cells, replication is initiated at a number of replication origins (more than 30000 in the human genome) and propagates until two converging forks collide at a terminus of replication [59,117]. During G1 phase, the Origin
✂✄ ☎☎✆✝ ☎✞ ✟ ✠✄✝ ✡
☛✠☞✌✂✆✍✄ ✟☞✡✡✆ ✞✍✎✝ ✟✆✝✏✎ ✏✞✂✑✒
✓✔✕ ✖✗ ✘✙✚ ✛✜✕✘✖
✢✜✔✣✓✗✤✕ ✛✔ ✖✤✥✘✛✗ ✘✦ ✥✦✚✓✧★
Figure II.2: (A) The six-subunit complex called the origin recognition complex (ORC) serves as a platform for the assembly of pre-replication complexes. In metazoans, the binding of the large subunit of ORC, ORC1, to chromatin is cell-cycle regulated. During the mitosis/G1-phase transition, chromatin-bound ORC recruits CDC6 and CDT1, which facilitate the loading of a helicase complex consisting of 2 to 7 MCM (minichromosome maintenance) proteins. The resulting complex is termed the pre-replication complex (PreRC). Reproduced from [66]. (B) Replication bubble structure and summary of the unique nucleic acid features found near origins of replication. The leading strands of DNA synthesis quickly become larger than Okazaki fragments and can be isolated as small single-stranded molecules that can be verified to be nascent either by metabolic labeling or by virtue of the fact that
nascent strands have small stretches of RNA at their 5′ ends that render them resistant to
λ-exonuclease. The topological structure of replication origins shortly after initiation is a bubble structure, which can be trapped in gelling agarose. Reproduced from [57].
Recognition Complex (ORC) binds to DNA. The binding of ORC is followed by the recruitment of several proteins including the helicase MCM (Minichro-mosome maintenance). These proteins form the pre-replication complex (pre-RC) pictured in Fig. II.2A. The pre-RC constitutes a potential replication origin that may be activated during S-phase. In fact, there are more pre-RC deposited on DNA than actively needed during the S-phase. The subsequent activation of the pre-RC during S-phase leads to the recruitment of DNA poly-merase and other proteins necessary to the DNA synthesis. The activation of different replication origins occurs at diverse moments of the S phase and is not deterministic [84, 109, 118–121]. The pre-RC activation can be triggered by the activation of neighboring replication origins [93]. Also, the activation depends on the neighboring transcriptional activity and on the local chromatin structure [84, 119–121].
Sequence requirements for a replication origin vary significantly between different eukaryotic organisms. In the unicellular eukaryote S. cerevisiae, the replication origins spread over 100-150 bp and present some highly conserved motifs [59]. However, the prokaryote-like replication of S. cerevisiae is an ex-ception among eukaryotes. In the fission yeast Schizosaccharomyces pombe, there is no clear consensus sequence and the replication origins spread over at least 800 to 1000 bp [59]. In multicellular organisms, the nature of initi-ation sites of DNA repliciniti-ation is even more complex [117]. Metazoan3 repli-cation origins are rather poorly defined and initiation may occur at multi-ple sites, each site being distributed over a thousand of base pairs [60, 109]. The initiation of replication at random and closely spaced sites was repeat-edly observed in Drosophila and Xenopus early embryo cells, presumably to allow for extremely rapid S phase, suggesting that any DNA sequence can function as a replicator [109, 118, 122, 123]. A developmental change occurs around midblastula4 transition that coincides with some remodeling of the chromatin structure, transcription ability and selection of preferential initia-tion sites [118,123]. Thus, although it is clear that some sites consistently act as replication origins in most eukaryotic cells, the mechanisms that select these sites and the sequences that determine their location remain elusive in many cell types [63, 117, 124]. As recently proposed by many authors [64, 65, 125],
3
Metazoan are multicellular organisms belonging to the kingdom Animalia (according to Linnaeus’ classification).
4
The blastula is a hollow sphere of cells formed during an early stage of embryonic development in animals.
the need to fulfill specific requirements that result from cell diversification may have led high eukaryotes to develop various epigenetic controls over the repli-cation origin selection rather than to conserve specific replirepli-cation sequence.
This might explain that for many years, very few replication origins have been identified in multicellular eukaryotes, namely around 20 in metazoa and only about 10 in human. Several techniques have been used to detect repli-cation origins. A first technique takes advantage of the presence of the ORC proteins at the origins to detect their position by CHiP-seq5 [126–128]. Alter-natively, in recent studies, nascent DNA strands synthesized at origins were purified by various methods to map replication origins genome-wide in differ-ent eukaryotic organisms including Arabidopsis thaliana [69], Drosophila [70], mouse [35,70,71] and human [11–14,16,72–77]. Another approach to discover replication origins is to trap replication bubbles [75, 129]. The DNA particu-larities around replication origins that have been used to position origins by these different techniques are summarized in Fig. II.2B. Despite some incon-sistencies or poor concordance between certain of these studies [57, 78], some general trends have emerged confirming the correlation of origin specification with transcriptional organization [56, 57, 61]. The set of replication origins identified so far are strongly associated with annotated promoters and seem to be enriched in transcription factor binding sites [73, 74, 79] and in CpG islands [70, 71, 73].
An alternative to characterize replication is to estimate at what moment of the S-phase a locus is replicated (replication timing). A wealth of genome-wide replication timing data is available for several eukaryotic organisms ranging from yeast [81], to plants [82], to worm [83], to drosophila [84], to mouse [34,35], and to human [11–14, 130]. Recent genome-wide replication timing data has been collected in several human cell types [11–14, 36, 90, 130], which enables to study changes in the replication program across differentiation. In this thesis, we focus our study on the current abundance of replication timing data. The replication timing at a given locus depends on the local initiation properties, but it also depends on the initiation properties of neighboring sites as replication forks propagate [131, 132]. Therefore replication timing can be difficult to interpret.
To clarify the definitions of replication timing and spatio-temporal replica-tion program, we now describe an idealized example for one cell cycle.
5
Figure II.3: Replication program in one cell cycle. (A) Replication timing tR(x), (B) replica-tion fork orientareplica-tion o(x) and (C) spatial locareplica-tion of replicareplica-tion origins (upward arrows) and
termination sites (downward arrows). Oi = (xi, ti) corresponds to the origin i positioned
at location xi and firing at time ti. Fork coming form Oi meets the fork coming from Oi+1
at termination site Ti with space-time coordinates (yi, ui) given in Eq. (II.1). Note that we
can deduce the fork orientation in (B) (resp. origin and termination site locations in (C)) by simply taking successive derivatives of the timing profile in (A) (Eqs. (II.3) and (II.4)).
II.1.2
Replication program in one cell cycle
firing times tiof the n activated bidirectional replication origins Oi (Fig. II.3A). From each bidirectional origin, two divergent forks propagate at velocity v, un-til they meet a fork of the opposite orientation. Let Ti be the termination locus where the fork coming from Oi meets the fork coming from Oi+1. Straightfor-ward calculations lead to the space-time coordinates (yi, ui) for Ti:
yi = 1 2(xi+1+ xi) + v 2(ti+1− ti), ui = 1 2v(xi+1− xi) + 1
2(ti+1+ ti). (II.1) In Fig. II.3, the x-axis is conventionally oriented in the 5′ → 3′ direction of the reference strand. Hence sense (+) and antisense (−) forks, correspond respectively to rightward and leftward moving forks in Fig. II.3B.
Around origin Oi (for x ∈ [yi−1, yi]), the replication timing tR(x) and the fork orientation o(x) = ±1 are given by:
tR(x) = ti+ |x − xi|/v and o(x) = sign(x − xi). (II.2)
Finally, using the Dirac distribution δ to represent origin locations δ(x−xi) and termination sites δ(y − yi) (Fig. II.3C), we obtain the following fundamental relationships: v d dxtR(x) = o(x), (II.3) v d 2 dx2tR(x) = X i δ(x − xi) −X i δ(x − yi). (II.4)
In other words, we can extract, up to a multiplicative constant, the fork ori-entation o(x) (Fig. II.3B) and the location of origin and termination sites (Fig. II.3C) by simply taking successive derivatives (Eqs. (II.3) and (II.4)) of the timing profile tR(x) (Fig. II.3A).
II.1.3
Mean Replication Timing
This paragraph describes how we have extracted Mean Replication Timing (MRT) [94] from experimental data provided in [14].
Current technology is not able to measure the spatio-temporal replication program in one cell. The characterization of replication timing is done on a large population of cells (a few millions). Briefly, the method used to generate experimental data in [14] is as follows:
∗ A large population of cells, each at a different moment of the cell cy-cle, is temporarily cultivated in presence of BrdU which is a modified nucleotide. Cells in S-phase incorporate BrdU in place of thymidine in newly synthesized DNA which is, hence, identifiable.
∗ Cells are classified according to their DNA content by Fluorescence-Activated Cell Sorting (FACS) which is equivalent to classify them ac-cording to their cell cycle phase. Indeed, cells start with one copy of their genome in G1-phase, they gradually double their DNA content through S-phase and have two genome copies in G2. Then they undergo mito-sis that sets their DNA content back to one copy. The classification by FACS has a limited time resolution. In the study of interest [14], they dispose of 6 bin spanning the S-phase (Fig II.4A).
∗ Once the cell population is classified into 6 bins (G1b, S1, S2, S3, S4, G2), the newly synthesized DNA (i.e. DNA that contains BrdU nucleotides) is sequenced and mapped on the genome. For each temporal bin, the density of tags is computed genome wide (Fig II.4B).
To efficiently summarize the information contained in the six temporal bin, we applied the following post-treatment in [94] :
∗ A value is assigned to each temporal bin. By convention, the very be-ginning of S-phase is zero and the very end is 1. Since the temporal resolution is of 6 bins, each bin are one sixth long, the values attributed are 1/12 for G1b, 3/12 for S1, 5/12 for S2, 7/12 for S3, 9/12 for S4 and 11/12 for G2.
∗ In 100 kb sliding windows incremented by 10kb steps, tags are retrieved for each of the six temporal bins.
∗ The mean replication timing for one given window is the sum of the proportions of tags found in each bin multiplied by the corresponding bin timing.
For instance, if in a fairly early 100 kb window the read proportion in the six bins is as follows: 20% , 50%, 20%, 7%, 2%, 1%, the MRT is:
MRT = 0.2× 1 12+0.5× 3 12+0.2× 5 12+0.07× 7 12+0.02× 9 12+0.01× 11 12 = 0.29
Figure II.4: (A) Classification of the cell population according to their DNA content. The fractions retained for MRT computation are those marked with G1b, S1, S2, S3, S4, and G2 labels. In each fraction, the DNA containing BrdU is retrieved by immunoprecipitation. Then, the DNA is sequenced. (B) Brut sequence tag density on the LMRP locus in GM06690. (A) and (B) are reproduced from [14]. (C) Post treatment applied in [94] to compute MRT. Normalized tag densities on a 25 Mb long fragment of chromosome 10 for the GM06990 cell line, and the corresponding computed MRT (white line).
MRT interpretation
Even though the replication timing in each cell is a random variable, the MRT is a good indication of the replication timing population distribution. Indeed, BrdU reads are generally located in few temporal bins at one locus [94]. This suggests that the replication spatio-temporal program is fairly constant in cells of the same cell line. Suppose we observe a MRT = 0.5. Theoretically, it could mean that the replication timing distribution is bimodal with one half of the cell population replicating early and the other half late. Alternatively, it could mean that the replication timing distribution is uniform (i.e the chances of being replicated in any of the six bin are equal). In practice, a MRT of 0.5 means that, in the vast majority of cells, the locus is replicated in mid-S phase.
II.1.4
Replication U-domains
Replication is an asymmetrical process. Indeed, one strand is replicated contin-uously (leading strand) while the other strand is replicated in a step like fashion (Fig. II.2B). This phenomenon imprints the DNA sequence through evolution: the mutation rates are different on the leading and on the lagging strands. This discrepancy induces a compositional skew S = T −A
T +A +
G−C
G+C [4, 102–107] that reflects the replication fork polarity [94, 107].
Compositional asymmetry in bacteria
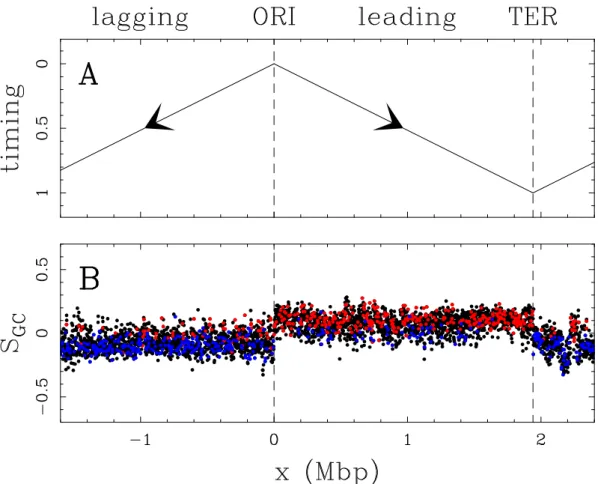
A clear relationship between replication and compositional asymmetry was first established in prokaryotic genomes by Lobry [134]. In bacteria, the spatio-temporal replication program is particularly simple (Fig. II.5A). The replica-tion origin is defined by a consensus sequence, replicareplica-tion therefore always initiates at the same genomic locus (ORI), two divergent forks then replicate the DNA until they meet at the replication terminus (TER). As shown in Fig. II.5B for Bacillus subtilis, many prokaryotic genomes are divided into two halves: one presents an excess of guanine over cytosine, and the other one, on the opposite, an excess of cytosine over guanine. The GC skew, de-fined as SGC = G−CG+C, is thus positive on one half of the genome and nega-tive on the other. Remarkably, the GC skew profile is tightly related to the spatio-temporal replication program: the leading strand has positive GC skew whereas the lagging strand has negative GC skew.
Figure II.5: Comparing GC skew SGC = G−CG+C and replication timing in Bacillus subtilis genome. (A) Schematic representation of the replicon model: divergent bidirectional pro-gression of the two replication forks from the replication origin (ORI) to the replication
terminus (TER). The replication timing is indicated from early, 0 to late, 1. (B) SGC
calculated in 1 kbp windows along the genomic sequence of Bacillus subtilis. Black points correspond to intergenic regions, red (resp. blue) points correspond to (+) (resp. (−)) genes, which coding sequences are on the published (resp. complementary) strand. Reproduced from [133].
Compositional asymmetry in the human genome
By contrast, the spatio-temporal replication program in eukaryotes is much more complex. Several initiation sites are used in each cell cycle, and they fire at different times during the S phase. Furthermore, the genomic positions and firing times of the initiation sites change from one cell cycle to another. Yet, the relationship observed between the compositional asymmetry and the replication program in bacteria can be generalized to eukaryotic genomes.
sev-Figure II.6: Comparing compositional skew S = T −AT +A+G−CG+C and mean replication timing (MRT) in the human genome. (A) MRT profiles along a 11.4 Mbp long fragment of human chromosome 10, from early (0) to late (1) for BG02 embryonic stem cell (green), K562 erythroid (red) and GM06990 lymphoblastoid (blue) cell lines. Replication timing data was retrieved from [14]. (B) S calculated in 1 kbp windows of repeat-masked sequence. The colors correspond to intergenic (black), (+) sense genes (red) and (−) antisense genes (blue). Six skew N-domains (horizontal black bars) were detected in this genomic region. Reproduced from [133].
eral megabases. Previous works have led to the objective delineation of these N-shaped skew domains [102–105,135]. Based on the analogy with the bacterial case (the upward jump of the GC skew colocalizes with the ORI in Fig. II.5), the N-domains borders (upward jumps of the skew) were proposed to be repli-cation origins, evolutionary conserved and active in the germline [102–104]. However, we know today that the N-shape skew profile is not a trivial exten-sion of the replicon model in bacteria. For instance, the typical inter-origin distance (∼ 40 kb) measured using DNA combing [93], is much smaller that the typical N-domain size (1−3 Mb), which implies that many other initiation events occur inside the N-domains. A recent theoretical analysis [107] demon-strates that the skew profile, in bacteria and in the human, actually results
from the replication fork polarity profile. In fact, the fork polarity follows the same trend as the skew in domains going from a positive value at the N-domain left border and decreasing to negative opposite value at the N-N-domains right border.
We observe in Fig. II.6 a clear relationship between the compositional asym-metry and the replication timing in the human genome: a N-shaped composi-tional skew S = G−C
G+C+
T −A
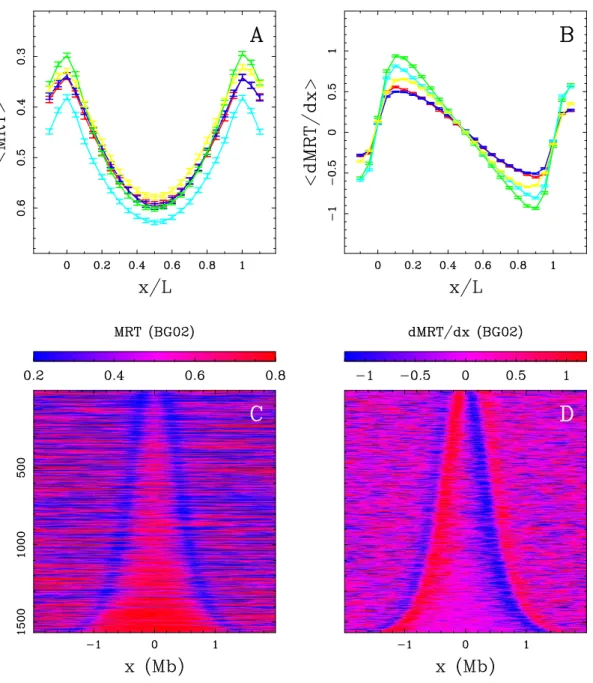
T +A profile remarkably corresponds to a U-shaped repli-cation timing profile. A previous analysis [94] demonstrates that the derivative of the replication timing is the replication fork polarity (Fig II.3). Importantly, this relation remains true for a population of cells. Mathematically, by tak-ing the derivative of a U-shaped function, a N-shaped pattern is obtained. Therefore the mean polarity of the replication forks is a N-shaped function in U-domains (Fig II.7), confirming the existence of a gradient of replication fork polarity as in N-domains. However, in contrast to N-domains, U-domains are specific to one given cell line: U-domains are the somatic counterpart of N-domains. N-domains are thought to reflect the germline replication program since they are imprinted in the genomic sequence. Indeed, only the mutations occurring in the germline are transmitted and can accumulate to create the skew N-domains [106]. A recent study aiming at automatically detecting U-domains in seven human cell lines showed that U-U-domains cover roughly 50% of the genome [94, 101]. U-domains were objectively delineated using wavelet transform in the human genome for seven cell lines [101]. First, sharp peaks of the MRT profile, corresponding to initiation zones, were detected by finding regions of strong positive curvature (Eq. (II.4)). Subsequently, in between timing peaks, we retained only the domains where the MRT profile had a global negative curvature (i.e. was U-shaped). These genomic domains, U/N-domains, were shown to exhibit a striking gene organization and chromatin landscape [94, 104, 112, 114, 133, 136]. U/N-domains are units of the spatio-temporal replication program that share the same overall organization and are the eukaryotic equivalent of replicons. Therefore, they are preferential tools to study replication genome-wide.
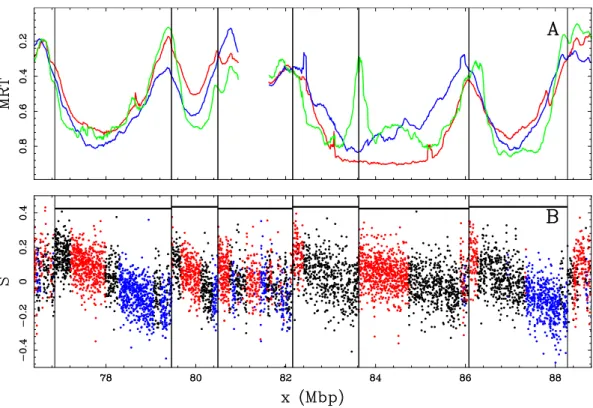
Figure II.7: Replication timing U-domains in different human cell lines. (A) Average MRT
profiles (± SEM) inside detected replication U-domains. (B) Corresponding average dMRT
dx profiles (± SEM). In (A) and (B), each cell line is identified by a color: BG02 (green), K562 (red), GM06990 (blue), BJ R2 (magenta), and HeLa R2 (cyan). (C) The 2534 BG02 U-domains were centered and ordered vertically from the smallest (top) to the longest (bottom). The MRT profile of each domain is figured along a horizontal line using the MRT (BG02)
color map. (D) Same as in (C) but for using the dMRT
dx (BG02) color map. Reproduced
II.2
Chromatin structure and replication
II.2.1
Chromatin is formed by successive folding layers
The DNA of eukaryotic cells is enclosed in the cell nucleus. Generally, eu-karyotes have their genome organized in several separated chromosomes. Yet, even in separated chromosomes, the length of the longest DNA molecule in eukaryotic genome far exceeds the diameter of the cell nucleus which is on average 6 µm for mammalian cells. For instance the longest human chromo-some6 of 2.8 × 10⁸ base pairs, which is almost 10 cm in length [137, 138]. The length of eukaryotic genomes implies two contradictory imperatives [4]. The genome must be condensed in such a way that it fits inside the nucleus while being highly organized so that every nuclear function (e.g. replication, mitosis, transcription) can take place efficiently.
The organized compaction must also be highly dynamic. Indeed, the com-paction fold is 10000 during mitosis (chromosome must be tightly condensed to enable their proper distribution between the two daughter cells) and “only" 300 during the interphase7. Moreover, during the interphase, the compaction of the genome is heterogeneous. Transcriptionally or regulatory active regions are accessible and decondensed (euchromatin) while inactive regions and gene deserts are condensed (heterochromatin). The level of compaction during the interphase has to be adjustable to react to environmental cues.
This high degree of organization coupled to a tight compaction is obtained by the association of DNA with proteins. The complex formed by the DNA and the proteins attached to it is named chromatin. Actually, the weight of the proteins associated to DNA equals the weight of the DNA alone [138]. Chromatin is organized in successive layers of folding of increasing scale that are depicted in Fig. II.8. Each layer has its functional relevance and carries regulatory information [5, 6].
The first layer is the simple DNA helix. This is not really a chromatin layer since it does not contain proteins but it already holds epigenetic infor-mation. CpG dinucleotides can bear a methylation on the C nucleotide. This modification is present in inactive regions. On the second layer DNA wraps
6
The longest human chromosome is chromosome 1. Human chromosomes are numbered from the longest to the shortest.
7
The "compaction fold" is the ratio of the actual length end to end of the chromosome in the nucleus over the length of the chromosome DNA laid out as a perfect double helix.
Figure II.8: Chromatin structure layers related to transcriptional activity. On the left part of the drawing, features associated with inactive regions (heterochromatin) are depicted; on the right, active regions (euchromatin) are described. See text for the detailed description of each layer of the chromatin. Sketch reproduced from [6]
around a bead-like structure formed by an octamer of proteins called histones. DNA turns about twice around each octamer (as pictured on the second row in Fig. II.8) [139–141]. The complex formed by the DNA and the eight histones is called nucleosome. Each canonical nucleosome contains 147 bp of DNA. The simple association formed between nucleosomes and DNA is a second layer of compaction called “bead-on-a-string". Nucleosomes can organize further in a third layer as a fiber of 30 nm whose exact structure is still debated. In active regions, chromatin has the least compacted form i.e. bead-on-string structure while inactive regions are condensed in a 30 nm fiber. Finally, the three-dimensional organization of DNA and nucleosomes is referred to as the fourth layer of chromatin. Chromatin has a specific spatial distribution in the nucleus: active regions are at the center and gene deserts are attached to the nucleus periphery with lamina fibers8 [6].
Histones are the most prevalent proteins in chromatin. There are four types of histones: H3, H4, H2A, and H2B. H3 and H4 associate together to form a dimer; two dimers of H3-H4 associate to form a tetramer which is, in turn, surrounded by two dimers of H2A and H2B. Histones convey a lot of epi-genetic information by two mechanisms. First, one of the canonical histones can be replaced by a histone variant9. This replacement slightly modifies the nucleosome structure and thus its function. For instance, transcriptionally ac-tive regions are enriched in the H3.3 and H2AZ variants instead of H3 and H2A, respectively. Second, histones are formed of a globular part that consti-tutes the nucleosome core and of a flexible "tail" that reaches outside toward the nuclear environment (rows 3 and 4 in Fig. II.8). These tails carry diverse modifications that have a functional meaning. There is a specific annotation to indicate modifications: H3K9ac means that a histone H3 carries a modification on its ninth amino acid and that the modification is an acetylation. Histone modifications can make the chromatin looser (acetylation modifications) or can serve as an anchor to regulatory proteins. For instance, H3K27me3 is used as a docking station by the Polycomb Repressive Complex PRC1 that silences developmental genes10.
8
The nuclear lamina is a dense fibrillar network inside the nucleus composed of interme-diate filaments and membrane associated proteins.
9
Proteins are formed by a chain of molecular units called amino-acids. Histone variants have the same amino acid sequence as the canonical histone with a couple of substitutions.
10
To have a complete summary of the diverse histone modifications and their functions see the excellent review [55].
Other diverse proteins are associated to DNA. Some are needed to tran-scribe/ activate genes (transcription factors, enhancer proteins), some repair and replicate DNA, some repress genes by compacting the chromatin (HP1, polycomb) and others modify histones [5]. For instance the families of proteins that add and remove acetyl groups to histone tails are named HAT (Histone acetyl transferase) and HDAC (Histone deacetylase). There is also a class of proteins that move nucleosomes along DNA or eject them called chromatin re-modelers. Finally, there is a class of proteins that organize the fourth layer of chromatin, namely its three dimensional folding (cohesin and CTCF). CTCF proteins form DNA loops that have various regulatory effects [142].
The successive layers of folding and the diverse proteins interact together to form the chromatin structure. In this thesis, we focus on the positioning of histone modifications and DNA binding proteins along the human genome. The influence of chromatin structure on the regulation of transcription has been widely assessed. However, chromatin structure serves other functions. We now describe how chromatin structure can influence DNA replication.
II.2.2
Chromatin structure and its influence on DNA
replication
In this paragraph, we state the principles by which chromatin structure could be causally linked to replication. We will not make an exhaustive review on the subject. The interested reader should consult the excellent review [62].
Even though the DNA sequence may play a role in the positioning of ori-gins [77,124], there is no consensus sequence for replication oriori-gins in metazoan. Origin positioning is cell line specific: even if there was a consensus sequence, an additional regulation mechanism would be needed [124]. Therefore, mecha-nisms that position and control the time of firing of origins must be epigenetic and linked to chromatin structure [61, 63–67]. Chromatin primary structure can influence replication by facilitating or preventing ORC deposition and ori-gin firing. Indeed, ORC shows little or no sequence specificity in mammals, which indicates that its deposition must be epigenetically regulated. Experi-ments demonstrate that origin firing depends on chromatin environment [62]. Moreover, ORC positioning has been linked to nucleosome dynamics and can be efficiently predicted by a model taking only the enrichment in chromatin remodelers as a parameter [127]. A recent mapping of ORC in human revealed
that early origins are close to CpG-rich promoters displaying the H3K4me3 modification [128]. Another possible causal link not explored until today is the influence of chromatin compaction on the replication fork progression. The replication fork is probably slower in compacted region than in euchromatin regions.
Conversely, replication can influence chromatin structure by influencing its transmission. How histone marks subsist after successive replications has been a long standing question. Even though the mechanisms of inheritance of his-tone marks through replication remain to be clearly established [143], there are solid presumptions that histone modifications participate to epigenetic mem-ory [144]. If histone marks were not transmitted through replication, then they would not be properly called epigenetic11 marks [143]. Replication in-fluences chromatin primary structure by reorganizing histones. To allow the progression of the replication fork, chromatin is temporarily disrupted, then the parental and newly synthesized histones are deposited on DNA [62, 65]. The latter action is controlled by histone chaperones that associate with the replication fork (Chromatin assembly factor 1 CAF-1 for H3 H4 dimer and nucleosome assembly protein 1 NAP-1 for H2A-H2B). A first mechanism of transmission could be that parental histones are redistributed between the two DNA strands.“Old" histones would keep their modifications intact and serve as templates for newly synthesized histones [62]. An alternative mech-anism to explain the epigenetic memory has been proposed in [144]. Histone modifications would be erased during the passage of the replication fork but histone modifying complexes could stay attached to the DNA thread. Behind the replication fork, these complexes would reestablish the histone marks. On a larger scale, it seems that replication may also act upon the three dimen-sional chromatin structure. Schematically, replication starts at the center of the nucleus and goes towards the periphery. During this progression, it can reorganize the 3D distribution of histone marks [145].
MRT data measure precisely the moment of the S-phase were the chromatin is disrupted and reassembled. These data seem more suited to study the causal effects of the replication program on chromatin structure. By contrast, the in-fluence of chromatin on replication is more difficult to estimate. To precisely assess the effects of chromatin structure, we would need the intrinsic
position-11
Epigenetics is the study of heritable changes that cannot be explained by changes in DNA sequence.
ing and firing times of origins which is impossible to measure directly because of passive replication12. Therefore, theoretical efforts are needed to delineate active and passive replication, which would enable to assess the genome wide effects of chromatin on replication initiation [131,132,146,147]. Alternatively, in vitro experimental procedures could be proposed to assess the intrinsic firing time of replication origins.
Remark: Histone variants are deposited throughout the cell cycle and are called replication independent which does not mean that they cannot im-pact replication. In the causality mechanisms discussed above, it would mean that replication does not impact them directly but, in reverse, they can impact replication by favoring or preventing origin deposition and firing. In Chapter V, we will see that H2AZ (replication independent) seems to be an important protagonist in the early firing of ESC specific replication origins.
II.3
Data
This short section gives a few indications on how datasets used in the “results” chapters were produced.
II.3.1
CHiP-seq assay
To study the impact of chromatin on diverse nuclear functions, the fluctuations of its composition along the genome have to be known. To our knowledge, there are currently two different procedures to locate proteins on the DNA sequence: DamID [148] and CHiP-seq [149, 150]. The data used in this thesis have been produced by CHiP-seq, which stands for chromatin immunoprecipitation with massively parallel DNA sequencing.
Here, we briefly describe how protein positions are obtained by CHiP-seq (Fig. II.9):
∗ DNA and chromatin proteins are bond together by covalent links. ∗ Then DNA-protein complexes are sheared: naked DNA is digested thus
DNA-protein complexes are separated from one another.
12
A replication origin is said to be passively replicated if it is replicated by a fork coming from a neighboring origin.
Figure II.9: Summary of the CHiP-seq protocol. Reproduced from [149].
∗ The complexes of interest (one particular protein, e.g. one histone bear-ing a modification or a DNA bindbear-ing protein) are selected by an anti-body. The antibody attaches to its antigen (DNA-protein complex) and precipitates.
∗ From the precipitate, the DNA is purified.
∗ DNA is sequenced by a high-throughput sequencer. Reads are then mapped on the genome.
Once reads are mapped on the genome, statistical pipelines detect positions of significant enrichment compared to the background noise. The final output of the procedure is a set of genomic intervals where the protein of interest binds.
Figure II.10: RNA-seq protocol summary. Reproduced from [151].
II.3.2
Assessment of gene expression level by RNA-seq
RNA-seq is a transcriptomic 13 tool taking advantage of the high-throughput sequencing technology [10,151]. It consists of selecting the RNA population of
13
Transcriptomics is the study of the complete set of transcripts (i.e. RNA molecules) in a cell.
interest (e.g. small RNAs, messenger RNAs, non coding RNAs) and sequenc-ing it. In our dataset, RNA from protein codsequenc-ing genes were selected. They were detected using their poly AAA tails.
Briefly, RNAs were first converted into a library of cDNA. In Fig. II.10, sequencing adaptors (blue) were subsequently added to each cDNA fragment and a short sequence was obtained from each cDNA using high-throughput sequencing technology. The resulting sequence reads were aligned with the genome.
One of the main advantages of RNA-seq compared to microarray technol-ogy14 is that it does not rely on a gene annotation [151]. It can be used to complete annotation (discovering new genes, improving positioning of exon-intron boundaries). The RPKM unit defined in the “results" chapters (see e.g. Sect. III.4.8, page 88) is equivalent to counting the number of times the RNA polymerase transcribes a gene. This measure is far more natural and does not present the same limits (saturation, noise...) as fluorescence intensity used in microarrays. It also presents the advantage of being readily comparable be-tween experiments which was difficult to do for microarrays without complex normalization methods [151].
II.4
Statistical methodology
This section is dedicated to the description of statistical techniques used in the “results” chapters. The analyses presented in this thesis use successively three statistical tools: the Spearman correlation, the Principal Component Anal-ysis (PCA) and an optimized K-means clustering (Clara). The principles of these techniques are presented here in a way understandable without statistical knowledge. However we would also like to provide a theoretical explanation to the interested reader. To solve this apparent paradox, each subsection deals with one technique and is organized as follows:
∗ Presentation of the purpose of the technique.
∗ Definition/algorithm of the technique. The non-statistician may skip this paragraph.
14
A DNA microarray is a collection of microscopic DNA spots attached to a solid surface. Microarrays are used to measure the expression levels of large numbers of genes simultane-ously by specifying a probe for each gene of interest.
∗ An example on a simple dataset to illustrate the power and interest of the tool. For the clustering and PCA subsections, the example treated is treated as the dataset of interest in the “results” chapters.
II.4.1
Pearson correlation and Spearman correlation
Purpose: Correlation coefficients are basic tools widely used. On a popu-lation of observations/individuals/items (e.g. genes, 100 kb windows, ORC binding sites), one can measure diverse variables that can be continuous (e.g. RPKM expression level, length, CpGo/e) or categorical (CpG rich/CpG poor). Correlation is computed between two variables and assesses to what extent the variables vary simultaneously. If the variables increase at the same time they are said to correlate. Inversely, if one variable increases while the other decreases, they anticorrelate. However, the classical Pearson correlation co-efficient measures if a variable linearly increases with another variable. To our judgment, there is no particular interest to look for a linear relations be-tween variables. The Spearman correlation coefficient measures how the rank of a variable varies with the rank of another variable15. Consequently, the Spearman correlation captures all kind of monotonical relation between two variables.
Definition: We remind that the Pearson correlation coefficient, between two random variables X and Y , is given by [152]:
Cor(X, Y ) = Cov(X, Y )
pV ar(X) × V ar(Y ). (II.5)
For n observations (xi, yi) of the couple of random variables (X, Y ), the em-pirical correlation is rxy = Pn i=1(xi− ¯x) × (yi− ¯y) pPn i=1(xi− ¯x) 2×pPn i=1(yi− ¯y) 2, (II.6)
where ¯x and ¯y are the empirical means.
The Spearman correlation [152] is simply the Pearson correlation between the ranks of the variables rather than the variable values themselves. Let ri
15
The rank of an observation is its position, according to its value, in the ordered list of all observations. Therefore the smallest value has rank 1 and the largest value has rank N.
![Figure II.9: Summary of the CHiP-seq protocol. Reproduced from [149].](https://thumb-eu.123doks.com/thumbv2/123doknet/14649283.736882/42.892.175.754.145.625/figure-ii-summary-chip-seq-protocol-reproduced.webp)