HAL Id: tel-01753898
https://tel.archives-ouvertes.fr/tel-01753898
Submitted on 29 Mar 2018HAL is a multi-disciplinary open access
archive for the deposit and dissemination of sci-entific research documents, whether they are pub-lished or not. The documents may come from teaching and research institutions in France or abroad, or from public or private research centers.
L’archive ouverte pluridisciplinaire HAL, est destinée au dépôt et à la diffusion de documents scientifiques de niveau recherche, publiés ou non, émanant des établissements d’enseignement et de recherche français ou étrangers, des laboratoires publics ou privés.
Artur Sossin
To cite this version:
Artur Sossin. Correction of scattered radiation in multi-energy radiography and tomography. Signal and Image processing. Université de Lyon, 2016. English. �NNT : 2016LYSEI104�. �tel-01753898�
N°d’ordre NNT : 2016LYSEI104
THESE de DOCTORAT DE L’UNIVERSITE DE LYON
opérée au sein deLaboratoire détecteurs (CEA/LETI)
Ecole DoctoraleN° 160
Électronique, Électrotechnique, Automatique (EEA)
Spécialité de doctorat : Traitement du Signal et de l’Image
Soutenue publiquement le 24/10/2016, par :
Artur SOSSIN
(M.Sc.)
Correction of scattered radiation in
mul-ti-energy radiography and tomography
Devant le jury composé de :
L. DESBAT Professeur (Univ. Joseph Fourier) Président
A. MOHAMMAD-DJAFARI Directeur de Recherche (LSS-CNRS) Rapporteur
C. MOREL Professeur (Aix Marseille Univ.) Rapporteur
G. POLUDNIOWSKI Chercheur (Hôpital univ. Karolinska) Rapporteur
V. REBUFFEL Ingénieur Chercheur (CEA LETI) Examinatrice
J. M. LETANG Maître de Conférences (INSA Lyon) Directeur de thèse
CHIMIE
CHIMIE DE LYON
http://www.edchimie-lyon.fr
Sec : Renée EL MELHEM Bat Blaise Pascal 3e étage
secretariat@edchimie-lyon.fr
Insa : R. GOURDON
M. Stéphane DANIELE
Institut de Recherches sur la Catalyse et l'Environnement de Lyon IRCELYON-UMR 5256
Équipe CDFA
2 avenue Albert Einstein 69626 Villeurbanne cedex directeur@edchimie-lyon.fr E.E.A. ELECTRONIQUE, ELECTROTECHNIQUE, AUTOMATIQUE http://edeea.ec-lyon.fr Sec : M.C. HAVGOUDOUKIAN Ecole-Doctorale.eea@ec-lyon.fr M. Gérard SCORLETTI Ecole Centrale de Lyon 36 avenue Guy de Collongue 69134 ECULLY Tél : 04.72.18 60.97 Fax : 04 78 43 37 17 Gerard.scorletti@ec-lyon.fr E2M2 EVOLUTION, ECOSYSTEME, MICROBIOLOGIE, MODELISATION http://e2m2.universite-lyon.fr
Sec : Safia AIT CHALAL Bat Darwin - UCB Lyon 1 04.72.43.28.91
Insa : H. CHARLES
Safia.ait-chalal@univ-lyon1.fr
Mme Gudrun BORNETTE CNRS UMR 5023 LEHNA Université Claude Bernard Lyon 1 Bât Forel 43 bd du 11 novembre 1918 69622 VILLEURBANNE Cédex Tél : 06.07.53.89.13 e2m2@univ-lyon1.fr EDISS INTERDISCIPLINAIRE SCIENCES-SANTE http://www.ediss-lyon.fr
Sec : Safia AIT CHALAL Hôpital Louis Pradel - Bron 04 72 68 49 09
Insa : M. LAGARDE
Safia.ait-chalal@univ-lyon1.fr
Mme Emmanuelle CANET-SOULAS INSERM U1060, CarMeN lab, Univ. Lyon 1 Bâtiment IMBL
11 avenue Jean Capelle INSA de Lyon 696621 Villeurbanne Tél : 04.72.68.49.09 Fax :04 72 68 49 16 Emmanuelle.canet@univ-lyon1.fr INFOMATHS INFORMATIQUE ET MATHEMATIQUES http://infomaths.univ-lyon1.fr
Sec :Renée EL MELHEM Bat Blaise Pascal 3e etage
infomaths@univ-lyon1.fr
Mme Sylvie CALABRETTO LIRIS – INSA de Lyon
Bat Blaise Pascal 7 avenue Jean Capelle 69622 VILLEURBANNE Cedex Tél : 04.72. 43. 80. 46 Fax 04 72 43 16 87 Sylvie.calabretto@insa-lyon.fr Matériaux MATERIAUX DE LYON http://ed34.universite-lyon.fr Sec : M. LABOUNE PM : 71.70 –Fax : 87.12 Bat. Saint Exupéry
Ed.materiaux@insa-lyon.fr
M. Jean-Yves BUFFIERE INSA de Lyon
MATEIS
Bâtiment Saint Exupéry 7 avenue Jean Capelle 69621 VILLEURBANNE Cedex Tél : 04.72.43 71.70 Fax 04 72 43 85 28
Ed.materiaux@insa-lyon.fr
MEGA
MECANIQUE, ENERGETIQUE, GENIE CIVIL, ACOUSTIQUE
http://mega.universite-lyon.fr
Sec : M. LABOUNE PM : 71.70 –Fax : 87.12 Bat. Saint Exupéry
mega@insa-lyon.fr
M. Philippe BOISSE INSA de Lyon
Laboratoire LAMCOS Bâtiment Jacquard 25 bis avenue Jean Capelle 69621 VILLEURBANNE Cedex Tél : 04.72 .43.71.70 Fax : 04 72 43 72 37 Philippe.boisse@insa-lyon.fr ScSo ScSo* http://recherche.univ-lyon2.fr/scso/
Sec : Viviane POLSINELLI Brigitte DUBOIS
Insa : J.Y. TOUSSAINT
viviane.polsinelli@univ-lyon2.fr
Mme Isabelle VON BUELTZINGLOEWEN Université Lyon 2
86 rue Pasteur 69365 LYON Cedex 07
Tél : 04.78.77.23.86 Fax : 04.37.28.04.48
Abstract
X-ray imaging coupled with recently emerged energy-resolved photon counting detectors provides the ability to differentiate material components and to estimate their respective thicknesses. However, such techniques require highly accurate images. The presence of scattered radiation leads to a loss of spatial contrast and, more importantly, a bias in radio-graphic material imaging and computed tomography (CT). Additionally, artifacts are also introduced in the case of the latter. The main aim of the present thesis was to develop a scatter correction approach adapted for multi-energy imaging. In order to achieve this task, a secondary objective was also set. Namely, the conception and validation of a simulation tool capable of providing energy-resolved scatter simulations in a reasonable time. Once validated through simulations and experimentally, this tool gave the ability to study the behavior of scattered radiation both in spatial and energy domains. Based on the conducted scatter analysis, a Partial Attenuation Spectral Scatter Separation Approach (PASSSA) adapted for multi-energy imaging was developed. The evaluation of PASSSA in radio-graphic mode through simulations and experiments revealed noteworthy results both in terms of image contrast improvement and scatter induced bias reduction. Additionally, simulation studies examined the performance of the developed approach in CT, where PASSSA also proved to be quite effective at correcting scatter induced distortions. Moreo-ver, the performance improvement in the context of basis material decomposition in radi-ography after applying the designed method was also analyzed. It was concluded that the application of PASSSA results in a substantial improvement in basis material thickness estimation. Finally, based on the obtained simulated and experimental method evaluation results an analysis of perspective developments was also conducted.
L’imagerie à rayons X couplée aux détecteurs résolus en énergie permet de différencier les matériaux présents et d’estimer leurs contributions respectives. Cependant, ces techniques nécessitent des images très précises. La présence du rayonnement diffusé conduit à une perte du contraste spatial et un biais dans l’imagerie radiographique ainsi que des artefacts dans la tomodensitométrie (TDM). L’objectif principal de cette thèse était de développer une approche de correction du rayonnement diffusé adaptée à l’imagerie multi-énergies. Pour réaliser cette tâche, un objectif secondaire a été défini : la conception et la validation d’un outil de simulation capable de fournir des images du diffusé résolu en énergie dans un temps raisonnable. Une fois validé, cet outil a permis d’étudier le comportement du diffusé dans le domaine spatial et énergétique. Sur la base de cette analyse du diffusé, une ap-proche originale dite « Partial Attenuation Spectral Scatter Spectral Aproach » (PASSSA) adaptée à l’imagerie multi-énergies a été développée. L’évaluation de PASSSA en mode radiographique par des simulations numériques et des mesures expérimentales a révélé des résultats remarquables en termes d’amélioration du contraste d’image et de la réduction du biais induit par la présence du diffusé. De plus, des études de simulation ont permis d’évaluer la performance de l’approche développée dans la TDM, où PASSSA s’est révé-lée d’être très efficace pour corriger les distorsions induites par le rayonnement diffusé. D’autre part, l’amélioration de la performance dans le contexte de la décomposition des matériaux de base en radiographie après avoir appliqué la méthode développée a également été analysée : l’application de PASSSA se traduit par une amélioration substantielle de l’estimation des épaisseurs des matériaux de base. Finalement, sur la base des différents résultats de validation obtenus, une analyse des développements potentiels a été menée.
LIST OF SYMBOLS
0 Index denoting raw (no inspected object) quantities
a Index denoting attenuator related quantities
A True attenuation
Am Measured attenuation
A True attenuation (function of energy)
Am Measured attenuation (function of energy)
b Basis material index / diagonal matrix linked to B
B Attenuation matrix
c Speed of light in vacuum
C 2D discrete cosine transform
d Exponent denoting detected quantities / grid element spacing
D(E) Detector efficiency
D Detector response matrix
e Electron charge
E (Incident) X-ray photon energy / Energy channel
E' Scattered x-ray photon energy
Ekin Kinetic energy
E Vector of median detector bin energies
f Particle fraction
F(x, Z) Atomic form factor
F Scatter energy component (function of energy)
g Scatter spatial component
f(E,E*,σ,α,β) Parametric function with free parameters σ, α and β
h Planck constant / grid strip height
h(•) Filter function
H Indicator function
HU Index for quantities measured in Hounsfield units
I Signal intensity
I Identity matrix
k Calibration pair index / smoothing parameter
K(u) Scatter kernel
l Material thickness / particle path length
m Exponent denoting modified quantities
m0 Electron rest-mass
M Transition matrix
n Number of elements (e.g. materials, pixels, etc.)
N Number of x-ray photons
N Number of x-ray photons (function of energy)
NRMSE Normalized root-mean-square error
p Pixel with coordinates (x, y)
P Index denoting primary quantities / scattering source point
Pφ{•} Multiple-angle projection acquisition operation
r Relative noise per pixel
r0 Classical electron radius
rG Grid ratio
s Smoothing parameter
S Index denoting scatter quantities / detector node point
S(s,u,φ) Sinogram
S(x, Z) Incoherent scatter function
SPR Scatter-to-primary ratio
SPR Scatter-to-primary ratio as a function of energy
t Grid strip thickness
T{•} Scatter estimation operation
Ua Accelerating potential
U Image sub-region
v Voxel with coordinates (x, y, z)
V 3D attenuation map (volume) of the object / voxel value
W Diagonal matrix linked to M
x Momentum transfer quantity
z Scatter spatial component (sparse)
Z Atomic number
dx Elementary material thickness
dσ/dΩ Differential cross-section
ΔN Number of photon difference (function of energy)
εr Average relative error per pixel
θ Scattering angle
λ (Incident) X-ray photon wave length
λ' Scattered x-ray photon wave length
Λ Diagonal matrix containing the eigenvalues of R
μ Linear attenuation coefficient
ν X-ray photon frequency
ξ(•) Scatter potential
φ Projection angle
Ω Solid angle / entire image region
σ Total cross-section / standard deviation
σ Standard deviation (function of energy)
σr Relative standard deviation (function of energy)
LIST OF ACRONYMS
ADD Axis-to-detector distance
AP Anteroposterior
ASG Anti-scatter grid
BS Beam-stop
BH Beam-hole
CNR Contrast-to-noise ratio
CBCT Cone beam Computed Tomography
CPU Central processing unit
CT Computed Tomography
CR Computed Radiography
CSG Constructive solid geometry DCT Discrete cosine transform
DR Digital Radiography
FDK Feldkamp-Davis-Kress
GCV Generalized cross-validation GPU Graphics Processing Unit
HE High-energy
HU Hounsfield Unit
LE Low-energy
NDT Non-destructive testing
MC Monte Carlo
NRMSE Normalized root-mean-square error ODD Object-to-detector distance
PASSSA Partial Attenuation Spectral Scatter Separation Approach PCD Photon counting detector
PM Primary modulation
PMMA Polymethyl methacrylate NRMSE Relative standard deviation SAD Source-to-rotation axis distance SFFD Spectral Fixed Forced Detection SDD Source-to-detector distance
SK Scatter kernel
SNR Signal-to-noise ratio SPR Scatter-to-primary ratio
STD Standard deviation
TFT Thin film transistor
TABLE OF CONTENTS
LIST OF SYMBOLS ... III
LIST OF ACRONYMS ... V
TABLE OF CONTENTS ... 1
1.
Introduction ... 4
2.
Physics of x-ray imaging ... 6
2.1. X-ray generation ... 6
2.1.1. Bremsstrahlung radiation ... 7
2.1.2. Characteristic x-rays ... 8
2.1.3. The x-ray tube ... 9
2.2. Interaction of x-rays with matter ... 11
2.2.1. Photoelectric effect ... 11 2.2.2. Rayleigh scattering ... 12 2.2.3. Compton scattering ... 14 2.2.4. X-ray attenuation ... 16 2.3. Detection of x-rays ... 19 2.3.1. Indirect conversion ... 19 2.3.2. Direct conversion ... 20
2.3.3. Photon counting detectors ... 20
2.4. From radiography to Computed Tomography ... 22
2.4.1. Radiography ... 22
2.4.2. Computed Tomography ... 26
3.
Scattered radiation in x-ray imaging ... 30
3.1. Characterization of the scatter phenomenon ... 30
3.1.1. Existing observations ... 30
3.1.2. Scatter behavior in the energy domain based on simulations ... 32
3.1.3. Scatter behavior in the energy domain based on experiments ... 38
3.1.4. Conclusion ... 44
3.2. Effect of scattered radiation in x-ray imaging ... 44
3.2.1. In radiography ... 45
3.2.2. In Computed Tomography ... 46
3.2.3. In basis material decomposition ... 49
3.3. Objectives of the thesis ... 53
4.
Energy-resolved scatter simulation ... 54
4.2. Sindbad ... 56
4.3. A tool for multi-energy x-ray simulation ... 57
4.3.1. Sindbad-SFFD ... 57 4.3.2. Cross-validation ... 60 4.3.3. Experimental validation ... 64 4.3.4. Conclusion ... 68
5.
Scatter correction ... 70
5.1. Existing methods ... 70 5.1.1. Direct methods... 705.1.2. Numerical modelling based methods ... 73
5.1.3. Physical measurement based methods ... 74
5.1.4. Image post-processing ... 79
5.2. A novel method for multi-energy x-ray imaging ... 80
5.2.1. Concept ... 80
5.2.2. Transition matrix ... 84
5.2.3. Spatial estimation of scatter ... 87
5.2.4. Conclusion ... 89
6.
Evaluation of the developed scatter correction method ... 90
6.1. Evaluation through simulations ... 90
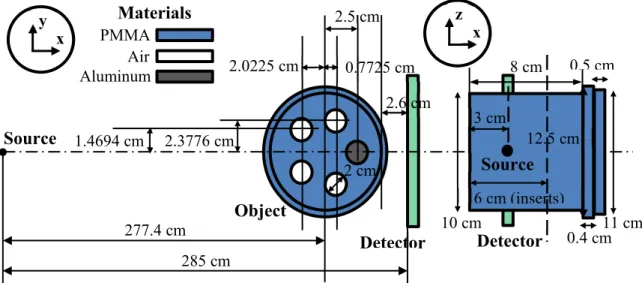
6.1.1. System description ... 90
6.1.2. Results in radiography ... 91
6.1.3. Results in tomography ... 94
6.1.4. Transition matrix performance evaluation ... 97
6.1.5. Discussion... 99
6.1.6. Conclusion ... 102
6.2. Evaluation through experiments ... 102
6.2.1. System description ... 103
6.2.2. Reference primary estimation ... 105
6.2.3. Results for multi-view radiography ... 106
6.2.4. Transition matrix performance evaluation ... 115
6.2.5. Discussion... 116
6.2.6. Conclusion ... 118
6.3. Performance analysis in basis material decomposition ... 119
6.3.1. System description ... 119
6.3.2. Modified version of PASSSA ... 120
6.3.3. Results ... 121
6.3.4. Discussion... 125
6.3.5. Conclusion ... 126
7.
Further analysis and improvements of the method ... 128
7.1. Scatter estimation improvements ... 128
7.1.1. Noise propagation models ... 128
7.1.3. Spatial scatter estimation ... 135
7.2. Attenuator mask optimization ... 135
7.2.1. Placement and dimensions ... 136
7.2.2. Material ... 137
7.3. Single acquisition ... 139
7.3.1. Radiography ... 140
7.3.2. Tomography ... 141
8.
Conclusion and perspectives ... 143
APPENDIX A: TEXTE DE SYNTHESE EN FRANÇAIS ... 146
LIST OF SCIENTIFIC CONTRIBUTIONS ... 185
1. INTRODUCTION
Since the discovery of x-rays by Röntgen in 1895, numerous applications for x-ray im-aging have surfaced, ranging from medical diagnostic to security and industrial sample testing. Significant advances can be observed in the design of various x-ray system com-ponents such as tubes, generators, detectors, collimators, computed tomography (CT) gan-tries, signal processing algorithms, etc.
In the last few decades several important changes in x-ray detection technology have occurred. In particular, in the beginning of the 1990s, the analog film detection has been replaced by the so-called “semi-digital” technique known as Computed Radiography (CR). The idea was based on the utilization of photo-stimulable phosphor plates, which were processed after exposure by a reader. [1]. Then, in early XXIst century, fully digital x-ray detection technology, known as Digital Radiography (DR), has been introduced. These types of detectors converted x-rays into electrical signals after exposure either through in-direct or in-direct conversion. [2]. Both CR and DR contributed to the development of CT imaging and enabled the application of digital image processing techniques to the resulting x-ray images. These techniques enable image enhancement, restoration and the ability to perform image segmentation, as well as the development of automatic disease detection methods and etc. [3].
For the last few years, new digital x-ray detector capabilities have been investigated. For a given pixel, conventional x-ray detectors provide a signal proportional to the photon energy deposited into the detector element, integrated on the total energy range [2]. Re-cently emerged room temperature semiconductor photon counting detectors (PCDs) exhibit the ability to classify photons into several discrete energy channels, the number of which varies from a few bins (typically from 2 to 8) [4]–[6] to a hundred with a width of ~1 keV, depending on the electronic circuit [7], [8]. This new technology allows the development of energy-resolved imaging for all current x-ray applications. The supplemental energy information provides the ability to increase contrast-to-noise ratio (CNR) [9], reduce dose and artifacts [10]. Additionally, material components present in the object can be differen-tiated and their equivalent thicknesses and relative ratios (soft tissue, bone, glandular, con-trast agent enhanced tissue, etc.) estimated by processing a single shot acquisition image in both radiography and CT [4], [10], [11]. In order to benefit from the material differentia-tion capability of multi-energy imaging, a high degree of image quality in the acquisidifferentia-tions is needed (low bias, low noise, absence of artifacts, etc.), especially for materials close in terms of attenuation.
Such an objective is difficult to achieve in the case of uncollimated geometries due to scattered radiation. It induces various undesirable effects in x-ray imaging such as bias, loss of contrast and artifacts in CT [12]. Additionally, this effect is object and geometry dependent [13]. Several studies have demonstrated the impact of x-ray scatter on multi-energy imaging applications [14]–[16].
A substantial number of methods have been developed for scatter correction using con-ventional detectors [17]. These approaches include direct methods, such as anti-scatter grids [18], increasing air gap [19] and additional collimation [20], methods based on
nu-merical modelling, such as Monte Carlo (MC) methods [21]–[23] and scatter kernels (SK) [24]–[26], physical measurement based methods, such as stop (BS) [27]–[29], beam-hole (BH) [30], [31], primary modulation [32]–[34] and others [35], [36], and image post-processing methods [37]. Some of these techniques apply directly to multi-energy imaging (direct methods, physical measurement based methods) whilst others will suffer from an increase in model complexity and execution time (methods based on analytical modelling, image post-processing methods). It is important to note that the scatter correction methods applied for conventional x-ray detectors do not exploit the energy information. The evolu-tion to relatively large size 2D energy-resolved PCDs gives more importance to the devel-opment of an x-ray scatter correction method adapted for multi-energy imaging.
The thesis includes two main objectives. The first one is the development of a simula-tion tool capable of performing multi-energy x-ray scatter simulasimula-tions during a reasonable time, thus giving the opportunity to study the behavior of the phenomenon in more detail in the energy domain. The second and main goal of this work is to develop an x-ray scatter correction procedure adapted for multi-energy x-ray imaging and benefiting from the addi-tional energy information provided by such technology.
The rest of the document is organized into seven chapters. Chapter 2 introduces the principles of x-ray generation, interaction with matter and detection. Then, x-ray scatter radiation is characterized and its effects demonstrated in conventional radiography and tomography as well as in material imaging (Chapter 3). The energy-resolved scatter simu-lation tool fulfilling the secondary goal of the thesis is presented in Chapter 4. The next chapter of the document (Chapter 5) introduces a subjective classification and examples of existing scatter correction schemes followed by an introduction of the developed novel multi-energy adapted scatter correction method. Chapter 6 evaluates the respective scatter correction approach through simulations and experiments. Based on these evaluations a series of method improvement propositions is also listed (Chapter 7). Finally, a conclusion is made and future work is discussed in Chapter 8.
2. PHYSICS OF X-RAY IMAGING
The production of x-ray images comprises several stages. Firstly, x-rays are generated by a corresponding device (Chapter 2.1). Then, various physical interactions occur within the inspected object contributing to local changes in x-ray flux (Chapter 2.2). Finally, an image receptor is used to detect these changes (Chapter 2.3) and various types of images are formed based on the measured signal (Chapter 2.4).
Chapter 2.1 investigates the physics behind x-ray generation and provides an overview of a common x-ray generation device with its key elements and parameters.
The behavior of x-ray photons in matter is examined in Chapter 2.2. Mathematical models for different physical interactions are presented and discussed. Finally, a demon-stration of the net effect of these interactions on the x-ray flux is provided.
Chapter 2.3 highlights different technical solutions behind x-ray detection. Various de-tection modes with their virtues and drawbacks are discussed.
Finally, Chapter 2.4 provides information on key x-ray acquisition modes, such as radi-ography and CT. Image formation based on signals measured by different detector types is discussed and examples are given.
2.1.
X-ray generation
X-rays are a form of electromagnetic radiation with a wavelength ranging from a few picometers to a few nanometers. The energy E of a given x-ray photon is proportional to its frequency ν, and can be characterized by the following formula:
λ
ν hc
h
E= = , (2.1)
where h is the Planck constant, c is the speed of light in vacuum and λ is the wavelength of the photon. From expression (2.1) it is apparent that higher and lower energy x-rays have a shorter and longer wavelength, respectively. The wavelength of diagnostic x-rays lies in the approximate interval of 0.1 nm to 0.01 nm, which corresponds to an energy range of about 12.4 keV to 124 keV [38].
X-ray photons are produced when a target material is struck by highly energetic elec-trons (kinetic energy is converted to electromagnetic radiation). During this event, most of the electron energy (>99%) is converted to heat when impinging on the target electrode. The remaining fraction is responsible for x-ray photon production through two different processes [38] that are discussed in more detail in Chapters 2.1.1 and 2.1.2.
The kinetic energy Ekin obtained by the electrons is equal to the product of the electron
charge e and the accelerating potential Ua:
a kin eU
E = . (2.2)
The maximum possible energy of the generated x-ray photon is equal to the kinetic energy of the electron.
A device that fulfills the objective of x-ray generation consists of a source of electrons, an evacuated path for electron acceleration, a target electrode and an external energy sup-ply to provide the necessary potential for electron acceleration [1] (Figure 2.1). This device is called an x-ray tube (Chapter 2.1.3).
Figure 2.1. Schematic of an x-ray generation device. 2.1.1. Bremsstrahlung radiation
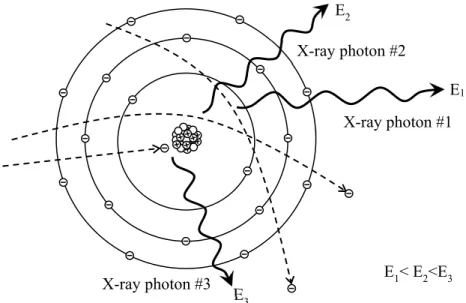
When an electron comes within close proximity of an atomic nucleus in the target elec-trode, Coulomb forces attract and decelerate the electron, causing a substantial loss of ki-netic energy and a change in trajectory. This produces an x-ray photon with energy equal to the energy lost by the electron (Figure 2.2). This type of radiation is called Bremsstrah-lung, which, when directly translated from German, means “braking radiation”. [39].
Figure 2.2. A schematic drawing of an atom of the target electrode depicting different cases of
Bremsstrahlung x-ray photon production: far interaction (x-ray photon #1), close interaction (x-ray photon #2) and direct collision (x-ray photon #3).
Since Coulomb force is inversely proportional to the square of the interaction distance, the energy loss of the electron interacting with the nucleus is increased with decreasing distance. Thus, an electron passing within a longer range of the nucleus will produce a
Ua Electron source Target electrode Electrons X-ray photons E1 E2 E3 X-ray photon #2 X-ray photon #1
within shorter range (x-ray photon #2 in Figure 2.2). Additionally, in very rare cases, an electron will directly impact the nucleus, in which case all of its kinetic energy is lost and converted to an x-ray photon (x-ray photon #3 in Figure 2.2). The probability of such of an event is extremely low, since the nuclear cross-section is small compared to the size of the entire atom. Therefore, the dominant x-rays produced are low energy x-rays. The number of photons weighted by their respective energies (or energy fluence) decreases approxi-mately linearly with energy up to the maximum energy of the impinging electrons [1].
The distribution of x-ray photons or energy fluence as a function of energy is called an x-ray spectrum (Figure 2.3). The main part is composed of Bremsstrahlung radition. Ac-cording to equation (2.2), the maximum x-ray energy is determined by the acceleration voltage Ua. Due to self-absorption in the target material and due to energy dependent
tenuation in the x-ray tube housing, the low energy x-ray photons undergo a stronger at-tenuation, thus the real energy fluence spectrum will deviate from the theoretical linear relationship discussed earlier [39].
Figure 2.3. An example x-ray energy fluence spectrum produced with a tungsten anode x-ray tube
(1 keV histogram bins). The acceleration voltage was set to 80 kV. The theoretical ramp spectrum is attenuated by the anode and tube housing. Energy fluence due to Bremsstrahlung photons is con-tained in the part of the spectrum under the dashed line while the peaks located on top of this line correspond to energy fluence due to characteristic x-ray photons, discussed in more detail in Chap-ter 2.1.2.
2.1.2. Characteristic x-rays
Compared to Bremsstrahlung radiation, which is produced through electron interaction with atomic nuclei of the target electrode, characteristic radiation (also known as fluores-cence) is produced when the accelerated electrons interact with the atomic electrons of the target electrode (Figure 2.4a) [39]. Provided that the energy of an incident electron is greater that the binding energy of an electron of the target atom, a collision of the two elec-trons can eject the atomic electron and ionize the atom. The created vacancy gives rise to
0 10 20 30 40 50 60 70 80 0 0.1 0.2 0.3 0.4 0.5 0.6 0.7 0.8 0.9 1 1.1 1.2 Energy, keV Ene rgy flue nc e, re l. uni ts Characteristic peaks Bremsstrahlung Theory Kα Kβ
an atomic shell transition. Since, in this case, the electron is transitioning to a lower energy level, the redundant energy can be transformed into a characteristic x-ray photon with en-ergy equal to the difference in electron shell binding energies. [1].
The highest binding energy corresponds to the innermost K-shell and decreasing for other outer shells, such as L, M, N and etc. The binding energies and the characteristic ra-diation resulting from electron transitions from one shell to another are unique for each target electrode material. [39]. For example, for tungsten, a transition from the M-shell (2.5 keV) to the K-shell (69.5 keV) results in an emission of an x-ray photon with an ener-gy of 67 keV. The simplified enerener-gy level diagram corresponding to a tungsten atom is presented in Figure 2.4b. Characteristic x-ray photons add to the Bremsstrahlung photons comprising the x-ray spectrum. Since only a few discrete energies are concerned, this addi-tional fraction of photons manifests itself as peaks in the spectrum (Figure 2.3). These peaks are also called characteristic peaks [1].
Characteristic x-radiation is denoted with the shell letter (to which the electron transi-tions) and Greek indexes (α, β, etc.). The indexes indicate the origin of the transitioning electron in the atom, α – for the closest outer shell, β – for the next one and etc. [39]. Thus, for the example considered above, where a transition to the K-shell is made from the M-shell, the resulting characteristic x-ray will be denoted as Kβ.
Figure 2.4. Schematic illustration of the production of a characteristic x-ray as a result of electron
collision and transition (a). Simplified energy level diagram for K, L, M and N shells of a tungsten atom is also displayed (b). Note the various characteristic x-rays produced through different elec-tron transitions.
It is also worth pointing out that reabsorption of Bremsstrahlung x-rays through an ef-fect described later in Chapter 2.2.1 can also contribute to the production of characteristic peaks.
2.1.3. The x-ray tube
There are several solutions for an x-ray generation tube depicted in Figure 2.1. The most commonly used consists of a positively charged anode (target), a negatively charged
K L
M
Characteristic x-ray Ejected electron Incident electron (a) K L M N 0.5 keV 2.5 keV 10.2 keV 69.5 keV Lα Kα Kβ Lβ (b)
cathode, high voltage supply (electron acceleration), a motor for anode rotation and a glass envelope [1]. A detailed illustration can be found in Figure 2.5.
Figure 2.5. An illustration of an x-ray tube with a rotating anode, beam collimators and a beam
filter.
The cathode is composed of a spiral tungsten filament surrounded by a focusing cup and acts as source of electrons for x-ray production. The filament is powered by a supply to ensure heating. Electrons are then released via a process called the thermionic emission. The high voltage applied between the cathode and anode ensures the acceleration of these electrons through the vacuum filled x-ray tube envelope. The focusing cup part of the cathode serves to shape the electron beam. The rate of electron flow from the cathode to the anode is called tube current and is measured in milliamperes (mA). The product of the tube current with the exposure time (in seconds) determines the amount of x-ray photons produced for a given examination. The respective product is measured in milliampere-seconds (mAs) [1].
As noted previously in the beginning of Chapter 2.1, electrons incident on the target anode deposit most of their energy in the form of heat, whilst only a small fraction is emit-ted as x-rays. As a result, when producing the amount of x-rays required for sufficient im-age quality, a large quantity of heat is generated. With its high melting point of 3422 °C and atomic number (Z), tungsten is the most commonly used anode material. The high Z is also an advantage as Bremsstrahlung production is proportional to Z. Other anode materi-als such as molybdenum and rhodium can be found in mammography tubes. The rotation of the anode disk by means of an induction motor insures the spreading of the impinging electron thermal energy over a large area of the disk, which is supported by a bearing-mounted rotor assembly. Thus, the rotation gives the possibility to apply higher tube cur-rents. [39].
The anode angle is defined as the angle of the target electrode surface with respect to the tube axis. For diagnostic x-ray tubes, the anode angle usually ranges from 6° to 22°, with the most common being 10°–16°. [39].
The focal spot can be defined in two ways. The actual focal spot is the area of the an-ode electran-ode struck by the electrons. It is mostly determined by cathan-ode filament length and focusing cup slot width. The effective focal spot is the length and width of the actual
Rotating anode Cathode/Filament Tube envelope Electrons X-ray photons Exit window Focal spot Focusing cup Bearings Rotor support Rotor Stator Filament supply
High Voltage High Voltage
Collimator Beam filter
Anode angle
focal spot when projected down the tube x-axis on the x-ray field. When projected, the actual focal spot will conserve the size of one of its sides while the other will decrease due to the anode angle. Note that for transmission-target tubes the electron beam spot is the true focal spot [40].
It is worth also noting that due to the anode being at an angle the x-ray photons di-rected toward the cathode side of the field traverse less anode material and thus experience less attenuation than those directed to the cathode side. As a result the x-ray intensity grad-ually increases towards the cathode side. The effect is called heel effect and is less promi-nent at larger source-to-detector distances (SDDs), because the detector views a narrower x-ray beam angle. [1].
Finally, collimation and filtration is used exterior to the x-ray tube, to shape the x-ray field spatially and spectrally. Collimator blades, typically made of lead, with electronically controlled positioning insure the desired field size. Bow-tie filtration can also be used to provide a specific (to an examined object) non-uniformity of the x-ray beam. Since the contribution of low energy photons to the measured signal is often low due to a relatively high attenuation probability in the material of the imaged object (Chapter 2.2.4), which in turn leads to additional dose, a sheet of material (typically copper or aluminum) is often inserted to insure the attenuation of these type of photons. [40].
2.2.
Interaction of x-rays with matter
X-rays interact with matter through various processes, which can lead to changes in photon direction and energy or even its complete absorption. Since some of these interac-tions cause atom ionization, x-ray radiation is considered ionizing. This leads to its harmful effects on biological tissues. The main interactions processes relevant in diagnostic x-ray imaging are photoelectric effect (Chapter 2.2.1), Rayleigh scattering (Chapter 2.2.2) and Compton scattering (Chapter 2.2.3). The combination of these effects leads to the reduc-tion of ray beam intensity when traversing a material. This intensity change is called x-ray attenuation (Chapter 2.2.4).
2.2.1. Photoelectric effect
When an incident x-ray photon with energy greater than the binding energy of an elec-tron liberates that elecelec-tron from the corresponding shell via energy transfer, a vacancy is created. This process is called photoelectric effect (Figure 2.6). The kinetic energy of the ejected electron is then equal to the difference between the photon energy and binding en-ergy. The resulting vacancy is then filled by an outer-shell electron. This causes (as noted earlier in Chapter 2.1.2) an emission of a characteristic x-ray photon with energy equal to the difference between the binding energies of the two shells. Sometimes, the energy origi-nating from the vacancy filling is transferred to another electron, which is ejected from the atom, instead of being emitted in the form of an x-ray photon. This second ejected electron is called an Auger electron. [38].
The probability of the photoelectric effect of a given material (τphoto) in the diagnostic
energy range can be described by the following expression:
3 4 3 E Z to photo∝ τ , (2.3)
where Z is the atomic number of the material, E is the x-ray photon energy [39]. Thus, for a fixed energy, the probability of x-ray absorption through photoelectric effect increases with Z. Furthermore, for a given material the probability decreases with energy.
The elements comprising biological tissue are mostly low-Z materials, such as carbon (Z=6), hydrogen (Z=1), oxygen (Z=8) and nitrogen (Z=7). Since the K-shell binding energy is in the interval of 0.5–4 keV for these elements and the fluorescence yield is almost 0%, the characteristic x-rays become very unlikely [38]. However, when metallic implants are present in the patient, characteristic x-rays can exhibit higher energies. For example, tanta-lum, which is often used as metallic implant coating material [41], has a K-shell binding energy of 67.4 keV and a L-shell binding energy of 11.7 keV. In this case, the transition from L to K-shell results in the emission of a 55.7 keV x-ray photon.
Figure 2.6. An example of the photoelectric effect. An absorbed x-ray photon causes the ejection
of a K-shell electron, which leads to an electron from the L-shell to fill the vacancy. As a result a Kα characteristic x-ray is emitted.
2.2.2. Rayleigh scattering
In the process of Rayleigh scattering the x-ray photon interacts with the atom and changes direction while conserving energy (Figure 2.7a). The electrons in the atom are set into momentary vibration by the oscillating electric field of the electromagnetic wave asso-ciated with the incident photon. The vibrating electrons emit radiation of the same wave-length as the incident x-ray. A combination of these waves forms the scattered wave. Be-cause of this, Rayleigh scattering is also known as coherent scattering. During this process the scattered x-ray obtains the same energy as the incident one as no energy is converted to kinetic energy or transferred to the medium. [38]. Thus, since the incident x-ray photon energy E is equal to the scattered photon energy E', then, according to (2.1), so are their wavelengths (i.e. λ=λ').
In order to derive the expression for angular Rayleigh scatter probability, one starts with the expression of angular Thompson scattering probability, dσTh /dΩ:
(
θ)
σ 02 1 cos2 2 d d = + Ω r Th , (2.4) K L MCharacteristic x-ray photon
Ejected electron Incident x-ray photon
where r0 is the classical electron radius and θ is the scattering angle with respect to the
in-cident photon direction. The quantity dσTh/dΩ is also known as the differential Thompson
cross-section. Thompson scattering considers the case of a photon scattered through the interaction with a free electron. [39].
Figure 2.7. Illustration of coherent (Rayleigh) scattering (a). Incident x-ray photon energy is
de-noted with E and λ, respectively. The same notation is used for the scattered photon with the addi-tion of the “prime” symbol. The scattering angle is marked with θ. In (b) a polar plot of the angular Rayleigh scattering probabilities for a water molecule at room temperature as function of scattering angle θ is presented. Note that different photon energies are also considered in (b).
Since for Rayleigh scattering an entire atom with bound electrons is considered, (2.4) must be weighted by F(x, Z), a quantity known as the atomic form factor. This quantity takes into account the binding energies of the electrons as well as the atom configuration. Expression (2.4) thus becomes:
( )
x Z F Th Rayleigh , d d d d 2 Ω = Ω σ σ , (2.5)where dσRayleigh /dΩ is the angular Rayleigh scattering probability (differential Rayleigh
cross-section), x is the momentum transfer quantity (x=sin(θ/2)/λ). Values of F(x, Z) can be calculated with the aid of quantum mechanical models. [39]. Corresponding numerical tabulations also exist and can be found in [42]. For a small scattering angle θ, the value of the form factor approaches Z. In this case a collaborative action of all the electrons in the atom causes a strong forward direction for the scattering. Back-scatter is less probable, however, because F decreases with scattering angle as it becomes more difficult for all the electrons to scatter in phase without energy transfer. [39].
The form factor notion can be also extended to a molecule. In such a case coherent scattering is a result of a photon interacting with all the electrons in the molecule. It has been shown that a mixture of the respective independent angular scatter probabilities of the
0.05 0.1 0.15 0.2 π / 6 7π / 6 π / 3 4π / 3 π / 2 3π / 2 2π / 3 5π / 3 5π / 6 11π / 6 π 0 10 keV 25 keV 50 keV 100 keV Scattered waves Incident x-ray Scattered x-ray λ λ' θ (a) E' (b) E dσRayleigh /dΩ
lecular form factor has been determined experimentally for a number of materials of inter-est for x-ray imaging [22], [43].
With the aid of equation (2.5) and using the respective molecular form factor the angu-lar Rayleigh scattering probability can be computed. An example for a water molecule at room temperature is given in Figure 2.7b. The curve in the figure plotted for different rele-vant x-ray photon energies shows that the scattering probability is strongly peaked in the forward direction. This becomes more and more valid with increasing photon energy.
To obtain the Rayleigh scattering probability per material element σRayleigh (e.g. atom or
molecule), the expression (2.5) must be integrated over the entire solid angle dΩ. With the aid of the substitution dΩ=2πsinθdθ, the Rayleigh scattering probability in the interaction medium takes the following form:
(
θ)
( )
θ θ π σ π 1 cos , sin d 0 2 2 2 0∫
+ = r F x Z Rayleigh . (2.6)It is also worth noting that the probability of Rayleigh scattering is very low in the di-agnostic x-ray energy range. For example, in soft tissue, this type of scattering occurs in less than 5% of interactions above 70 keV and, at most, for 12% at around 30 keV [1].
2.2.3. Compton scattering
Compared to the Rayleigh process, Compton scattering plays a more important role in x-ray imaging, since it is the predominant interaction of x-ray photons with soft tissue in the diagnostic energy range [1]. Instead of interacting with the whole atom, the incident x-ray interacts with an individual electron (most likely in the outer shell). This is the reason why the Compton process is also called incoherent scattering. [39].
An illustration for Compton scattering is presented in Figure 2.8a. In this type of inter-action the energy of the incident x-ray photon is considerably higher than the binding ener-gy of the outer-shell electron. The incoming photon changes its direction and enerener-gy through the interaction with the electron. A part of the x-ray photon energy is transferred to the electron (also referred to as recoil electron) ejecting it from the atom. [38].
As noted previously, the binding energy of the considered electrons is substantially lower than that of the incident x-ray photon and can be neglected. Thus, the electrons can be treated as free. With the aid of this assumption, one can derive the well-known relation-ship between the scattered photon energy E' and incident photon energy E through the scat-tering angle θ [39]:
(
1 cosθ)
1 ' 0 − + = c m E E E , (2.7) where m0 is the electron rest-mass.In order to describe the probability of photon scattering by a free electron as a function of scattering angle, the Klein-Nishina formula is used [39]:
E E r KN 1 sin , ' 2 d d 02 2 2 = + − = Ω ε ε ε θ ε σ . (2.8)
In (2.8) dσKN/dΩ denotes the differential Klein-Nishina cross-section.
As the x-ray photon is actually scattered by a bound electron, the contributions of the surrounding electrons must be taken into account in order to compute the differential
Compton cross-section dσCompton/dΩ. This is done by weighting the expression in (2.8) by
the incoherent scattering function S(x, Z):
( )
x Z S r Compton 1 sin , 2 d d 2 2 2 0 + − = Ωε
ε
ε
θ
σ
. (2.9)Numerical tabulation for this function can be found in [42]. An example of angular Comp-ton scattering probability for a water molecule at room temperature is given in Figure 2.8b. In the forward direction the value for S is zero, thus suppressing Compton scattering. This value, however, increases with increasing x, reaching the value of Z, which is equal to the number of electrons per material atom. The increase in the value of S becomes slower with increasing Z. [39].
Figure 2.8. Illustration of incoherent (Compton) scattering (a). Incident x-ray photon energy is
denoted with E and λ, respectively. The same notation is used for the scattered photon with the addition of the “prime” symbol. The scattering angle is marked with θ. In (b) a polar plot of the angular Compton scattering probabilities for a water molecule at room temperature as function of scattering angle θ is presented. Note that different photon energies are also considered in (b).
Compton scattering probability per material element σCompton (e.g. atom or molecule) can
be obtained in a manner similar to σRayleigh by integrating (2.9) over the entire solid angle
dΩ:
( )
θ θ θ ε ε ε π σ π 1 sin , sin d 2 0 2 2 0∫
+ − = r S x Z Compton . (2.10)In order for the Compton interaction to take place, the x-ray photon energy must be su-perior to the binding energy of the electron. Consequently, the probability of Compton scattering increases with increasing incident photon energy. However, for large energies superior to the ones used in diagnostic imaging this probability becomes inversely propor-tional to energy. Addipropor-tionally, the probability of the Compton process is electron density dependent. Since the total number of electrons per gram is relatively constant in tissue
0.005 0.01 0.015 0.02 0.025 π / 6 7π / 6 π / 3 4π / 3 π / 2 3π / 2 2π / 3 5π / 3 5π / 6 11π / 6 π 0 10 keV 25 keV 50 keV 100 keV K L M
Scattered x-ray Recoil electron θ Incident x-ray λ' λ (a) (b) dσCompton/dΩ E E'
pendent of Z and approximately proportional to material density when computed per unit volume of such materials. Hydrogen, however, is an exception to this trend, as the absence of neutrons in its atom leads to an approximate doubling of electron density. Hence, hy-drogenous materials have a greater Compton scattering probability than non-hyhy-drogenous materials of the same mass. [1].
2.2.4. X-ray attenuation
Photoelectric absorption, Rayleigh and Compton scattering entail a certain attenuation of the x-ray beam traversing a given material. Considering N monoenergetic x-ray photons incident on a thin slab of a given material with thickness dx and unit length interaction probability μ (Figure 2.9), the change in the number of photons dN can be given by [39]:
x N
dN =−µ d . (2.11)
The quantity μ is known as linear attenuation coefficient and, as it can be deduced from (2.11), has the unit cm-1.
Figure 2.9. An x-ray beam attenuated by a material with thickness dx and a linear attenuation
coef-ficient μ.
The integration of (2.11) over a material thickness l gives:
∫
∫
=− l N N x N dN 0 0 d µ . (2.12)In (2.12) N0 and N stand for incident and transmitted number of photons, respectively. The
solution of (2.12) leads to the Beer-Lambert law:
l
e N
N = 0 −µ . (2.13)
The observation of (2.13) reveals that the attenuation of the monochromatic x-ray beam traversing a material is an exponential phenomenon. Note that (2.13) describes the change in the number of photons that have not interacted with the material and are exiting the in-spected object. These are also known as primary photons [39].
For a case where a polyenergetic beam traversing several materials is considered, (2.13) will take the following form:
( )
( )
( )
∑ − = = Q q q E lq E N E N 1 0 exp µ , (2.14) N0 N dx μwhere μq(E) is the linear attenuation coefficient function of a given material q∈{1, …, Q}
and lq is the corresponding thickness. Note that Q is the total number of materials
trav-ersed.
The total linear attenuation coefficient μtotal is the sum of the different interaction
pro-cess probabilities (Figure 2.10) [39]:
(
photo Rayleigh Compton)
an
total τ σ σ
µ = + + , (2.15)
where τphoto, σRayleigh and σCompton are the interaction probabilities probability per material
el-ement (e.g. atom or molecule) of photoelectric absorption, Rayleigh scattering and Comp-ton scattering, respectively. In addition, na is the number of the corresponding material
elements in a unit volume.
From Figure 2.10 it is apparent that for water the individual interaction probabilities and the resulting total attenuation are strongly dependent on incident x-ray photon energy. For low energies (<30 keV) the dominant interaction is the photoelectric effect. In contrast, Compton scattering constitutes the dominant fraction for photon energies greater than 50 keV. Although not dominant, Rayleigh scattering still remains relevant for low energy x-ray photons (<15 keV).
The probability of interaction with a given material depends on the number of atoms encountered by the x-rays per unit distance. Material density (measured in g/cm3) has a direct influence on this number. Doubling the density results in twice as many atoms en-countered per unit distance by the x-rays while traversing the material. Hence, the linear attenuation coefficient is proportional to material density. [1].
Figure 2.10. The total linear attenuation coefficient of water (μtotal) as a function of photon energy with its different components: photoelectric absorption (τphoto), Rayleigh (σRayleigh) and Compton (σCompton) scattering. The example was generated with the aid of an existing internal simulation tool (Chapter 4.2).
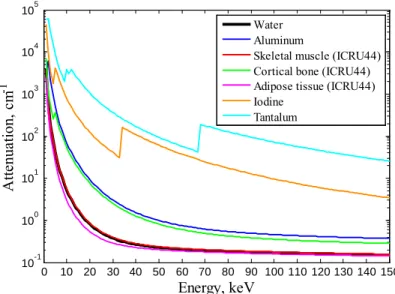
An illustration of the linear attenuation coefficient functions for water, aluminum, skel-etal muscle, cortical bone, adipose tissue, iodine and tantalum is provided in Figure 2.11.
0 10 20 30 40 50 60 70 80 90 100 110 120 130 140 150 10-4 10-3 10-2 10-1 100 101 102 103 104 Energy, keV A tte nu atio n, c m -1 µtotal τPhoto σRayleigh σCompton A tte nu atio n, cm -1 Energy, keV
Figure 2.11. Linear attenuation coefficients as functions of energy for different materials.
Note that linear attenuation coefficients of tissue materials are close to water with the exception of cortical bone, which exhibits a higher material density. The functions present-ed in Figure 2.11 are mostly smooth with the exception of discontinuities visible for iodine and tantalum. These discontinuities are called “absorption edges” and they arise due to the increase of photoelectric electric effect probability when the energy of the x-ray photons begins to exceed the binding energy of the inner shell (e.g. K, L, M, etc.) electrons [1]. This entails an increase in the number of material electrons available for interaction [1].
Finally, it is also worth visualizing the attenuation of the incident x-ray photons in the inspected object (Figure 2.12). In order to do this, the x-ray tube spectrum presented in Figure 2.3 is used and (2.14) is applied for various materials with different thicknesses.
Figure 2.12. Incident x-ray spectrum (black) attenuation in the object sampled at equal 1 keV
in-tervals. Firstly, part of the photons is lost due to added filtration of 0.2 cm aluminum (blue). Then, an additional loss occurs in skeletal muscle and adipose tissue (red). Finally, if iodine is added (green), more photons are lost and a discontinuity in the spectrum due to the K absorption edge can be visible around 33 keV. The example was generated with the aid of an existing internal simula-tion tool (Chapter 4.2).
0 10 20 30 40 50 60 70 80 90 100 110 120 130 140 150 10-1 100 101 102 103 104 105 Energy, keV A tte nu atio n, c m -1 Water Aluminum
Skeletal muscle (ICRU44) Cortical bone (ICRU44) Adipose tissue (ICRU44) Iodine Tantalum 0 10 20 30 40 50 60 70 80 0 1 2 3 4 5 6 7 8x 10 10 Energy, keV N um be r of phot ons Tube output Al 0.2 cm Al 0.2 cm + S. musc. 3 cm + adip. 2 cm
2.3.
Detection of x-rays
Modern day x-ray detectors are digital flat panel detectors. The technology applied in these image receptors is similar to that of a laptop computer display (Figure 2.13). [39].
Instead of wiring individual display elements (or pixels), a series of vertical and hori-zontal electrical lines are used. Combined with appropriate read-out logic, these lines can address each individual element. [1]. The technology applied in digital flat panel detectors is called active matrix array, because they incorporate an active switching device, which is the thin film transistor (TFT) [2], [39]. Hence the other name often attributed to the active matrix array – the TFT array [2].
Chapters 2.3.1 and 2.3.2 give detail on the two different types of flat panel detectors. Chapter 2.3.3 introduces key concepts behind photon counting detectors.
Figure 2.13. General structure of a flat panel x-ray detector.
It is also worth noting that other technologies (not covered in the present thesis) for x-ray detection also exist. These include, for example, charge-coupled devices and comple-mentary metal-oxide-semiconductors.
2.3.1. Indirect conversion
For indirect conversion type flat panels a phosphor layer (typically Gd2O2S or CsI) is used to convert incident x-rays to fluorescent light [1]. The intensity of the light is propor-tional to the ray intensity and can thus vary from pixel to pixel in the case of a non-flat x-ray beam. This light is then converted to electric charge with the aid of photosensitive ele-ments (photodiodes) of the detector pixels. For a given pixel, the charge level is propor-tional to the light intensity emitted from the phosphor in the vicinity of that pixel. This charge is stored in the detector element until the TFT array is read out. [39]. The term "in-direct" stems from the fact that the x-ray energy absorbed in the phosphor layer is transmit-ted to the photodetector by means of visible light photons [1]. The indirect conversion based x-ray detectors are currently the most dominant types used in general digital
radiog-Electronic control
Triggers the switching diodes
Analog-to-digital converter Multiplexer
Reads out the electronic signal
Photodiode or photoconductor
Converts x-ray photons to light or electrons
TFT array
Collects the electrons from the upper layer
The materials used in indirect conversion x-ray detectors can be structured (CsI) or un-structured (Gd2O2S). Structured materials are preferred, since the crystals exhibit a needle-like shape, which reduces lateral scattering of visible light photons and increases the num-ber of x-ray photon interactions. For unstructured materials, the light photons have a higher probability to deviate from their trajectory (lateral scattering) thus contributing to a reduc-tion in spatial resolureduc-tion [2].
2.3.2. Direct conversion
In the direct conversion approach, a photoconductor is used directly on top of the TFT array. The x-rays are directly converted to electron-hole pairs, which are then drawn to-ward the respective electrodes by means of an electric field. [2]. The electrons are directed toward the detector pixels and the generated charge is stored temporarily on the capaci-tance until readout. The charge magnitude among different pixels corresponds to the inten-sity variations of the incident x-ray beam. [39].
Two principal advantages of direct conversion are the absence of an intermediate con-version stage, which increases x-ray concon-version efficiency (~8000 electrong-hole pairs for direct versus 1000–2000 for indirect), and higher spatial resolution due to lower levels of lateral scattering of electrons (direct conversion) compared to visible light photons (indi-rect conversion).
The most widely applied photoconductor material is a-Se, which, unfortunately due to its low Z is used primarily in mammography (thickness limitation). Other proposed
photoconduc-tors include CdTe, HgI2 and PbO. [39].
2.3.3. Photon counting detectors
X-ray photon counting detectors utilize the principle of direct conversion with the dif-ference that each photon is discriminated by the individual pixel electronics. Thus, for each incident x-ray photon the electronic counter is incremented (a count is recorded). A more advanced derivative of these image receptors are photon counting energy discriminating (spectrometric) x-ray detectors. This type of detector is able to collect energy information on the incident x-ray photons. [39]. As a result, the photons can be classified, based on their energy into several discrete energy channels or energy bins, the number of which varies from a few channels (typically 2–8) [4]–[6] to a hundred with a width of ~1 keV, depending on the electronic circuit behind the pixels [7], [8]. Materials used for the photo-conductor layer in photon counting x-ray detectors include such semiphoto-conductors as Si [44] and CdTe [4], [6], [7] or its Zn doped version (CdZnTe or CZT) [8].
Despite their virtues, energy-resolved PCDs suffer from several undesirable effects de-grading their performance. These include: charge sharing [7], fluorescence or scattering [7], induction and photon pile-up [8], [45].
In the first case (charge sharing), the charges generated from an interaction with an cident photon are collected by several adjacent pixels. The significance of the effect in-creases with the decrease of pixel size. It impacts detector spatial resolution and gives rise to correlations between signal and noise for adjacent pixels. [7].
Other means of disturbing the x-ray photon induced charge in reaching the correct pixel include fluorescence and scattering [7]. In the case of fluorescence, through photoelectric absorption, the incident x-ray photon gives rise to a characteristic x-ray photon. This pho-ton may or may not arrive on the correct pixel. Additionally, through Comppho-ton scattering in the photoconductor layer, the trajectory of the incident x-ray photon may change enough
to create a charge sufficiently far from the correct detector pixel limiting the possibility of that charge to reach the respective pixel.
In the case of induction, for a given pixel, the charge collection on the electrode will give rise to a low level signal on the neighboring pixel electrodes through the induction phenomenon. This signal will appear in the low energy channels of the neighboring pixels considered.
Finally, the photon pile-up is a result of the detector electronics being incapable to dis-criminate between signals obtained from two photons arriving within a time interval short-er than the dead time of the circuit. The dead time is the limiting time intshort-erval during which the system can still discriminate between two temporally adjacent pulses. As a result of pile-up, the two photons are counted as a single photon giving rise to higher electronic pulse amplitude and, consequently, attributing a higher energy to the photon. [8].
In order to reduce the impact of the above described undesirable effects, signal pro-cessing techniques can be employed. For example, a method for correcting induction and charge sharing distortion for energy discriminating detectors can be found in [7].
The net effect of all the listed performance distortions (with the exception of pile-up) can be modeled by a detector response function. For a fixed detector pixel, this function describes the probability of a single photon being detected at its corresponding energy. An example of the response function measured by a prototype 16 pixel linear (1D) spectromet-ric CdTe detector (developed at the LDET laboratory) using a radioactive source (Co-57) is given in Figure 2.14 [8].
Figure 2.14. Spectral response measurements for 16 different pixels (various colors) of a
spectro-metric detector. Channel width is equal to 1.2 keV. Ideally one would expect a single peak around energy bin #102 corresponding to the emitted photon energy of Co-57 (122 keV). However, charge sharing, induction, scattering and fluorescence within the detector modify such an expectation.
Spectrometric x-ray detectors can give way to energy-resolved x-ray imaging for all current modalities (e.g. radiography, CT, etc.). The resulting image quality advantages are substantial. More precisely, an increase in CNR can be achieved [9] as well as dose and artefact reduction [10]. These detectors also bring new x-ray imaging capabilities into fo-cus both in radiography and CT. These include, for example, the ability to differentiate between present material components in the object and estimate their equivalent thickness-es and relative ratios (soft tissue, bone, glandular, contrast agent enhanced tissue, etc.) by
0 1000 2000 3000 4000 5000 0 25 50 75 100 125 150 N um be r of phot ons Energy bin Induction
Co-57 peak–CdTe fluorescence Charge sharing
Co-57 peak
2.4.
From radiography to Computed Tomography
In all the multitude of x-ray imaging modalities available today, x-ray radiography and tomography remain the most common and widely used. Chapter 2.4.1 introduces the con-cepts behind radiography and serves as a basis for Chapter 2.4.2, which introduces the principles of x-ray tomography. Both integration mode and energy-resolved modes are discussed for each modality. For the latter corresponding specific applications are also provided.
2.4.1. Radiography
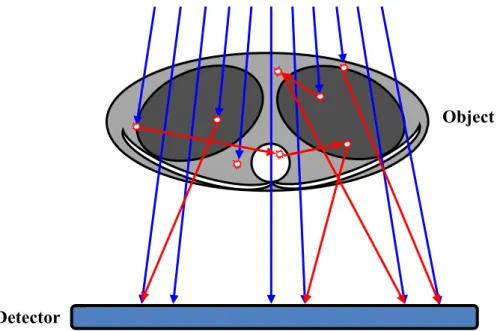
Radiography (or projection radiography) refers to the acquisition of a 2D x-ray projec-tion image of a 3D object (Figure 2.15). The resulting 2D distribuprojec-tion reflects the variaprojec-tion in object attenuation viewed by different image receptor pixels. [1].
Figure 2.15. Illustration of a radiographic acquisition. Primary and scattered x-rays are marked in
blue and red respectively. Note that scattered x-rays deviate from their initial trajectory through photon-matter interactions in the object.
Assuming the absence of charge sharing for each pixel p=(x,y) of a standard flat panel detector the following expression can be written for the measured x-ray intensity I(p):
( )
=∫
2( ) ( )
1 d , E E E E E N E D I p p , (2.16)where E1 and E2 are the lower and upper energy bounds of the x-ray spectrum, D(E) (0 <
D(E) <1) is the detector efficiency and N(p,E) is the number of photons with energy E traversing the object and incident on pixel p. Since the considered detector type performs an energy integration of the x-ray signal, it can also be called integration mode detector.
In order to reflect the changes in object attenuation measured by each pixel, the x-ray intensity from (2.16) is normalized by the raw x-ray intensity I0(p) (with no object) and a
negative log transformation is applied:
( )
( )
( )
( )
=∫
( ) ( )
− = 2 1 0 0 0 , , d log E E m II I D E N E E E A p p p p p , (2.17) X-ray tube Object Detectorwhere Am(p) is the measured x-ray attenuation and N0(p,E) is the number of raw x-ray
pho-tons with energy E incident on pixel p. Examples of simulated x-ray intensity and attenua-tion images (scatter is not considered) are provided in Figure 2.16.
Assuming the absence of scatter, the development of (2.17) with the aid of (2.14) and (2.16) leads to an expression linking the measured x-ray attenuation Am(p) to the actual
object attenuation A(p,E):
( )
( ) ( )
(
( )
)
( ) ( )
( )
= ∑( ) ( )
− − = =∫
∫
Q q q q E E E E m A E E l E E E N E D E E E A E N E D A 1 2 1 0 2 1 0 , , , d , d , exp , log p p p p p p p µ , (2.18)From (2.18) it is apparent that the measured x-ray attenuation is non-linearly related to the true object attenuation. Am(p) can be considered an “effective” attenuation, which is
indicative of the total object attenuation in the direction of the considered pixel averaged over the x-ray spectrum energies. Note that for a monochromatic x-ray spectrum, the ex-pression simplifies and the measured attenuation is directly equal to the true attenuation.
Figure 2.16. X-ray intensity (a) and attenuation (b) images acquired with the aid of an existing
internal simulation tool (Chapter 4.2). Pixel size was 1 mm. Note that the attenuation image (a) provides contrast that is superior to that of the intensity image (b).
In the case of an energy-resolved PCD, photons as a function of discrete energy bins are measured per pixel. Under the assumption that the detector suffers from no or limited amount of non-linear effects (e.g. pulse pile-up), an expression equivalent to (2.16) can be obtained:
( )
p D N( )
pNd = × , (2.19)
where Nd(p) and N(p) are detected and incident (on the detector pixel) number of photon
vectors (functions of energy channel), respectively, and D is the detector response matrix (DRM) [46]–[48].
The DRM describes the probabilities of detecting a photon in a given energy channel as a function of the respective photon energy. Thus, for example, a given element of the
re-x, pixels 64 128 192 256 320 384 448 512 64 128 192 256 320 384 448 512 0 1 2 3 4 5 6 x, pixels y, pi xe ls 64 128 192 256 320 384 448 512 64 128 192 256 320 384 448 512 1 2 3 4 5 6
x 107 Attenuation image, unitless Intensity image, keV
(b) (a)


![Figure 4.3. Illustration of different Sindbad components and a simulation of a realistic phantom [68] in radiographic and tomographic modes](https://thumb-eu.123doks.com/thumbv2/123doknet/14696579.746248/65.893.151.765.603.1002/illustration-different-sindbad-components-simulation-realistic-radiographic-tomographic.webp)