HAL Id: tel-01540446
https://tel.archives-ouvertes.fr/tel-01540446
Submitted on 16 Jun 2017HAL is a multi-disciplinary open access archive for the deposit and dissemination of sci-entific research documents, whether they are pub-lished or not. The documents may come from teaching and research institutions in France or
L’archive ouverte pluridisciplinaire HAL, est destinée au dépôt et à la diffusion de documents scientifiques de niveau recherche, publiés ou non, émanant des établissements d’enseignement et de recherche français ou étrangers, des laboratoires
Elissa Cousin
To cite this version:
Elissa Cousin. Three Essays on Water Economics. Economics and Finance. Université Paris-Saclay, 2017. English. �NNT : 2017SACLN026�. �tel-01540446�
NNT :
2017SACLN026
T
HESE DE DOCTORAT
DE
L’U
NIVERSITE
P
ARIS
-S
ACLAY
PREPAREE A
L’É
COLE NORMALE SUPERIEURE DE
C
ACHAN
(E
COLE NORMALE SUPERIEURE PARIS
-
SACLAY
)
E
COLED
OCTORALE N° 578
Sciences de l’homme et de la société
Spécialité de doctorat : Sciences Economiques
Par
Mme Elissa Cousin
Three Essays on Water Economics
Thèse présentée et soutenue à Cachan, le 19 mai 2017 :
Composition du Jury :
M. S. Saussier, Professeur, IAE de Paris, Rapporteur, Président du Jury
M. S. Garcia, Directeur de Recherche, INRA AgroParisTech Nancy, Rapporteur
Mme. K. Millock, Chargée de Recherche, Ecole d’Economie de Paris, Examinateur
Mme. E. Taugourdeau, Professeure, ENS Paris-Saclay, Directrice de thèse
I would like to thank my supervisor, Emmanuelle Taugourdeau, for accepting me as her PhD student. She has supported me in this endeavor, on a topic uncommon in the field of economics and continuously encouraged me to pursue this path.
I would also like to thank Professor Schluter from AMSE for his assistance in the area of econometrics and Professor Boucekkine for providing me reference and feedback on the dynamic model of Chapter 2. Moreover, I would like to thank Professor Saussier, Professor Garcia, Professor Milock and Professor Kempf for accepting to be members of the committee. Their constructive remarks during the pre-defense allowed me to improve the quality of this dissertation. And finally, I would like to thank Christophe Audouin for accepting to be interviewed and providing me with valuable information and advice on the water industry in France.
I further like to thank my colleagues for their inputs and feedbacks during the PhD seminars and during casual coffee breaks at the office. In particular, Imen, Lenka, Marine and Guillaume.
Last but not least, I would like to thank my husband, my parents, my brother and my friends for having hope and for supporting me financially and morally until the completion of my thesis.
Introduction 13
1 Optimal water main quality index 29
1.1 Introduction . . . 29
1.2 Literature Review . . . 33
I
A static cost minimization approach
40
1.3 Theoretical Model . . . 421.3.1 The water utility’s decision . . . 42
1.3.2 Function specification . . . 46
1.4 Simulation and Results . . . 48
1.4.1 Calibration . . . 48
1.4.2 Results: Country-level analysis of the quality index . . . 51
1.4.3 Results: Impact of regional differences on the quality index . . . 54
1.4.4 Cost recovery analysis . . . 64
1.5 Conclusion . . . 67
1.6 Appendix . . . 70
1.6.1 Appendix 1 . . . 70
1.6.2 Appendix 2 . . . 71
II
Profit maximizing water main quality index
73
1.7 Theoretical Model . . . 76
1.8 Simulation . . . 81
1.8.1 Impact of leakage detection activities on the optimal quality index 93 1.8.2 General discussion and political implication of the results . . . . 98
1.9 Conclusion . . . 101
1.10 Appendix . . . 102
1.10.1 Effect of Cost recovery . . . 102
2 Optimal switching time for water main replacement 104 2.1 Introduction . . . 104
2.1.1 Background literature on pipe replacement models . . . 105
2.2 Theoretical Model . . . 107
2.2.1 The water utility’s decision . . . 108
2.2.2 First regime . . . 109
2.2.3 Second regime . . . 110
2.2.4 Third Regime . . . 111
2.3 Defining functions . . . 116
2.3.1 Quantity demand function . . . 116
2.3.2 Water loss function . . . 117
2.4 Calibration . . . 119
2.5 Simulations . . . 121
2.6 Conclusion . . . 129
3 Water mains replacement and the role of outsourced water provision: A case study of French water utilities 132 3.1 Introduction . . . 132
3.2 Background . . . 136
3.2.2 Age and material of pipes . . . 138
3.2.3 Network size and customer base . . . 138
3.2.4 Type of service provider . . . 139
3.2.5 Objectives of the utility . . . 140
3.2.6 Groundwater, surface water or imported water . . . 141
3.2.7 Soft water or Hard water . . . 141
3.2.8 Price/tariff of water . . . 141
3.2.9 Knowledge of the state of network . . . 142
3.2.10 Geographical effects . . . 142
3.2.11 Financial situation . . . 143
3.2.12 Average revenue of the region . . . 143
3.2.13 Political incentive in public utilities . . . 144
3.3 Data Description . . . 144
3.3.1 Pre-estimation analysis of the explanatory variables . . . 145
3.3.2 Pre-estimation analysis of Replacement rates with network size and operator type . . . 153
3.3.3 Operator type and rate of replacement . . . 155
3.3.4 Generated variables . . . 157
3.3.5 Variable transformation . . . 159
3.4 The Empirical Model . . . 161
3.4.1 Endogenous variables . . . 161
3.4.2 Corner solution . . . 167
3.4.3 Heckit model and Two Part model . . . 168
3.5 Results . . . 172
3.5.1 Analysis of the Total Marginal Effects of Two-Part Model . . . . 188
3.6 Discussion . . . 189
3.7 Conclusion . . . 193
3.8.1 Selection bias due to operator type . . . 195
Conclusion 200
1 Illustration of a typical water distribution network . . . 14
2 The composition of main materials in the U.S. and Canada. . . 15
3 Age of mains as the percentage of the total network in the U.S. and Canada. 15
4 Average age of pipes in France. . . 16
1.1 The impact of the base loss rate (↵0) on the quality index for average
values of France and U.S. . . 53
1.2 The impact of the base loss rate (↵0) on the quality index for Lyon
and Paris at different levels of water production cost (⇢). . . 58
1.3 The impact of the base loss rate (↵0) on the quality index for Sainte
Lizaigne and Tencin at different levels of water production cost (⇢). 59
1.4 The impact of the cost of water production (⇢) on the quality index
for the French utilities with ↵0= 0.6. . . 59
1.5 The impact of the price elasticity of demand (✓) on the quality index
for Sainte Lizaigne and Lyon ↵0= 0.6 and β = 1. . . 61
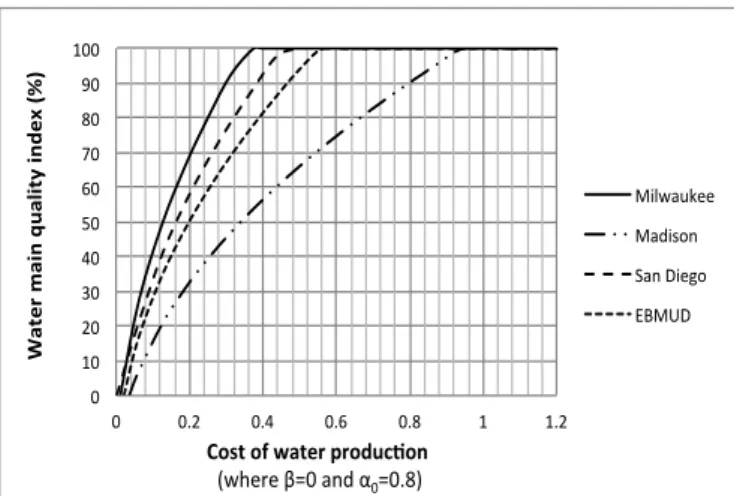
1.6 The impact of the cost of water production (⇢) on the quality index
for the US utilities with ↵0= 0.8. . . 63
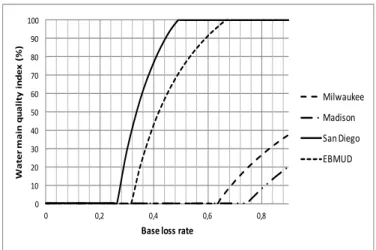
1.7 The impact of the base loss rate (↵0) on the quality index for the four
utilities in the U.S. given β = 0. . . 64
1.8 The impact of the cost recovery (β) on the quality index for EBMUD
1.9 The impact of the base loss rate (↵0) on the “net gain” of Tencin and
Milwaukee . . . 66
1.10 The impact of the cost recovery (β) on the quality index for Lyon . . 72
1.11 The impact of leakage detection (mm max) on the quality index (top left) and on the water loss rate (top right) for rural utilities at β = 0.6, ↵0 = 0.4 and ✓ = 0.2. . . 94
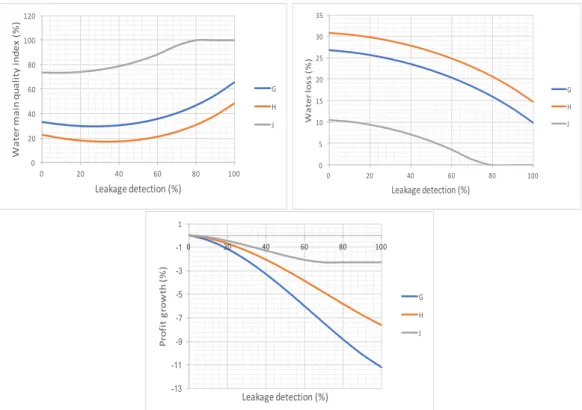
1.12 The impact of leakage detection ( m mmax) on the quality index (left) and on the water loss rate (right) for urban utilities at β = 0, ↵0 = 0.4 and ✓ = 0.2. The bottom graph shows the impact of leakage detection on the growth of profits. We set β = 0 because urban utilities reach Indices of 100% for very small values of β. . . 97
2.1 The impact of cost recovery (β) and the Rehabilitation (R) on the switch-ing time with γ = 0.03, ✓ = 0.2. . . 122
2.2 The impact of cost recovery (β) and the price elasticity of demand (✓) on the switching time with γ = 0.03 and with rehabilitation. . . 125
2.3 The impact of cost recovery and the unit cost of water production (⇢) on the switching time with γ = 0.03, R = Rmax and ✓ = 0.2. . . 127
2.4 The impact of cost recovery and the initial water loss rate (↵) on the switching time with γ = 0.03, R = Rmax and ✓ = 0.2. . . 128
3.1 Distribution of utilities around France and the sample distribution of utilities . . . 152
3.2 Proportion of utilities operated in-house . . . 153
3.3 Correlation between the rate and the length of mains . . . 155
3.4 Correlation between population and length of mains . . . 155
3.5 Correlation between in-house operated utilities and the size of the network156 3.6 Correlation between in-house operated utilities and zero replacement rates157 3.7 Correlation between leakage and demand . . . 164
3.8 Correlation between rate and density . . . 165
3.9 Correlation between water loss and density . . . 166
1.1 Calibration and results for the United States and France . . . 53
1.2 Calibration of parameters for the different water utilities in France. . . . 56
1.3 Calibration of U.S. water utilities. . . 62
1.4 Profit maximizing water main quality indices of urban utilities with dif-ferent organizational structures. The base loss rate is set to ↵0 = 0.4, and the cost of good quality mains is r = 12, 000Euros/km . . . 84
1.5 Profit maximizing water main quality indices of rural utilities with dif-ferent organizational structures. The base loss rate is ↵0 = 0.4 and the cost of good quality mains is r = 3, 000Euros/km. . . 90
2.1 Calibration of parameter values . . . 121
3.1 Summary statistics . . . 146
3.2 Groundwater variable transformation . . . 159
3.3 Skewed variables . . . 160
3.4 Summary statistics for 2010 tariff . . . 162
3.5 Log transformation of density without ouliers . . . 166
3.6 First stage regression of ivregress and ivprobit . . . 174
3.7 IVOLS estimations with tariffs from 2010 and 2014 from different periods. Aquitaine is left out as the reference term for the regional effects. rev4 is left out as the reference term for the revenue effect. . . 176
3.9 Estimation results . . . 184 3.10 In bold are the regions with high intercommunality (greater than 14
communes per utility). Those with higher groundwater percentages are associated with regions corresponding to mountainous and/or rural areas. 192 3.11 Switching models to test “self-selection” bias . . . 199
This dissertation focuses on the issue of water infrastructure renewal in potable water distribution networks. This subject is related to the literature of water supply eco-nomics. Sound management of water supply is essential for our society because water is unlike any other good; it is vital to human survival. The particularity of water is that water demand always exists in various forms such as drinking water, gardening water, in recreational forms, industrial use, and of course in agricultural use. We focus particularly on urban water supply; which is supplied by local water utilities. Tap water is treated first at treatment plants for potabilization and then transported through a complex network of water mains that are hidden under our feet, as illustrated in Figure
11. Water utilities are faced with an obligation to always satisfy the volume demanded
by households. There are no substitutes for water; thus, price elasticity of demand is very low. In the event of droughts or rare climate problems, water utilities must find ways to guarantee supply. This is why it is essential to focus on supply side economics of water. Despite the essentialness of water supply in our daily lives, the infrastructure that guarantees this supply has been neglected until recently. The consequence we face today is the pressing need for water mains renewal. In most of the developed countries, the installation of water mains had begun around the beginning of the 20th century. The particularity of water mains is that they are long-lived. The average expected life-time of water mains could range from 50 years to 100 years or even more. The oldest mains are commonly found in large cities; whereas fairly young mains can be found in
1This figure is found on the EPA website:
Figure 1: Illustration of a typical water distribution network provided on the website of EPA
rural areas. According to a recent report by AWWA (2012), water utilities in the U.S. are confronted with a daunting era of water mains replacement. Many networks face severe cases in which mains are already obsolete and on the verge of breaking. The main reason stems from the fact that replacement of mains have been lagging behind
significantly in the United States and France alike2. Before we talk about the reasons
behind the failing water infrastructure, we present a few facts and figures concerning the current condition of the water mains in France and the United States.
Figures 2, 3 and 4 reflect the current state of the water main networks in France and the north Americas. Figures 2 and 4 show that about half of the mains are composed of cast iron and PVC (Ductile iron is also prevalent in the U.S.) materials. According to Folkman (2012), cast iron mains have the highest failure rates, while PVC have the lowest. Although the lifetime of some pipes can be expected to last to up to 100 years at installation, due to the corrosivity, these expected lifetimes can vary. Even PVC pipes
2We focus on these two examples in particular, since we use data from these two countries for
Cast iron (28%) Duc2le iron (28%) PVC (23%) other (21%)
Figure 2: The composition of main materials in the U.S. and Canada.
0 - 10 years
15%
10 - 20
years
18%
20 - 50
years
44%
over 50
years
22%
other
1%
x < 1960
20%
1960 < x <
1970
25%
x > 1970
55%
Mainly PVC Mainly cast iron Mainly PVC Mainly cast iron Mainly PVC Mainly cast ironFigure 4: Average age of pipes in France.
that are known for its durability could range from 50 to 100 years (AWWA, 2012). Therefore, as we can see in Figure 3, almost a quarter of the total length of mains in the north Americas must be taken under consideration for imminent renewal. Moreover, about 45% are aged between 20 to 50 years, which means that there are candidates for renewal in the very near future. Similarly in France, about 20% are aged beyond 50 years and another 25% that are nearing 50 years. Overall, in both parts of the world, utilities face water main renewal needs. In both countries, annual replacement rates should be double of what it is currently observed today. For instance, in the U.S. the annual replacement rate is about 0.5%, which means that mains are expected to last for about 200 years (Morrison et al., 2013). Similarly in France, the rates are about 0.6% on average; which is half of the necessary amount. Given these information, we naturally ask ourselves why network renewal is behind schedule and what are the consequences of postponing renewal?
Before answering why network renewal is behind schedule, we first investigate the consequences of postponing water mains replacement. One of the main consequences of obsolete water mains is water leakage. Water lost through the form of leakage wastes the resources put into the production of potable water, such as energy and chemicals used
for treatment purposes (Martins et al., 2012; AWWA, 2012; Xu et al., 2014). Leakage also allows pollutants to compromise the quality of the water (Colombo and Karney, 2002). Moreover, water loss is foregone potential revenue for the water utilities. Severe cases of obsolescence could lead to main breaks, which involves serious repercussions on the community. It results in traffic interruptions, flooding and temporary supply interruptions (Garcia and Thomas, 2003). Despite these risks, why is network renewal behind schedule?
There are several reasons that could explain this phenomenon. They are both eco-nomic and socio-political factors. For instance most leakages in water mains are “invis-ible” to the naked eye. Of course, once it is visible it is often due to main breaks, which is the worst case scenario where these mains must immediately be replaced. Leaky pipes could be replaced before it is too late. Thanks to metering devices, utilities can measure the volume of water that is lost between the treatment plants and the service connections. In developed countries the majority of water loss is composed of leakage. However, water loss can easily be neglected by utilities due to the very small value at-tached to water. Since the unit cost of water production is very small, water loss could be compensated by pumping more water into the system or by raising water pump-ing pressure. In comparison, imagine an oil pipeline that is leakpump-ing, the authorities in charge of oil supply may not easily neglect such leakage. Hence, the fact that losses are invisible and that the costs are cheap partly explain the motivation behind network renewal. We now present further economic factors that influence the decision for water mains replacement.
According to a technical report based on French utilities by Canneva et al. (2012), one determining factor of mains replacement can be explained by the degrees of economies of scale. If utilities operate with economies of scale, heavy investment costs can be bet-ter dealt with. This is because costs can be divided over a large volume of output. They observe that in a rural utility, the burden of the water infrastructure cost per inhabitant is greater compared to an urban utility; which can explain why costly investments tend
to be put aside. They also mention seasonal factors that differentiate the challenges faced by urban water supply to rural water supply. For instance, water consumption could vary significantly for one season to another due to touristic reasons and families with second houses. This means that networks need to be adapted to the potential capacity, which adds to the cost burden. Indeed financial feasibility is one of the main reasons behind water mains replacement decisions. As Mizutani and Urakami (2001) writes, in a network industry where it is heavily capital intensive, the relative size of output to the network length is important to consider. A smaller length of network and higher output leads to cost advantages. Due to this difference in the relative size, they have seen ten-fold differences in the price of water charged to users.
There is a vast literature on the study of economies of scale in water industries. The main contributions are summarized in the paper by Saal et al. (2013). According to their results, most studies found that long-run economies of scale prevail for average sized utilities. However, the discrepancies arise in rural and large urban utilities. For example, Sauer (2005) shows that a large proportion of rural utilities operate with economies of scale and that these utilities could reduce their average costs by increasing output. On the other hand, studies showed that the degrees of economies of scale tend to decrease as the size of operation increases; especially for excessive volumes of output which could be observed in the largest utilities (large urban cities). These results are contradictory to what has been mentioned in the report by Canneva et al. (2012). The analysis on the degrees of economies of scale in water industries is not that straightforward. Indeed, the greater the output (volume of water supplied), the smaller the average cost per output; however, exceeding a certain threshold of output could backfire on the utility in terms of rising total water production costs. One of the main characteristics of water distribution industries is that water demand has to be satisfied; hence, an excessive amount of demand may lead to increasing costs due to higher costs of water production which include importing water from other utilities, expanding storage and treatment plant capacity and replacing mains with larger ones.
Therefore on the one hand, small rural utilities could benefit from expansion of output to cover their infrastructure costs; however, on the other hand, very large cities face output limits that can create diseconomies of scale. Merging of small utilities have been suggested as a remedy to benefit from economies of scale in the paper by Mizutani and Urakami (2001); however, Martins et al. (2006) writes that merging utilities should be decided with care in order to make sure not to become too large which would trigger diseconomies of scale.
Another difficulty faced by utilities in terms of water mains replacement decision concerns cost recovery. In order for water utilities to assure sustainable management of water services, “correct” pricing is essential. In Europe, there are guidelines that have been defined concerning water pricing. It is known as the principle of cost recovery which is specified in Article 9 of the European Water Framework Directive of the year 2000. It emphasizes the concept of reflecting the total cost of water services on the price paid by users, including the environmental and resource costs associated with water extraction (Dige, 2013; Kanakoudis et al., 2011). However implementing full cost recovery can be challenging. This is because water pricing is a sensitive topic.
Water in society is perceived as a public good, a free-access good and a human right. Therefore, debates on raising water prices are highly unpopular. As Hanemann et al. (2006) states, “it is notoriously difficult for publicly owned urban water utilities to obtain political approval for even trivial rate increases while other household utilities such as cable television raise their rates with impunity”. Moreover, in the U.S., most water agencies set prices to cover the past investment costs associated with water networks, whereas future replacement costs are not included. Again, this is due partly to the fact that the majority of water services in the U.S. are publicly owned; hence, “there is a strong ethos to avoid making profit on the sale of water”. There is indeed a large difference between the prices observed in France compared to the U.S., which is presented in the first chapter of this dissertation. However, like oil, metal and wood, water is a natural resource that is defined as an economic good. It has officially been
recognized as an economic good at the 1992 International Conference on Water and the Environement in Dublin (Hanemann et al., 2006). Bottled water that are sold in supermarkets can be easily associated to a private economic good; however, the water we use to shower at home, extinguish fires and provide fountains in schools can be easily forgotten that there is any economic value attached to it. Looking at the time of the Roman Empire, water was seen as essential to the existence of their civilization. We can see today in parts of Europe the remains of their highly skilful water conveyance systems, known as Aqueducts. Investment in water infrastructure was the key to their sustainability.
There have been solutions suggested to overcome this sensitive subject. Qureshi and Shah (2014) explains that “effectively communicating an infrastructure’s improvement needs is vital to obtain approval for investment funding via rate increases”. If the public were exposed to better awareness of the consequences of obsolete water infrastructure, price increases induced by cost recovery may not appear as a taboo.
In addition to the difficulty of society’s acceptance towards price hikes, utilities themselves are reluctant to raise prices due to the potential negative impact on revenues. There is a large literature that is based on estimations of price elasticities. According to Olmstead et al. (2006), there exists a perception that consumers do not respond to water price signals. However, based on US residential demand data, they find an elasticity of -0.33. Due to the presence of somewhat elastic behavior, regions that have a dry climate install certain pricing structures such as the Increasing Block pricing method where marginal prices increases with quantity consumed. This type of pricing helps control demand at times of scarcity. However, due to price caps and profit restrictions, efficient pricing is challenging for utilities. Meta analysis results reveal a large range of elasticity values (Espey et al., 1997; Arbu´es et al., 2003; Yoo et al., 2014). According to the literature, the value of elasticity varies significantly from one study to another primarily due to difference in the choice of explanatory variables, estimation techniques. As we can see, even though price elasticity of demand for water is small and sometimes
close to zero, in some cases high prices could result in significant reduction of water demand. Utilities are already facing a fall in domestic demand today, mainly due to the rise in water-efficient home appliances (Barraqu´e et al., 2011); hence, rate increases are unpopular. Because water pricing is not a straightforward issue; there exists a vast literature based solely on the structure of water pricing. It is said that the usual marginal cost pricing method for assuring efficient allocation is not compatible with natural monopoly firms operating with economies of scale; which is the main characteristic of water utilities. This is why the literature on pricing structures is quite dense. The main pricing structures common today are based on second-best solutions such as increasing and decreasing block tariffs, two part tariffs and Ramsey pricing. These methods are welfare improving and also allow utilities to recover costs (Saal et al., 2013). Throughout this dissertation we study the importance of cost recovery of water mains replacement.
As we mentioned in the beginning, political factors could play a key role in influenc-ing prices because opinion of voters on prices has influence on electoral votes (Chong et al., 2015; P´erard, 2009). This means that the organizational structure of water util-ities have a role in the decision making process of water utilutil-ities concerning network renewal. There exists a large literature that debates over the preference of public over private ownership and vice versa of water utilities. Overall, the results are conflicting. While privatization has proven beneficial on the grounds of better technical knowledge and efficiency, the actual results on “efficiency” are quite conflicting (P´erard, 2009; Dore et al., 2004; Cavaliere et al., 2015). First of all the notion of privatization in the water sector is not homogeneous. For instance the operation of French utilities differs in gen-eral from the European norm where ownership of water infrastructure belongs to the state. In comparison, in the U.K., when privatization occured, even the infrastructure fell under private ownership. As Dore et al. (2004) writes, based on the textbook the-ory of economics, the traditional concept of privatization which is based on increased efficiency and benefits for consumers via a reduction in prices is not exactly what we observe in the water industry and many industries alike (electricity, telephone line and
railway companies) that experience zero to very small competition, which is a typical characteristic of natural monopolies. According to their study, the U.K. privatization of water industry showed that the improvement in water quality is probably one of the strongest benefits of privatization; however, they also argue that this is also probably because of the simultaneous installation of regulatory authorities that oversaw water quality. Similar results concerning better water quality under outsourced provision is revealed in the paper by Chong et al. (2015). However, along with their previous article on private participation, they reveal that better performance is associated with higher water prices (Chong et al., 2006). Furthermore Dore et al. (2004) also states that in the French case, while one reason of rapid price increases due to privatization during 1994-1999 could be explained by large capital spending program for updating infrastructure; another reason could be explained by corruption through the presence of cross-subsidies, political arrangements and special privileges. Moreover, until recently, subsidies were extremely common in French water utilities even after a wave of privatization of water provision. At the time their paper had been written, two thirds of the capital expen-ditures were still funded by subsidies. However as Renaud et al. (2012) writes, now that subsidies are not allowed, cost recovery is enforced through higher prices. This is also why in general, the rise in water prices have been quite significant in the past years. According to Dore et al. (2004), the main failure of public sectors was the failure to enforce cost recovery principles that would have allowed sound budget planning for gradual network renewal investments.
According to the literature we presented, we can draw a few hypotheses concerning network renewal. (1) Water mains replacement should be less burdensome in terms of cost for water utilities that operate with economies of scale. (2) In Europe where cost recovery principles are enforced, water utilities may raise prices in association with network renewal. However, we have seen that price rises are extremely unpopular; hence, this may act negatively towards decisions on network renewal. (3) Furthermore, the literature shows that prices and decisions on network renewal could vary
depend-ing on the organizational structure. Private utilities may be more active in network renewal accompanied by setting higher prices; whereas public utilities may maintain lower prices which would slow down costly investments such as network renewal. Given these conflicting forces that could potentially influence positively or negatively water mains renewal, we evaluate in this dissertation the level of network quality that could either be cost-minimizing or profit-maximizing for the water utilities. Network quality is defined as the proportion of renewed mains to the total length of mains. We develop theoretical models based on cost minimization and profit maximization in the first and second chapter. In the third chapter we conduct an empirical study on the water mains replacement rates observed in France in 2013. Most of our analysis is based on French water utilities as access to up-to-date open-source data on all the utilities were available for France.
Introduction to the chapters of the dissertation
In the first chapter, I develop a cost minimization model and a profit maximization model to study the optimal water main network quality. In the second chapter I develop a profit maximizing switching time model to study the optimal “timing” of replacement of water mains that are already obsolete. And finally, in the third chapter I conduct an empirical analysis on the water mains replacement rates in France to study the impact of water service operator type.
First Chapter: Optimal water main quality index
The first chapter is divided into two parts. In the first part, we develop a cost minimiza-tion problem and in the second part we develop a profit maximizaminimiza-tion problem. Both models solve for the optimal water main network quality index. This quality index is defined as the ratio of good quality mains to bad quality mains in a given water main network. We consider mains that are older than 50 years as bad quality mains. A 100% quality index would imply that the water main network should consist only of
good quality mains; in other words, only of mains younger than 50 years. This level of quality index is associated with the minimum level of water loss. We use utility-level data from France and the U.S. in our simulations in order to take into account different characteristics of water utilities and how they impact the resulting water network qual-ity. The results could shed light on the reason why in some utilities we may observe high water loss accompanied with low water mains replacement rates (which was the initial motivation of this dissertation). The main results of our model show that several factors play a key role in determining the quality index. The index is extremely sensitive to the cost of water production, which means that utilities that depend on costly sources of water, such as imported water or surface water that requires a high degree of treatment must maintain a high water man quality index in order not to waste it away through leakage. The difference between a rural utility and an urban utility also has significant impact on the quality index. In a large urban utility, we often observe economies of network density, which is the characteristic of large demand size relative to the total length of the network. This implies that the trade off between the cost of water loss and the cost of good quality mains is significantly higher in large urban utilities than in rural utilities. Hence, in most cases the results show that the cost efficient quality index is very small (often 0%) in rural utilities compared to urban utilities (often 100%).
In this chapter, we further investigate the issue of cost recovery. In Europe, the cost recovery principle is enforced in the water industry. In other words, costs associated to the water distribution service should be reflected in the price paid by users. This means that network renewal costs should be included in the price as well. However, this also implies that prices would inevitable increase. If demand is assumed to be perfectly inelastic, cost recovery would not have any influence on demand; however, if demand is somewhat responsive to prices, the resulting optimal network quality index is affected. Results show that under pure cost efficiency measures, cost recovery has almost no impact; whereas under profit maximization objectives, cost recovery does have a large impact. This difference is due to the fact that cost recovery under cost
minimization only impacts demand, which in turn has an impact on the total water production. Overall, the effect of cost recovery is absorbed by the minor difference it creates in the total volume of water loss. However, under profit maximization, cost recovery has a direct effect on revenue; which consequently raises the optimal quality index significantly in comparison to the cost efficient quality index. However, results differ again between rural and urban utilities. Where price caps are low (particularly in public utilities), quality indices cannot reach 100% since prices exceed the price caps. Hence, overall, results show that rural utilities face the largest challenge in meeting high network quality while recovering costs. In other words water loss regulations and cost recovery principle may not be compatible in certain rural utilities due to the lack of economies of network density and price caps.
In the last part of this chapter, we investigate the impact of leakage detection activi-ties on the optimal network quality index. We show that utiliactivi-ties that engage in leakage detection activities can raise the “efficiency” of their network quality. This means that if the worst’ mains are correctly identified, water loss reduction could be achieved with a smaller quality index. This is particularly beneficial for large urban water utilities where roadworks and service interruptions due to network renewal could be highly disruptive to the community compared to a small rural utility.
Second Chapter: Optimal switching time for water main replacement
The model developed in the second chapter is very different to the ones in Chapter 1. The purpose of this chapter is to evaluate the optimal timing for utilities to re-place their “obsolete” mains. We suppose that there is a certain section of mains that have reached obsolescence (characterized by the rate of water loss) and that the utility must decide when to replace them. They have an option to rehabilitate mains before replacing them. The benefit of rehabilitation is that it costs much less than replace-ment and it extends the longevity of the current mains. The results we obtain show that rehabilitation is generally not “economical” in urban utilities where mains havealready reached obsolescence. This is primarily due to similar reasoning as in Chapter 1 concerning the trade off between the cost of water loss and the cost of replacement. Since water loss reduction is a high priority in very large urban utilities (in terms of cost efficiency), rehabilitation which only temporarily reduces leakage is not worth the cost of rehabilitation. On the other hand, in rural utilities, rehabilitation could be ben-eficial in terms of extending the longevity of the current mains; however, it is not the case for mains that are highly corrosive (those that degrade fast). On the other hand, once cost recovery is implemented; it is beneficial for both types of utilities to replace immediately. And finally, our results show that rehabilitation could be beneficial (in terms of extending the longevity) if water losses are smaller; in other words, if they are done before the mains have reached obsolescence.
Third Chapter: Water mains replacement and the role of outsourced
water provision: A case study of French water utilities
In the third chapter I study the factors that influence the rate of replacement of water mains in French utilities. The main focus of this chapter is to study the impact of in-house provision or outsource provision on the rate of replacement. We have seen in Chapters 1 and 2 that utility-specific characteristics could have a large impact on the quality of the water main network. However, in practice many qualitative factors such as the type of service provider (public, private, PPP) could have an impact on the performance of the utilities, as mentioned in the literature in the Introduction. The regression models used in this chapter are the Tobit-type 2 (Heckit) and the Two-Part model in order to deal with endogeneity in the water loss variable. We also test selection bias that might be caused by self-selection of water utilities into either in-house or outsource depending on the expectation of the need for network renewal. However, results show that there is no selection bias. The estimation results show that contrary to the theoretical results in chapter 1 that showed small network quality for rural utilities, the regression results show that replacement rates are negatively related
to total network length. We also observe a predominance of high replacement rates in small rural utilities. This discrepancy could be explained by the fact that for very small network lengths (smaller then 10 km), even for a short length of network that is replaced, the resulting proportion of replaced to total network length is naturally large. Moreover, in practice, water mains are often replaced alongside other roadworks in rural utilities. And thirdly, our regression results also reveal that replacement rates are indeed larger on average in very large urban utilities (greater than 10,000 inhabitants per commune); hence, it is consistent with the results obtained in Chapter 1.
The main conclusion that we draw from the results is that the replacement of mains are on average higher under in-house provision. However, results also show that out-sourced utilities with a contract that have been signed recently exhibit higher replace-ment rates; perhaps in response to the current need for replacereplace-ment. Nevertheless, on average, in-house provision is associated with higher replacement rates. This could be due to the fact that outsourced utilities may have objectives assigned by the local authority that differ from network renewal such as water quality improvement. More-over, in rural utilities, water losses are smaller in outsourced utilities, which justifies smaller replacement rates. Results also show that water loss, tariff, knowledge and in-tercommunality have a positive and significant effect on replacement rates. The fact that intercommuanlity has a positive effect implies that merging small communes could be beneficial in achieving better network quality. However, as we have seen in Chapter 1, merging utilities does not guarantee scale economies. It is important to compare the relative size of the network to the volume of demand.
Optimal water main quality index
1.1
Introduction
Water loss is a major issue that concerns all nations around the world. In developed countries, water leakage from water mains is the main source of water loss. In the U.S. “for decades, these systems - some built around the time of the Civil War - have been ignored by politicians and residents accustomed to paying almost nothing for water
delivery”1. Such a scenario is not exclusive to the U.S.; the presence of leakage from
water mains is a concern in Europe as well. The underlining reason why leakage is oftentimes neglected is because they are mostly “invisible” and is associated with very small monetary value. Moreover leakage reduction activities are very costly; hence, wa-ter utilities compensate leakage by pumping more wawa-ter or by adjusting wawa-ter pressure in the mains. The Water Framework Directive put forward by the European Union in 2000, is one example of a supranational level enforcement strategy which requires water utilities in Europe to be able to cover their total cost. In other words, it enforces utilities to set water tariffs that cover not only the cost of water supply but also the cost of leakage reduction (Elnaboulsi, 2009). However, water utilities are concerned that an increase in water tariffs may reduce the demand for water, which may lead to lower revenues. Lower revenues would inhibit utilities from engaging in leakage reduction.
In France, about 800 million euros are spent annually on replacing leaky mains. However, the current estimate of the need for mains renewal amounts to 1.5 billion euros, which is twice the current expense (Salvetti, 2013). Water utilities resort to pumping additional water and manipulating water main pressure since this is much cheaper and more practical than repairing or replacing mains. However, such temporary solutions cannot ensure water supply sustainability in the long run. Moreover, if only temporary solutions are implemented, water mains will keep aging, which will expose the utilities to a sudden surge in costs when the need for mains renewal becomes urgent (Elnaboulsi and Alexandre, 1998). For example, main breaks may occur frequently once the mains have exceeded their useful life, causing major disruptions in cities such as flooding, which would amount to high damage compensation costs (Morrison et al., 2013). Recently some projects have emerged to develop efficient methods for leakage reduction. For instance, the PALM project in Italy (2013) has developed a method that can help detect the origin of the leakage, facilitating maintenance and repair. Moreover,
with their “efficiency calculator”2, water utilities can estimate an optimal leakage ratio
which is cost-efficient. In other words, utilities will decide whether to replace mains according to this threshold level of leakage. In the first part of this chapter, we propose a model based on cost-efficiency but we depart from their approach by proposing a model that takes into account the cost-minimizing water main quality index : an index that shows the proportion of “good” (young) mains in the network. The optimal quality is based on the trade-off between the cost of “good” mains and the cost of water loss. Furthermore, in the second part of this chapter we solve for a profit maximizing water main quality index that captures the effect of revenue which allows us to observe the impact of the principle of full cost recovery. The difference in the results from Part I and Part II reveal the significance of the objective function of the water utilities and the difference between rural utilities and urban utilities.
The existence of water loss has various repercussions: economic and financial impacts
2The efficiency calculator is a DSS (Decision Support System) which calculates the optimal level
of leakage (the point where the marginal cost of leakage reduction equals the marginal cost of water production).
along with health and hygiene. Economically speaking, volumes of water that are lost through poorly maintained mains are extractions of water resources that are directly wasted, thereby aggravating water scarcity. Although water is never physically lost, the resources put into the production of water lost in leaks are lost forever (such as chemicals for treatment and energy for pumping) (Martins et al., 2012). In financial terms, water loss is the amount of water that is not sold to the consumer, hence a loss of potential revenue. Moreover, “leaky pipes are known for increasing pumping energy [...] and can increase the risk of compromised water quality by allowing intrusion of polluted groundwater” (Colombo and Karney, 2002). The rise in the total cost due to increasing water input is the “marginal cost associated with drilling, consisting mostly of energy and treatment cost” (Garcia and Thomas, 2001). This wasted energy has further consequences on the environment via emissions of CO2 and other greenhouse gases released by energy production and consumption.
We do not consider a dynamic model with “capital accumulation” since in our model the length of water mains is fixed (the kilometers of mains already exist and are given) and does not grow over time. This already existing stock of water mains consists of old and young mains. The distinction between old and young is determined by the expected lifetime of the mains which is supported by a huge literature on underground water mains deterioration. The question we ask is: how much of the existing water main network should consist of young mains? Since our models are based on a static framework, we refrain from using terms that evoke a dynamic nature. Therefore, we refer to young mains as “good quality mains” and old mains as “bad quality mains”. Moreover we avoid the terms such as investments and replacement. When we talk about “cost of good quality mains”, it implies the cost of replacing mains.
In Part I of this chapter, we develop a cost minimization problem where we define a cost function that comprises the cost of water production (pumping and treatment costs), the cost of good quality water mains and the cost of bad quality mains. The decision to increase the proportion of good quality mains or water extraction not only
depends on their relative costs but on other parameters such as the demand. We calibrate the parameters of our model with French and American data in order to illustrate the theoretical results and observe the impact of the different parameters of the model. The results show that the quantity of good quality water mains depends highly on water production costs, the material of the mains and the demand for water. This part provides the threshold quality index that characterizes the technical aspects of the water mains network regardless the “profitability” of the utility. The solution we obtain is a theoretical guideline for the minimum threshold of water main network quality that should be achieved by a water utility.
In Part II of this chapter we develop a profit maximization model. The water utility, private or publicly operated, decides on the optimal water main quality which maximizes their profits. They are both faced with price caps; where private utilities have higher price caps than public water utilities. In both cases, the water network is owned by the state - a situation representative of the French case. We also show the effect of delegated services, where decisions on investments are taken by the local authority and not by the delegated firm. The quality index obtained in Part II allows comparison with the benchmark cost efficient quality index that is presented in Part I. Results show that cost recovery has a significant effect on the quality index under profit maximization. We can see that too much cost recovery may lead to excessive water main quality indices that are beyond the cost efficient water main quality indices. Moreover, we show that in certain cases, utilities cannot meet both objectives of full cost recovery and water loss reduction simultaneously. This is particularly the case with rural utilities that are characterized with small demand size relative to the size of their network, which has been highlighted in the paper by Mizutani and Urakami (2001).
In an interview with Christophe Audouin, a water professional in France who works for the water company Suez, he explained that in the case of France, where water infrastructure is entirely owned by the state, regardless the service provider, the driving force behind investment decisions is the objective defined by the local authority. If the
contract does not specify network renewal, outsourcing may appear to have a negative effect on network renewal. Although our theoretical model is not specifically constructed to reflect the impact of organizational choice, we are able to recreate a scenario that reflects the importance of objectives defined in contracts signed with outsourced firms. The issue of the governance of water service provision is dealt with in Chapter 3 in depth. Overall, our results show that along with the impact of operator type, the specific characteristics of the utility plays a major role in determining the optimal network quality. These characteristics include the total length of mains, total demand, price elasticity of demand, cost of water production, cost recovery and the difference between urbanity and rurality. In line with Saal et al. (2013), the specification of our objective functions exhibit characteristics of natural monopolies that are highly capital intensive; in the sense that economies of scale is present but diminishes as output becomes very large.
This chapter is divided into two parts. We first present the literature review in the next section then we present Part I and and Part II of our chapter.
1.2
Literature Review
There are many papers that deal with the issue of water main replacement in the world of hydraulic engineering (among them, Mailhot et al. (2003), Berardi et al. (2008), Shamir and Howard (1979) and Elnaboulsi and Alexandre (1998)); yet this issue seldom appears in the economic literature as the prime focus of a study. We can find many papers today that estimate water utility cost functions and determine the efficiency frontier for evaluating performance levels, most commonly via the method of Data
Envelopment Analysis (DEA), such as the paper by Garc´ıa-S´anchez (2006). Our aim is
quite different from this traditional method of performance evaluation or the so-called benchmarking technique.
Within the economic literature, we find only a few papers that deal with water loss from water mains. Moreover, very few are based on a theoretical approach. For
example, Pearson and Trow (2005) estimate “economic levels of leakage” (ELL). They conclude that if producing water is less costly than investing in leakage reduction, water utilities should extract additional water to compensate for the amount of water lost through leaks. The marginal cost of water is estimated by the difference in the cost of producing one more unit of water in terms of power (energy), chemicals (for treatment) and labor. Indeed, in practice for many utilities the cost of water extraction is low, which leads to pumping more water. The difference between our model and the ELL approach is the nature of the model. We develop a static firm cost minimization model subject to an output constraint, whereas the ELL model is a technical unconstrained cost minimization model, where short run costs are separated from long run costs. Moreover, the objective of our model is to obtain a “quality index” of the water main network and to provide a sensitivity analysis when parameter values change, whereas the goal of ELL is to estimate the optimal frequency of intervention (active leak detection) of the network. It is very useful for water utilities as a practical tool in planning the optimal interval for leakage detection activities. Lastly, the ELL model is based on substantial data from utilities and requires that utilities are already engaged in “active leakage control”, which is unlikely to be the case in most utilities outside the U.K. (Fanner et al., 2007). Our model requires very little data input but captures the overall impact of the leakage issue in a simple framework.
Another example is the theoretical paper applying contract theory to public water utility regulation by Garcia and Thomas (2003). They examine the impact of asym-metric information on the production decisions of regulated public water utilities. The asymmetry of information depicts the uncertainty of the delegated utility’s decision whether or not to exert effort in reducing water loss in favor of water network quality improvement. The solution of their model shows that due to asymmetric information between the local community and the water utility, information rents increase with reductions in water loss. Hence in the optimal contract, “the principal requires the operator not to reduce losses”. This result adds to the intuitive hypothesis of the
likeli-hood that water loss reduction may be suboptimal if the cost of reduction exceeds the benefit, where the costs include the cost of transaction in their case. Although we do not have parameters that reflect asymmetric information as do models based on contract theory; in Part II of this chapter, we do recreate a scenario with outsourced utilities that reveal the situation where water loss reduction could be lower (less than the cost efficient network quality) due to asymmetric information between the local authority and the outsourced firm. This is primarily due to the specification of the objectives in the contracts.
Moreover, a recent theoretical approach to the analysis of water infrastructure has been developed by Hansen (2009). He tested the effects of population, capital and policy on the decision to invest in water utility infrastructure. He sets up a dynamic optimiza-tion problem constrained by capital depreciaoptimiza-tion. The empirical evidence proved the theoretical model relevant; however, applying a production function with inputs of cap-ital, labor and infrastructure investment appears unsuitable to the characteristics of a water utility. In our model the production of output is simply defined as the sum of water demand and water loss.
Water loss often appears in empirical papers that assess the performance of the water utilities according to various factors such as ownership type and regional characteristics. For example the study by Chong et al. (2006), did not find evidence that the level of leakage, among the quality variables, has a significant effect on the “performance” variable estimated by prices. However, another study by Salvetti (2013) infers that “groups of water services complying with the French leakage regulation show a higher water price than the group of services failing to meet the regulation”. She reasons that utilities abiding by the regulation set by the authorities tend to charge higher prices to customers. This evidence strongly supports our hypothesis of the water utilities’ lack of concern about infrastructure quality because the burden is borne by the customers via higher prices. However, the price of water paid by customers may not be an overall indicator of how effectively the water utilities are managed since these water rates are
heavily regulated. Price is a problematic measure of the true cost to the servicing utility. The empirical findings of Gonz´alez-G´omez et al. (2012) explain the impact of key variables on the level of water loss in Andalusia, Spain. Their empirical evidence sug-gests that the financial burden of the water utility has a significant negative impact on water loss. This means that local governments that are under financial stress go further into debt in order to overcome leakage problems. This situation is supported by the positive relationship between private governance and water loss. Since the private entity is reluctant to act against leakage reduction, the local government takes on the burden. Moreover, densely populated regions positively impact water loss. The authors show that “water losses will be greater in those networks through which a greater volume of water is pumped”. In addition, the lower the extraction cost of water the higher the water loss, and the older the mains, the greater the water loss. The results we obtain in our model are consistent with their findings.
Garcia and Thomas (2001) compare the marginal cost of labor applied to the infras-tructure replacement (as most replacements are highly labor-intensive) and the marginal cost of pumping water (which consists mainly of energy costs) to decide whether or not to invest in leakage reduction. They conclude that a “joint production” of water loss and service output has a cost advantage since “short-run” marginal cost of main re-placement is greater than the “short-run” marginal cost of pumping water to satisfy customer demand; thus reasoning by the concept of economies of scope. On the other hand, the results we obtain with our model show that depending on utility-specific characteristics, sometimes it is cost efficient to have the least leakage possible.
In line with the study by Garcia and Thomas (2001), Martins et al. (2012) estimate
an empirical cost function in a similar manner with two outputs; water loss (yl) and
service output (ys) to observe the effect of reducing water losses on the water utility
performance in terms of cost effectiveness. They compare the cost of producing water loss and the cost of producing serviced water. The conclusion is that “the marginal cost
reducing water loss; it would be cost effective for the utility to produce without water losses.
Zschille and Walter (2010) infer from their empirical work on assessing the cost efficiency of the German water utilities, that “water losses and elevation differences in a service area turn out to be significant cost driver”; however, “incentives to reduce costs and corresponding prices are still missing in Germany so that there is no need for water utilities to supply water in an efficient way.” Such a result evokes potential political implications on the regulation of water utilities.
As we can see, there have been several empirical studies applied to different countries that highlight the issue of water loss; however, a theoretical model illustrating the effect of water loss on the cost to the water utility is rarely found in the economic literature. However, very recently we have come across a working paper by Cavaliere et al. (2015) that models investments in water networks with water loss which we can draw some ref-erence to. They analyze the impact of different ownership and governance structures on the investments for leakage reduction. Depending on the different organizational struc-tures (privatization, partial privatization, municipalization), cost of funds, opportunity cost and efficiency of investment, there could be under or over investment of leakage reduction. The main contribution of their article is the effect of mixed organisational structures (partial privatization such as mixed ownership of the network) on the level of investment. They observe that this kind of structure could either result in over or under investment depending on the strategic decisions aimed at maximizing ownership shares. In other words, private shareholders take into account the risk of expropriation of the water network by the local authority before deciding the level of investment in leakage reduction. Moreover their calibration exercise shows that the efficiency of investment and the variable costs have a large impact on the final level of investment. Although we share several similarities in the functional form and variable definitions, we depart from the focus on cost of funds and focus instead on the utility-specific characteristics such as demand size, length of network and cost of water production that could influence the
resulting optimal network quality. In our model utilities implement the cost recovery principle to cover the costs of network renewal. Furthermore our model does not assume perfect inelastic demand. There is a vast literature that shows the existence of weak but elastic behavior of demand towards water prices in studies conducted by Espey et al. (1997); Arbu´es et al. (2003); Garcia and Thomas (2003); Olmstead et al. (2006); Yoo et al. (2014). Hence the effect of cost recovery can be observed in the behavior of demand. “Full cost pricing” or “full cost recovery” is important because it implies self financing of water utilities. As Egenhofer et al. (2012) explains, water management should be financially viable and sustainable through cost recovery since public budgets are highly under stress in many of the member states of the EU. In particular, if costs are not recovered; it limits the availability of funds for other activities such as main-taining the quality of water supply. However, they also mention the limitations of this mechanism. For instance in poorer areas, cost recovery implies higher prices, which may not be feasible for the population; moreover these areas may require substantial investment which cannot be fully self financed, which means that the EU should provide financing tools for these cases. Indeed, we show that depending on the characteristics of the utility, meeting certain network quality requirements is not possible given a price cap that limits price increases. These utilities tend to be small, rural ones. On the other hand, in very large utilities that serve large cities, despite large costs, due to the
large (output) demand size, cost per m3 of water consumed is much smaller than in
rural utilities. Moreover, since cost recovery has very little impact on the increase in
price per m3, where price caps are sufficiently high, cost recovery may even induce over
investment in network renewal (greater than the cost efficient quality index).
We now present the first part of this chapter which is characterized by the first theoretical model based on the cost minimization approach. This part is co-written with Emmaunelle Taugourdeau. Part I is divided into five sections. The first and second sections introduce the theoretical model and the function specifications. The third section presents the simulation and results and the fourth section concludes. The
A static cost minimization
approach
1.3
Theoretical Model
1.3.1
The water utility’s decision
We begin with a benchmark scenario where a water utility weighs the cost of water loss against the cost of good quality mains.
Consider a water utility that provides potable water to households through a water main network which is of fixed length M . The network is composed of good quality mains M and bad quality mains M with M = M + M . The cost supported by the utility is:
C(M , M , Win) = ⇢Win+ rM + mM (1.1)
where ⇢, r and m are fixed parameters that characterize the cost per unit of water
pro-duced (Win), the cost per unit of good quality mains (M ) and the cost per unit of bad
quality mains (M ). This cost, m, could reflect the cost of leakage detection activities and rehabilitation costs of obsolete mains. The network quality is characterized by the
ratio of good quality mains over the total network⇣M
M ⌘
. The greater the proportion of good quality mains, the higher the network quality. In other words, there is less water loss in the water mains. Since we are in a static framework we refrain from using the term “investment” or “replacement”. The cost defined in 1.1 is the total variable cost of the water utility. We present further details on the distinction between good and bad quality mains in the next section.
The delivery of potable water is a process in which the produced volume of water is transported (after treatment) through the water mains and arrives to the households in the form of tap water. Therefore, we define the total production of potable water as
the sum of water loss (Wl) and the volume consumed by households (q). The amount
of water loss#Wl$ writes:
Wl= ↵✓ M
M ◆
where ↵⇣MM⌘ is the fraction of water lost between the treatment plants and the
ser-vice connections3. It takes on values from 0 to 1 without ever reaching 1 in order
to maintain a positive quantity of water supplied to the consumers. As specified by Chakravorty et al. (1995) we can also interpret ↵(·) as the conveyance loss rate function
or as an iceberg cost function4. We consider that this rate of water loss depends
nega-tively on the network quality, ↵0(·) 0 and ↵00(·) ≥ 0. In other words, the better the
quality of the main network, the closer ↵ (·) is to zero; hence the smaller the water loss5.
The total amount of water delivered to the tap by the utility must meet the required
demand denoted as q#p#M$$ with q0(·) < 0 and q00(·) > 0 where p(M ) is the price of
water with p0(M ) > 0 and p00(M ) 6 0. Based on a large empirical literature, the demand
function depends on the price. There is a huge empirical literature that calculates the elasticity of demand justifying the impact of water price on demand. Even if the response is sometimes low for some countries (between -0.1 and -0.4), it is not negligible and has to be taken into account. In Espey et al. (1997), the price elasticity estimates range from -0.02 to -3.33. About 90% of the estimates are between 0 and -0.75 (see Yoo et al. (2014) for a more recent survey). Furthermore, we characterize the price of water as being a function of the good quality mains in order to take into account the fact that in network industries, the network quality drives prices. As stipulated by Lannier and Porcher (2014) and Porcher (2014), operators usually justify their higher prices by higher quality standards. Moreover, utilities are obliged by regional authorities to recover the cost of a good quality network in the price of water. Indeed, the European Directive 2000/60/EC stipulates that the prices users pay for water should cover the
3Water leaks between the service connection and the tap water is not the responsibility of the water
utility.
4The concept of the iceberg cost is usually used to characterize transport costs: ”Specifically, of each
unit of manufactures shipped from one region to the other, only a fraction τ < 1 arrives” Krugman
(1991). This concept is also perfectly relevant to characterize water loss that occurs between the production location and the taps.
5Similarly we could consider that the rate of water loss is increasing with the quantity of bad quality
mains. As the size of the network is fixed at M , reasoning with good or bad quality mains will lead to the same results.
costs invested in new infrastructure6. Therefore, our price function takes into account the fact that the water utility can reflect the rise in cost due to good quality mains in the price of water.
Since water production is exogenously determined by the constraint to satisfy demand and prices are regulated, utilities’ objectives focus mainly on cost efficiency (Feigenbaum and Teeples, 1983). Hence, in this part of the chapter we begin with a cost minimization approach which solves for the optimal quality of the mains based essentially on the arbitrage between the cost of water loss and the cost of good quality mains.
The program of cost minimization writes as follows:
min M C(M , M , Win) subject to: Win− Wl>q#p#M$$ (1.3) Wl= ↵✓ M M ◆ Win (1.4) M + M = M (1.5) Win> 0 (1.6) M , M , Wl>0 (1.7) 0 ↵✓ M M ◆ < 1 (1.8)
where equation (1.3) reflects the supply constraint, i.e. the water delivered to the tap ⇣
Win− Wl= Win⇣1 − ↵⇣M
M ⌘⌘⌘
must cover the demand q(p(M )). After substituting constraints (1.3) to (1.8) into Expression (1.1), we are able to rewrite the cost function as a function of the good quality mains:
C(M ) = ⇢q
#
M$
1 − ↵⇣MM⌘ + mM + (r − m)M
6Directive 2000/60/EC of the European Parliament and of the Council establishing a framework for
For simplicity we replace q#p#M$$ by q#M$ from here on with q0#M$ < 0 and
q00#M$> 0: the better the quality, the higher the price of water, hence, the lower the
demand7.
The first order condition is given by:
@C @M = ⇢ 0 B @ q0(M ) ⇣ 1 − ↵⇣MM⌘⌘ + q#M$↵0⇣MM⌘ ⇣ 1 − ↵⇣MM⌘⌘2 1 C A + (r − m) (1.9)
where the first two terms in brackets are negative and characterize the impact of the
good quality mains on the water production quantity, (Win). An increase of the network
quality reduces the demand through a rise in water price and reduces the water loss. Both effects tend to diminish the volume of produced water. When r tends to zero or ⇢ is very large, Expression (1.9) can be negative for any values of M 2 [0, M ]. This implies that when the cost of good quality mains is very low or when the cost of water production is very high, the optimal level of M is M . In other words, the entire main
network should consist of only good quality mains8. Conversely, when the cost of water
production is very low, Expression (1.9) may be positive for any M 2 [0, M ] implying that it is not optimal to have good quality mains. When an interior solution exists,
the optimal proportion of good quality mains is the solution to ∂M∂C = 0. The following
second order condition confirms that the optimal quantity of M indeed minimizes costs.
@2C @M2 = ⇢q00(M ) ⇣ 1 − ↵⇣M M ⌘⌘ + 2⇢q0(M )↵0⇣M M ⌘ ⇣ 1 − ↵⇣M M ⌘⌘2 + ⇢q↵00⇣M M ⌘ ✓ 1 − ↵⇣M M ⌘2◆ + 2⇢q#M$ ⇣↵0⇣M M ⌘⌘2 ⇣ 1 − ↵⇣M M ⌘⌘3 >0
The implicit form of the optimal solution is given as follows:
7q0(M ) = q0(p)p0(M ) > 0 and q00(M ) = q00(p)(p0(M ))2+ q0(M )p00(M ) > 0.