HAL Id: hal-03166791
https://hal.inrae.fr/hal-03166791
Submitted on 11 Mar 2021HAL is a multi-disciplinary open access
archive for the deposit and dissemination of sci-entific research documents, whether they are pub-lished or not. The documents may come from teaching and research institutions in France or abroad, or from public or private research centers.
L’archive ouverte pluridisciplinaire HAL, est destinée au dépôt et à la diffusion de documents scientifiques de niveau recherche, publiés ou non, émanant des établissements d’enseignement et de recherche français ou étrangers, des laboratoires publics ou privés.
Modelling recruitment in uneven-aged mountain forest
stands in France using the national forest inventory
Louis Cordonnier
To cite this version:
Louis Cordonnier. Modelling recruitment in uneven-aged mountain forest stands in France using the national forest inventory. Silviculture, forestry. 2020. �hal-03166791�
2019-2020
Master Agronomie, Environnement,
Territoires, Paysage, Forêt (AETPF)
Major
Forests and their Environment
Modelling recruitment in uneven-aged mountain forest stands
in France using the national forest inventory
Louis CORDONNIER
Master thesis, defended at Nancy on September 2020
Patrick VALLET, supervisor, INRAE
Yoan PAILLET, supervisor, INRAE
Josep M SERRA-DIAZ, academic referent, AgroParisTech
Summary
Tree recruitment is a part of the stand dynamics. Recruited trees represent an important part of the total stand growth and are particularly important in uneven-aged forests where the recruitment is continuous over time.
In this study, we developed stand-scale predictive models to analyse tree recruitment (the number of trees annually crossing the threshold of 23.5 cm in circumference, corresponding to 7.5cm in diameter) in uneven-aged forests. Our analyses were based on pure and mixed stands of Fagus sylvatica, Abies alba and Picea abies in five mountain regions of France: the Vosges, Jura, Alps, Massif Central and Pyrénées. We selected 559 plots out of ten annual census (between 2006 and 2016) of the French National Forest Inventory.
Tree recruitment count data are over dispersed and contain an excess of zero counts. We used negative binomial error distributions to predict tree recruitments and identify factors influencing recruitment.
The influence of structure, climatic data and soil characteristics was tested on recruitment. Structure and especially the mean diameter of the conspecific cohort were the most influential recruitment driver of European beech, Silver fir and Norway spruce. We obtained four predictive models, one for each target species and one for remaining species.
Internship context
The six-month internship took place within the National Research Institute for Agriculture, Food and Environment (INRAE) where I worked in the Mountain Ecosystems and Societies Laboratory (LESSEM) in Grenoble. The INRAE research centre of Grenoble has more than 30 years’ experience in studying major issues including: a sustainable agriculture, the sustainable land management of territories, water management and associated risks, droughts, floods, the study of complex ecosystems and of biodiversity and its relationship with human activity. The multi-disciplinary research conducted supports public policies and works in partnership with regional authorities and socio-economic entities.
My internship took part of a European research project called “Innovative forest management strategies for a resilient bioeconomy under climate change and disturbances (I-MAESTRO)”. It aims at “improving the scientific basis for developing management strategies that increase resilience for future natural disturbances and climate change, while maintaining a high level of wood production, carbon storage, and habitat quality for biodiversity”.
1
Table of content
Summary
Internship context
1) Introduction ... 2
2) Materials and methods ... 3
2.1) NFI sampling design ... 3
2.2) Data temporality and recruitment ... 3
2.3) Plot selection ... 5
2.4) Dendrometric factors ... 7
2.5) Site conditions ... 8
3) Modelling framework ... 8
3.1) Recruitment models ... 9
4) Results ... 9
4.1) Number of recruited trees in France ... 9
4.2) Selected factors ... 10
4.3) Influence of dendrometric factors ... 10
4.4) Influence of site conditions ... 11
5) Discussion ... 14
5.1) Particularity of forest dynamics surveys ... 14
5.2) Influence of dendrometric factors ... 15
5.3) Influence of site conditions ... 16
5.4) Model characteristics ... 17
6) Conclusion... 17
2
1) Introduction
Forest dynamics is a set of components including regeneration, recruitment, tree growth and tree mortality. These processes could lead to species replacement, changes in structure and composition and disentangling whether drivers influence regeneration or only recruitment is difficult. The recruitment follows the regeneration process and recruitment of individual tree species gives potentially much more indications about the future stands than the regeneration itself, which is more prone to change. Studying recruitment enables to understand the changes in structure and composition and the recruitment rate, this need to be know to maintain uneven-aged forest sustainability (Duc, 1991; Schütz, 2001; Schütz et al., 2006; Yoshida et al., 2006).
Trees are measured from a certain threshold. Recruitment definitions vary according to surveys, the measurement threshold is susceptible to differ. In our study, recruitment is defined as the number of trees crossing a circumperence at breast height threshold of 23.5 cm, corresponding to 7.5cm in diameterover a certain period of time. The growth of uneven-aged stands of measured trees is the sum of the growth of all trees which are recruited during a certain period plus the growth of existing trees minus tree mortality (or harvested trees). The production of recruitment in multi-layered forests contributes significantly to forest growth (Andreassen, 1994), and disregarding recruitment would give biased prediction of future forest growth and yield.
The competition for light between trees affects the regeneration and determine whether trees can reach the recruitment stage or not. This competition results in a change of the canopy structure and induce a change of levels of light and gap size, this reduces both diffuse and direct light intensities (Dusan et al., 2007). Species will react differently according to their capacity to use available light (Collet et al., 2001; Petritan et al., 2007; Stancioiu and O’Hara, 2006). Moreover, tree species shows a large gradient of shade tolerance, this change the capacity for a dominated tree to survive and grow at low light levels.
Tree size inequality affects directly tree growth and asymmetric competition (Bourdier et al., 2016). The change in structure within a stand could influence the abundance of tree recruitment. A very heterogeneous structure leads to a strong competitive hierarchy between dominant and dominated trees (Oliver and Larson, 1996), which could be benefic to recruitment because the competition between small trees is lower. And certainly, having a very dense stand with a very high basal area limit the number of recruits.
The species composition within a stand affects the amount of recruits and the recruitment species proportion. The presence of mature trees of a certain species determine the presence of seedling of the same species within a stand (Wright et al., 2005). Consequently, in mixed stands, the species proportion guide the species proportion of recruits.
Site conditions (climate, soil characteristics and herbivory) also impact tree dynamics and are important to model recruitment. Climate variables (temperature and precipitation) have an important influence on regeneration (Czajkowski et al., 2005) as well as on the growth of adult trees (Lebourgeois et al., 2005). Klopcic and Boncina (2012) also showed that mean annual precipitation had influence on beech, fir and spruce recruitment. Soil conditions such as pH, fertility, and moisture are susceptible to affect the recruitment (Bendzsak, 2004; Lexerød and
3 Eid, 2005). Large ungulates may reduce the survival rate and recruitment success of light-demanding species as well as silver fir (Klopcic et al., 2010).
In our study, we examined the recruitment of the three main species of french mountain regions in mixed and pure stands: European beech (Fagus sylvatica L.), Silver fir (Abies alba Mill.) and Norway spruce (Picea abies (L.) H. Karst). These three species are shade-tolerant but with different characteristics: European beech and Silver have a high competitiveness and Norway spruce grows better in open spaces. European beech is present on a wide range of elevation compared to Silver fir and Norway spruce which prefer colder climate. Silver fir is highly susceptible to large ungulate browsing. We aimed to identify the factors influencing the most the recruitment abundance among stand variables, site characteristics and climate variables. We tested several hypotheses: (1) recruitment in uneven-aged stands is driven by dendrometric variables and decrease with the basal area; (2) recruitment is also determined by site conditions (soil, climate and herbivory variables) and the number of recruited trees increase with precipitations.
2) Materials and methods
We used the French National Forest Inventory (NFI) database (IFN, 2016) to study the recruitment dynamics of uneven-aged stands for the mountain regions. We focused on European beech (Fagus sylvatica L.), silver fir (Abies alba Mill.) and Norway spruce (Picea abies (L.) which are the three main species of these regions. These three species represent 9%, 4% and 4% of the metropolitain French forest area respectively (Maaf-IGN, 2016). The dataset covered a large part of the metropolitain territory, which allows having climate and soil conditions over a large environmental gradient.
2.1) NFI sampling design
We used NFI datasets from 2006 to 2016. Every year, about 6000 to 7000 temporary plots are measured on a 1 km x 1 km grid allowing having a systematic and representative sampling of the French forest. Tree variables are collected in three concentric circles of 6m, 9m, and 15m in diameter, where, respectively, trees with circumferences at breast height ranging from 23.5 cm to 70.5 cm, from 70.5 cm to 117.5 cm, and up to 117.5 cm are measured. Several tree characteristics are noted: species, circumference, the last five years of radial increment taken from a core sample on each measured tree and the total height. The vertical structure of the stand and harvesting indices over the last 5 years are visual estimations in the field given for a circle of 25 m radius. Soil characteristics are described on each plot, and pH and carbon-to-nitrogen ratio are estimated using mean indicator values from bio-indication models (Gégout et al., 2005) according to the floristic composition of the plot. Truncated plots are removed if the perimeter of the plot crossed the forest limit. In order to calculate stand values per hectare, each tree data is weighted depending on the circumference class of the tree and when all trees are not measured because of too many trees.
4 NFI measurements was done at the end of the increment period because of retrospective nature of the data. All explanatory dendrometric variables were calculated according to initial stands values and without taking into account trees recruited during the increment period (Figure 1). This data manipulation allowed the use of initial values to predict the recruitment (response variable). That’s why we calculated initial data (presented below) before doing the plot selection.
2.2.1) Calculation of initial data
It is important to specify the constraints of this study linked to the nature of NFI data. First, we are studying recruitment as a response variable as a variation between two states of a forest at two different periods (year n and year n-5). In our case, the final state is the measurement at a given year, and the initial state is calculated from the final state and tree cores to compute values five years before. Secondly, one of the goal of this study is to develop a predictive model for recruitment, therefore we took as inputs only initial state variables to be able to forecast.
Thanks to the radial increment taken from cores samples and to bark ratio values, we calculated the initial circumference (Cinit130) of each tree corresponding to the circumference 5 years before the measurement in the field using equation 1.
Cinit130i =
Cfinal130,i× √1 − Bri− ir5,1
10 × 2π √1 − Bri
(1)
where Cinit130,i (cm) is the circumference of tree i five years before measurement, Cfinal130,i (cm) is the circumference of tree i at the date of the measurement, ir5,i (cm) is the radial increment under bark over 5 years of tree i (from the core) and Bri is the bark ratio of tree i. The bark ratio is the percentage of mean surface bark at 1.30m for five size categories of diameters. Bark measurements data come from the EMERGE project working on development of models for a robust and generic estimation of wood energy (Bouvet and Deleuze, 2013).
2.2.2) Recruitment
Tree recruitment is defined in this study as a process by which saplings or young trees overgrow a threshold value of 23.5cm in circumference. This value is the minimum size of dendrometric measurement in the NFI data between 2006 and 2016 corresponding to the diameter class 10 in classical forestry (from 7.5 to 12.5cm). We calculated it for each NFI plot as the number of trees crossing the measurement threshold of 23.5 cm in circumference per plot of 113.0973m² (corresponding to the small circle of 6m in radius where trees smaller than 70.5 cm of circumference are measured, see Figure 1) during five years. We kept this unit (trees per 113.0973m-2.5yr-1) to have an integer as a response variable. This allows to use generalized models dealing only with count data using negative binomial or poisson error distributions. It corresponds to the number of trees were the initial circumference (Cinit130) is below 23.5cm and the final circumference (Cfinal130) is over 23.5cm. Plots used in this study are temporary therefore there were inventoried only once.
5 Figure 1: Schematic NFI plot showing the three concentric circles (6m, 9m and 15m) with trees. Small, medium and big trees are respectively measured on the 6m, 9 and 15m circles. Existing trees are not always measured and the threshold measurement depends on the concentric circles. Brown dots of the right part represent trees that are measured by NFI (Final values, year y). Brown dots on the left part are trees with values calculated (Initial values, year y-5). Brown circles represent trees present but not measured. Trees recruited during the increment period are removed (red cross) to have initial values without recruitment. One tree recruited on a 6m radius plot in five years represents 17.68 trees recruited per hectare per year.
2.3) Plot selection
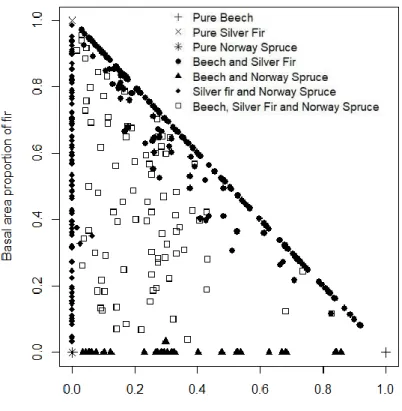
We selected plots according to several criteria. Our first selection criterion was the species composition, to focus on European beech, silver fir and Norway spruce stands. Stands can be monospecific, bispecific or trispecific. We selected plots according to the initial basal area without recruited trees (BAinit without recruit). If 100% of BAinit without recruit was one of the target species, stands were classified as monospecific. If the sum of BAinit without recruit of the target species represented at least 80% of the total BAinit without recruit and where the sum of BAinit without recruit of other species present was less than that of each species studied (Figure 2), stands are classified as bispecific or trispecific.
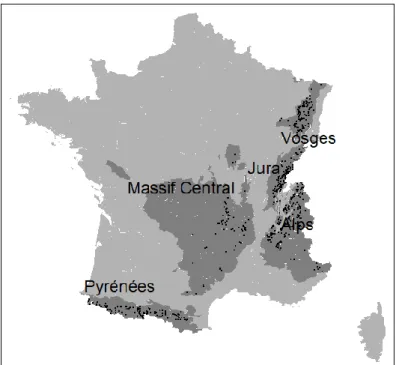
6 The second criterion was geographical location; we selected plots in the five mountain regions of France: the Vosges, Jura, Alps, Massif Central and Pyrénées mountains according to the GRECO (‘Large Ecological Regions’) variables as defined by the French NFI (Figure 3).
The third criterion was the previous silvicultural practices: plots were selected in forests with an irregular vertical structure. The fourth criterion was to keep only plots with no cutting evidence over the past 5 years to avoid changing density conditions to bias measured increments.
The fifth criterion was the removal of the truncated plots: plots were removed when the small concentric circle of 6m radius (corresponding to small trees measurements) was truncated, this scenario can happen when plots were located at the edge of the forest property.
Finally, this selection was subdivised on four sub datasets, for each species or group of species dataset, we only kept plots with at least one tree of the species. Same plots can be selected in several sub datasets. We obtained a full dataset made up of 559 stands with at least one of the three tree species chosen and four subsets for each species or group of species: 334 stands with European beech, 419 stands with silver fir, 254 stands with Norway spruce and 121 stands with at least one other species (Table 1). All selected stands are located at relatively high elevations (mean elevation > 1000m), with high precipitation (mean annual precipitations > 1400mm).
7 Figure 3: Location of the NFI plots in the “Large Ecological Regions” corresponding to the five french mountain massifs. Black dots corresponds to the selected NFI plots
Table 1: Summary of datasets with means and quantiles (2.5% and 97.5% in parenthesis) of dendrometrical and climatic variables (the recruitment was previously calculated in trees
113.0973m-2 5y1 but easier to compare in trees ha-1 y1)
2.4) Dendrometric factors
We used NFI data to calculate stand features: mean quadratic diameter (Dg in cm), stand relative density index (RDI), basal area of trees larger than 20, 25, 30, 35, 40, 45, 50cm in diameter, respectively BA20, BA25, BA30, BA35, BA40, BA45, BA50, Gini index based of individual basal area (Gini) and the proportion of the target species (ratioBA of the species). All dendrometric variables are calculated with circumference values at the beginning of the increment period (Cinit130) using Eq. 1 and without taking into account trees which are recruited during the increment period.
8 RDI is the relative density index based on a self-thinning rule (Reineke, 1933). The stand RDI is the ratio between the number of trees in the stand and the maximum number of trees limited by the self-thinning rule. Coefficients for the maximum capacity is calculated for each species in the NFI dataset in Toïgo et al (2018), the stand RDI of mixed stands is the sum of partial RDI of all species in the stand.
The Gini index measures the level of inequality in the distribution of tree basal areas in a stand (Cordonnier et al., 2012). The Gini coefficient varies from 0 for a homogeneous forest stand (each tree having the same basal area) and close to 1 for a heterogeneous forest stand. According to Duduman (2011), stands with a Gini index less than 0.35 are typically regular and stands with a Gini index greater than 0.5 are typically irregular. It has been described as an indicator that performs better than other forest structure indices at gauging the heterogeneity of tree sizes (Lexerød and Eid, 2005; Valbuena et al., 2012).
2.5) Site conditions
Soil measures are carried out at the center of the plot (bedrock type, humus form, texture, depth, percentage of stone content and rocky outcrops). Topographics measurements (highest slope, plot exposition and topographic position) were also taken. The soil water holding capacity (SWHC in mm) is calculated from soil properties (Piedallu et al., 2018). Soil chemical indices (soil moisture, soil acidity (pH), organic-carbon-to-total-nitrogen ratio (C/N) and base saturation (S/T) of the first soil layer) are estimated from floristic survey and bio-indicator models (Ellenberg, 1992; Gégout et al., 2005).
Others variables were extracted from geographic information system layers. Climatic data came from the Aurelhy model of the French Meteorological Service (Bénichou and Le Breton, 1987), monthly mean, minimum and maximum for temperature (°C) and precipitation (mm) were calculated with 1981 to 2010 climate values. The monthly potential evapotranspiration (mm) were calculated from these climatic variables (Piedallu and Gégout, 2007; Piedallu et al., 2013, 2018). These averaged climate data are merged to every NFI plots to take into account the effect of spatial variation of mean climate on recruitment models. On the contrary, the temporality variation of climate is not taken into account.
The French Biodiversity Office (OFB) has registered ungulate pressure statistics called “hunting statistics”. An ungulate pressure index is determined from the yearly kill census of Sus scrofa, Capreolus capreolus and Cervus elaphus registered at the administrative “depertment” scale. This index is computed as the mean body mass of the species to the power 0.75 (Clarke et al., 2010; White, 2005). As recruitment can be browsed few years before reaching the recruitment threshold when the size of the tree was lower, and because the exact year of browsing is not known, we averaged this index to have a moving average of ten years.
3) Modelling framework
We focused our approach on one response variable: the recruitment (Nrecrut5 in trees per 6m radius disc per 5 years) modelled with a specific statistic framework.
9
3.1) Recruitment models
The response variable are count data which are positive integers and over-dispersed. A generalized model with negative binomial error distribution (Hardin and Hilbe, 2007) allowed to model such data. We identified in this modelling framework the influence of dendrometric parameters, soil characteristics and climate variables on abundance of recruitment under European beech, silver fir and Norway spruce stands.
The recruitment is modelled as a generalized linear function of factors that impact the recruitment with this equation:
Nrecrut5= exp (a0+ ∑ (am× Xm)) + n
m=1
ε (2)
where Nrecrut5 is the recruitment of trees during 5 years in a disc of 6m radius, Xm is a vector of all selected factors (different for each species, Table 2), a0 and am are the estimated parameters and ε represents the residual errors. The Exponential form (exp) corresponds to the reciprocal of the link function, neperian logarithm (ln), used in this model.
The relationship between mean and variance is defined as:
V = µ (1 + µ
𝜑) = µ + µ²
𝜑
where V is the variance, µ is the mean and φ is the dispersion parameter.
The free-software R version 3.6.2 (R Development Core Team, 2019) was used to perform statistical analyses. The negative binomial model was implemented with the R package ‘glmmTMB’, and the obtained model was manually selected with a forward stepwise modelling procedure. We started with a null model and every explanatory variables were included one by one with a linear or a quadratic form. We kept variables that improved the Akaike Information Criterion (Akaike, 1974) of at least two points. Selected variables are transformed again one by one to test their logarithm and exponential form. The model with the lower AIC was selected.
4) Results
4.1) Number of recruited trees in France
The following description is calculated using the full dataset. On average 21.80 recruited trees ha-1 y-1 were found in the selected forest stands. Recruitment was present on 49 percent of the plots whereas recruitment of European beech, Silver fir and Norway spruce was present on 13, 22 and 15 percent of all plots, respectively. Variability in recruitment per species was high; the coefficients of variation ranged from 3.25, 2.75 and 3.05 for European beech, Silver fir and Norway spruce respectively. Silver fir recruited most successfully (8.29 trees ha-1 y-1), followed by Norway spruce and European beech (respectively 5.85 trees ha-1 y-1 and 3.35 trees ha-1 y-1)(Figure 4).
10 Figure 4: The average annual recruitment of tree species (mean value and standard error of
mean), the recruitment was previously calculated in trees 113.0973m-2 5y-1 but easier to
compare in trees ha-1 y-1
.
4.2) Selected factors
Dendrometric and site conditions factors were selected in all models (Table 2). We observed that the mean diameter of the conspecific cohort (Dg of the species) were selected in the four models. The stand capital (G30, G20 and RDI) and the proportion of the target species (ratioBA of the species) were selected in the three models of the three selected species. The heterogeneity indices (Gini) were selected in beech and spruce models. Site conditions variables were specific to each species or group of species. Factors linked with the herbivory pressure were not selected.
4.3) Influence of dendrometric factors
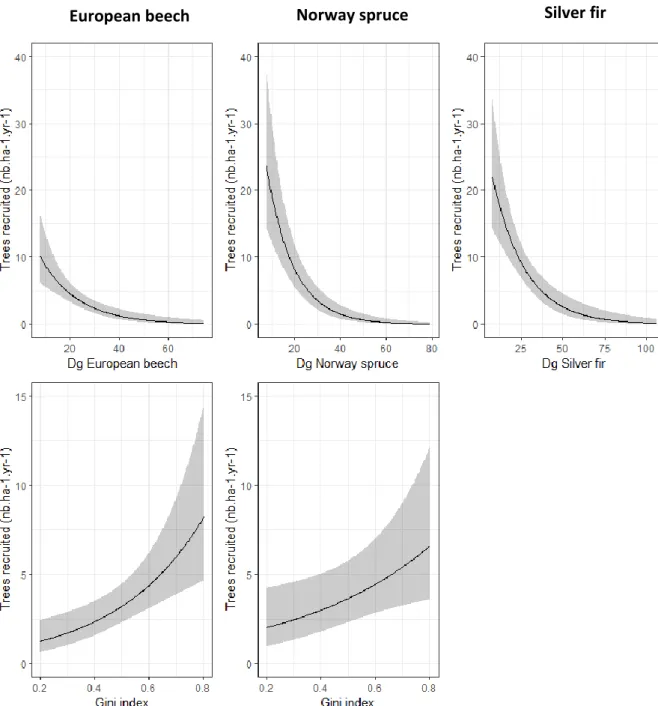
The variable selection of our models showed that the most important factors that influence the recruitment were dendrometric factors. The recruitment of European beech, Silver fir, Norway spruce and other species decreased with the mean diameter of the conspecific cohort (Dg of the species, Figure 5) and with the stand capital (G30, G20 and RDI for European beech, Silver fir and Norway spruce respectively). But the recruitment increased with the level of inequality of tree basal areas (Gini, Figure 5) in beech and spruce stands and with the proportion of the target species (ratioBA of the species) for our three target species. We compared results between models with the estimates multiplied by the difference between the 97.5 and 2.5 percent quantile of the explanatory variable (Table 2). The mean diameter (Dg) of the species is the most influential factor for all recruitment models and particularly for the spruce where the magnitude between the 2.5 and 97.5 percent quantile is -4.65 recruited trees compared to -3.13, -2.84 and -3.14 for beech, fir and other species stands respectively.
European beech
Silver fir Norway
spruce Other species Re cr u itm en t (t ree s. h a -1.y -1)
11 The proportion of the target species (RatioBA) influenced more beech stands than fir and spruce stands with respectively estimates magnitudes of 1.61, 1.06 and 0.95. The stand heterogeneity (Gini) explain more recruitment magnitude on beech stands (estimate magnitude of 1.96) than on spruce stands (estimate magnitude of 1.41).
Figure 5: The predicted annual recruitment of European beech, Silver fir and Norway spruce (mean value and 95% confidence intervals) according to the quadratic diameter and the Gini
index. The recruitment was previously calculated in trees 113.0973m-2 5y-1 but easier to
compare in trees ha-1 y-1. All predictors are locked at their mean values for predictions (except
the quadratic diameter in the three upper graphs and the Gini index in two lower graphs). X axes range are limited to the data range. The Gini variable was not selected in the silver fir model.
4.4) Influence of site conditions
12 Datasets covered large gradients of abiotic conditions (Table 1) and site characteristics had significant effects on tree recruitment in all four models. Beech recruitment was more likely to occur when the organic-carbon-to-total-nitrogen ratio (C/N) is high and where the soil is shallow (Soilyoung). In the NFI classification, a young soil is relatively thin and the first layer is dark because of the organic matter content. The abundance of trees recruited was greater on steeper slopes (Slope) for the spruce and lower on soil with rocky outcrops (Rock) for the fir. The western exposition (ExpoEW) increased the number of other species recruitment. July and September water storage (Water storage07 and Water storage09) have a positive impact on spruce and beech recruitment respectively. Fir recruitment is more sensitive to the minimum temperature of June with an optimum at 9°C.
13 Table 2: Estimates, p-values and standards errors of the four recruitment models according to dendrometric and abiotic factors. Dg is the quadratic
mean diameter, ratioBA is the proportion of basal area of the target species, G20-G30 are the basal area of trees larger than 20 and 30cm in diameter,
RDI is the relative density index, ExpoEW is the east to west exposition and C/N is the organic-carbon-to-total-nitrogen ratio. The Nrecrut5 variation in the
14
5) Discussion
5.1) Particularity of forest dynamics surveys
We observed relatively high recruitment rates in this study (21.80 recruited trees ha-1 y-1, all species combined) compared to literature references. Despite the difference of recruitment definition of studies, it gives an order of magnitude of recruitment. Klopcic and Boncina (2012) showed an average of 26.1 trees ha−1 year−1 on irregular shelterwood stands. Schütz (1975), recommend to have between three and seven recruited trees ha−1 year−1 at a measurement threshold of 15 cm in dbh to maintain sustainable stands. Whereas Duc (1991) determined interval of five to nine recruited trees ha−1 year−1 to maintain selection structure in montane mixed stands. Based on our results, the average recruitment rate appears to be sufficient to maintain uneven-aged stand structure.
The high recruitment rate could be explained by the strict selection made in our study. Diaci (2006) explains that the number of saplings of all tree species are generally much higher in uneven-aged stands than in more regular stands (except at young stages) where the mortality of seedling is higher because of the poor light conditions (Petritan et al., 2007). A second aspect is the species selection. Our three target species are shade-tolerant species and are known to have a better recruitment rate than light-demanding species (Klopčič et al., 2015). The light availability in uneven-aged stands maintain the continuous presence of regeneration with a high survival rate of shade-tolerant tree species (Dusan et al., 2007; Stancioiu and O’Hara, 2006).
There is 49% of plots with at least one recruit. The size of gap where seedling can grow in uneven-aged stand is usually small and the size of the plot (circle of 6m radius) could affect the probability of recruitment occurence. We note recruitment were registered on 47% of plots on a similar survey (Klopčič et al., 2015), and could be also due to the size of the sample plots. The probability of occurrence of recruited trees on a plot is highly dependant of the plot size and the number of years of the measurement period and will change according to the survey protocol because recruits are quite rare. However the abundance should not change with the plot size.
Recruitment is measured on 6m radius plot and dendrometric characteristics are measured on 15m radius plot consequently variables are calculated on relatively small area. Consequently the number of replicates is particularly important to keep a statistical power. Contrary to dendrometric variables, soils analysis might be more robust because the soil is rather homogeneous at 15m radius scale.
Recruitment surveys are usully done with two consecutive measurements in the same plot at two different times. The interval between two measurements has to be long enough to allow saplings to reach the measurement threshold. In this survey, recruitment is calculated from dendrometric measurements and tree cores from the French NFI data, which means that only one measurement was performed on the selected plots we used. Usually, such data can be collected only in long-term surveys or provided by consecutive national forest inventories. Spanish and Swiss national forest inventories have permanent plots that are revisited. Spanish permanent plots are revisited approximately every ten years to study forest dynamics (Alberdi
15 et al., 2017). The calculation using tree cores to infer the number of recruited trees allowed us to work with the French NFI plots. Studying recruitment is costly, whether with cores or with permanent plots, especially due to, the stochastic characteristic of the recruitment that requires having a sufficient numbers of plots.
The number of surveys about recruitment is quite low in Europe (Klopčič et al., 2015). Recruitment is less studied than growth and regeneration. Recruitment concept is closely linked to uneven-aged forest where the number of recruited trees is a very important criterion for the sustainability, contrary to even-aged forest where recruitment is considered only once in the life of the stand. Nevertheless, there are only few silvicultural works for the tree renewal in uneven-aged stand compared to even-aged stands where the regeneration acquisition is a major concern. Recruitment might be considered as a more attractive topic because the sustainability of uneven-aged stands becomes a strong issue in a context of climate change.
5.2) Influence of dendrometric factors
Dendrometric characteristics are the main drivers influencing recruitment. The quadratic mean diameter of a species (Dg of the species) is negatively correlated with the recruitment in our three species models (European beech, Silver fir, Norway spruce models, Figure 5). This means that tree recruitment was more abundant in forests with many small trees compared to forests with larger trees. Same observations were made in Klopcic and Boncina (2012); Lexerød and Eid (2005) and Zhang et al., (2012). This phenomenon could be explained by a cohort effect: saplings grow within a group of saplings in gaps and grow at the same period.
Stand basal area (G20, G30) and Relative Density Index (RDI) are closely related to the light availability and the growing space of trees. The competition is increasing with the stand density among all trees, and reduce the number of recruited trees because the competition become even higher in the understory (Monserud and Sterba, 1999). The light availability is a strong driver of the survival and growth of regeneration and is dependent of dendrometric characteristics (Barna, 2008; Madsen, 1994; Wagner et al., 2009). The species composition is also changing the survival growth. Shade tolerant species are more efficient to grow under diffused light because shade tolerance appears to maintain an efficient light harvesting at constant low irradiance (Henry and Aarssen, 1997).
The proportion of basal area of the target species (ratioBA) is directly linked with the presence of mature trees. Seeds are deposited around the parent tree and the number of seeds decreases with increasing distance from the maternal parent (Harms et al., 2000; Wright et al., 2005). Consequently the number of recruits of a certain species increased with the number of mature parents of this species.
The Gini index calculated on individual basal area quantifies tree size inequality, this index is directly related to size hierarchy. Asymmetric competition between trees is increasing with the Gini index (Bourdier et al., 2016; Cordonnier and Kunstler, 2015; Valbuena, 2015). The competition between small trees tends to be lower when the Gini index is high and could explain the positive relation with recruitment on Beech and Spruce stands. The opposite relationship is found by (Liang et al., 2007). We must remind that one criteria of stand selections is based on the stand type where only uneven-aged forests were selected. We can expect that the recruitment dynamic is very particular in irregular stands (Klopcic and Boncina,
16 2012). However, the stand type criteria of uneven-aged stand were only visually estimated and not selected on tree age or tree size distribution. Nevertheless the Gini index on uneven-aged stands remains relatively high and the range is wide with a mean of 0.46 and a standard deviation of 0.17. This large range is explained by two things: the stand type is visually estimated in the field and the Gini index is calculated on a relatively small plot of maximum 707m². Tree size diversity seems to increase the number of recruited trees of beech and spruce but the stand capital suggests having a more important control of recruitment.
Dendrometric variables are mostly determined by silvicultural treatments. Those treatments create numerous stand structures and thus different conditions for tree species regeneration and recruitment (Barna, 2008; Yoshida et al., 2006). Forest manager might control the recruitment composition and abundance according to silvicultural treatments even if other factors such as abiotic also influence the recruitment.
5.3) Influence of site conditions
Site conditions are also essential factors. The number of recruited trees tends to be larger on site with a high fertility (Vanclay, 1989). In our case the recruitment abundance of beech is positively influenced by the carbon-to-nitrogen ratio (C/N). It could be explained by the species preference to grow on soil with a relatively low nitrogen proportion. Beech leaves have a high litterfall C/N ratio compared to other broadleaved species (Trum et al., 2011). Therefore the C/N ratio of the soil is maintained relatively high under a beech stand. Norway spruce and Silver fir recruitment seem to be less dependant of the soil chemistry than beech. However, the proportion of rocky outcrops and slope influenced fir and spruce recruitment respectively. As a matter of fact, altitude, slope and rocky outcrops are strongly linked therefore those factors are hard to disentangle. Nevertheless, the optimum minimum temperature for Silver fir recruitment in June of 9°C and the ability of spruce recruitment to grow on a slope confirm that mountainous environment is favorable for spruce and fir recruitment.
Climate variables have been selected in beech, spruce and fir models. Our results showed that July and September water storage positively influenced the abundance of spruce and beech recruitment respectively. Young trees are more sensible to precipitation to grow because their roots are not deep in the soil. Moreover, the precipitation regime may also have a strong impact (Fang and Lechowicz, 2006), especially in the climate change context where the changes can be regionally specific, with a drier climate of the sub-Mediterranean area of beech distribution in future decades (Klopcic et al., 2012). The summer climate conditions is an important driver of the radial growth of beech (Lebourgeois et al., 2005) whereas none of summer climatic variables were selected for the beech recruitment model but seem determinant according to our model for spruce and fir recruitment.
In boreal zone and for coniferous forest, the recruitment is important despite the colder climate. (Lundqvist (2004) observ 10 trees ha−1 year−1 at a threshold of 8cm dbh and 13 trees ha−1 year−1 at a threshold of 9cm dbh respectively. This number is consistent but is much lower than the mean of recruited trees in our study in a temperate climate of 21.80 recruited trees ha-1 y-1 at a threshold of 7.5cm dbh.
17 The regeneration and indirectly the recruitment may be negatively influenced by large ungulates (Motta, 1996). We know that beech and spruce species are not very impacted by the herbivory but fir saplings are often damaged by browsing. However, the herbivory pressure variable has not been selected in any models. Two reasons could explain this result: the herbivory data resolution is pretty low given at the department scale thus it does not show local variabilities and small ungulate pressure. The browsing impact is mainly focused on regeneration, the influence on recruitment is visible only few years after the damage on regeneration and the ungulate impact is very limited on bigger trees.
5.4) Model characteristics
The Negative Binomial (NB) model is more flexible compared to Poisson model because the variance can be greater than mean and the observed heterogeneity is taken into account in the model (Yaacob et al., 2010). Consequently NB model provides flexible structures for describing recruitment which are empirical count data. Mixture models are also used to analyse recruitment data such as Zero-Inflated Negative Binomial (ZINB) model. It leaves more freedom for exploring when the probability of tree recruitment and the number of recruited trees are driven by different factors (Zhang et al., 2012). Mixture models are more complex, more parameters are selected and became harder to interpret. We decided to use a simple NB model, which gives an equivalent fit quality in a simpler form while taking into account the significant number of zero.
We observed high standard errors. This reduces model applications for large-scale predictions which are nevertheless unbiased. The poor performance show that there is noise in the dataset which is not controlled. The stochasticity nature of recruitment is also high because it is affected by the previous abundance of regeneration several years ago which has a very high variability. Thus recruitment is influenced by current dendrometric variables but also by dendrometric variables in the recent past.
6) Conclusion
The dynamics of uneven-aged forests include several processes (in particular regeneration, recruitment and growth) that are nested and need to be understood as a whole complex. Understanding the dynamics process of uneven-aged forest development helps in improving the silvicultural system for promoting the target tree species. Our study revealed that many factors (dendrometric, soil and climate characteristics) impact recruitment and need to be taken into account to predict the recruitment dynamics. We also show in our models that a heterogeneous structure is beneficial for the recruitment abundance of beech and spruce. This will probably not be necessarily the case for less shade-tolerant species which need bigger gaps to grow in uneven-aged stands.
Concerning data processing, models seems realistic because the overdispersed data (important number of zero) is taken into account. Important random error levels were probably caused by the lack of independent variables describing the stochastic process of recruitment rather than inappropriate model specification. The large number of plots given by the NFI data allows to perform analyses taking into account the stochasticity of recruitment.
19
Bibliography
Akaike, H. (1974). A new look at the statistical model identification. IEEE Trans. Automat. Contr. 19, 716–723.
Alberdi, I., Cañellas, I., and Vallejo Bombín, R. (2017). The Spanish National Forest Inventory: history, development, challenges and perspectives. Pesq. Flor. Bras. 37, 361.
Andreassen, K. (1994). Development and yield in selection forest. Skogforsk 1–37. Barna, M. (2008). The effects of cutting regimes on natural regeneration in submountain beech forests: species diversity and abundance. J. For. Sci. 54, 533–544.
Bendzsak, M. (2004). A survey of hardwood recruitment under red pine (Pinus resinosa Ait.) plantations at Joker’s Hill. Faculty of Forestry, University of Toronto, Ontario, Canada. Bénichou, P., and Le Breton, O. (1987). Prise en compte de la topographie pour la
cartographie de champs pluviométriques statistiques: la méthode Aurelhy. Colloques de l’INRA 51–69.
Bourdier, T., Cordonnier, T., Kunstler, G., Piedallu, C., Lagarrigues, G., and Courbaud, B. (2016). Tree Size Inequality Reduces Forest Productivity: An Analysis Combining Inventory Data for Ten European Species and a Light Competition Model. PLoS ONE 11, e0151852. Bouvet, A., and Deleuze, C. (2013). Taux d’écorce pour les principales essences forestières françaises. Rendez-Vous Techniques ONF. Rendez-Vous Techniques ONF 60–67.
Clarke, A., Rothery, P., and Isaac, N.J.B. (2010). Scaling of basal metabolic rate with body mass and temperature in mammals. Journal of Animal Ecology 79, 610–619.
Collet, C., Lanter, O., and Pardos, M. (2001). Effects of canopy opening on height and diameter growth in naturally regenerated beech seedlings. Ann. For. Sci. 58, 127–134. Cordonnier, T., and Kunstler, G. (2015). The Gini index brings asymmetric competition to light. Perspectives in Plant Ecology, Evolution and Systematics 17, 107–115.
Cordonnier, T., Dreyfus, P., and Trouvé, R. (2012). Quelles dimensions et quels indices
d’hétérogénéité privilégier pour l’expérimentation dans les peuplements forestiers mélangés ou irréguliers ? Revue Forestière Française 773–787.
Czajkowski, T., Kuhling, M., and Bolte, A. (2005). Impact of the 2003 summer drought on growth of beech sapling natural regeneration (Fagus sylvatica L.) in north-eastern Central Europe. Allg. Forst-u. Jagdzt 133–143.
Diaci, J. (2006). Gojenje gozdov: pragozdovi, sestoji, zvrsti, nacrtovanje, izbrana poglavja (in Slovene). Department for Forestry and Renewable Forest Resources, Ljubljana, Slovenia. Duc, P. (1991). Untersuchungen zur Dynamik des Nachwuchses im Plenterwald. 299–319. Duduman, G. (2011). A forest management planning tool to create highly diverse uneven-aged stands. Forestry: An International Journal of Forest Research 84, 301–314.
20 Dusan, R., Stjepan, M., Igor, A., and Jurij, D. (2007). Gap regeneration patterns in relationship to light heterogeneity in two old-growth beech fir forest reserves in South East Europe. Forestry 80, 431–443.
Ellenberg, H. (1992). Zeigerwerte der Gefäßpflanze (ohne Rubus). 9–166.
Fang, J., and Lechowicz, M.J. (2006). Climatic limits for the present distribution of beech (Fagus L.) species in the world. J Biogeography 33, 1804–1819.
Gégout, J., Coudun, C., Bailly, G., and Jabiol, B. (2005). EcoPlant: A forest site database linking floristic data with soil and climate variables. Journal of Vegetation Science 16, 257– 260.
Hardin, J.W., and Hilbe, J.M. (2007). Generalized Linear Models and Extensions. A Stata Press Publication. StatCorp LP.
Harms, K.E., Wright, S.J., Calderón, O., Hernández, A., and Herre, E.A. (2000). Pervasive density-dependent recruitment enhances seedling diversity in a tropical forest. Nature 404, 493–495.
Henry, H.A.L., and Aarssen, L.W. (1997). On the Relationship between Shade Tolerance and Shade Avoidance Strategies in Woodland Plants. Oikos 80, 575.
IFN (2016). Les résultats issus des campagnes d’inventaire de 2006 à 2016. Inventaire Forestier National.
Klopcic, M., and Boncina, A. (2012). Recruitment of tree species in mixed selection and irregular shelterwood forest stands. Annals of Forest Science 69, 915–925.
Klopcic, M., Jerina, K., and Boncina, A. (2010). Long-term changes of structure and tree species composition in Dinaric uneven-aged forests: are red deer an important factor? Eur J Forest Res 129, 277–288.
Klopcic, M., Poljanec, A., and Boncina, A. (2012). Modelling natural recruitment of European beech (Fagus sylvatica L.). Forest Ecology and Management 284, 142–151.
Klopčič, M., Simončič, T., and Bončina, A. (2015). Comparison of regeneration and recruitment of shade-tolerant and light-demanding tree species in mixed uneven-aged forests: experiences from the Dinaric region. Forestry 88, 552–563.
Lebourgeois, F., Bréda, N., Ulrich, E., and Granier, A. (2005). Climate-tree-growth
relationships of European beech (Fagus sylvatica L.) in the French Permanent Plot Network (RENECOFOR). Trees 19, 385–401.
Lexerød, N., and Eid, T. (2005). Recruitment models for Norway spruce, Scots pine, birch and other broadleaves in young growth forests in Norway. Silva Fenn. 39.
Liang, J., Buongiorno, J., Monserud, R.A., Kruger, E.L., and Zhou, M. (2007). Effects of diversity of tree species and size on forest basal area growth, recruitment, and mortality. Forest Ecology and Management 243, 116–127.
21 Lundqvist, L. (2004). Stand development in uneven-aged sub-alpine Picea abies stands after partial harvest estimated from repeated surveys. Forestry 77, 119–129.
Maaf-IGN (2016). Indicateurs de gestion durable des forêts françaises métropolitaines. Maaf-IGN 343.
Madsen, P. (1994). Growth and survival of Fagus sylvatica seedlings in relation to light intensity and soil water content. Scandinavian Journal of Forest Research 9, 316–322. Monserud, R.A., and Sterba, H. (1999). Modeling individual tree mortality for Austrian forest species. Forest Ecology and Management 113, 109–123.
Motta, R. (1996). Impact of wild ungulates on forest regeneration and tree composition of mountain forests in the Western Italian Alps. Forest Ecology and Management 88, 93–98. Oliver, C., and Larson, B. (1996). Forest Stand Dynamics.
Petritan, A.M., Von Lupke, B., and Petritan, I.C. (2007). Effects of shade on growth and mortality of maple (Acer pseudoplatanus), ash (Fraxinus excelsior) and beech (Fagus sylvatica) saplings. Forestry 80, 397–412.
Piedallu, C., and Gégout, J.-C. (2007). Multiscale computation of solar radiation for predictive vegetation modelling. Ann. For. Sci. 64, 899–909.
Piedallu, C., Gégout, J.-C., Perez, V., and Lebourgeois, F. (2013). Soil water balance performs better than climatic water variables in tree species distribution modelling: Soil water balance improves tree species distribution models. Global Ecology and Biogeography 22, 470–482. Piedallu, C., Pousse, N., Bruand, A., Dietz, L., and Fiquepron, J. (2018). Estimer le réservoir en eau des sols. Quelles fonctions de pédotransfert le forestier doit-il utiliser ? Forêt Entreprise 28–32.
R Development Core Team (2019). A Language and Environment for Statistical Computing. R Foundation for Statistical Computing.
Reineke, L. (1933). Perfecting a stand-density index for even-aged forests. Journal of Agricultural Research 46, 627–638.
Schütz, J.-P. (1975). Dynamique et conditions d’équilibre de peuplements jardinés sur les stations de la hêtraie à sapin. Schweiz Z Forstwes.
Schütz, J.-P. (2001). Der Plenterwald Und weitere Formen strukturierter Und gemischterWalder. Parey 207.
Schütz, J.-P., Götz, M., Schmid, W., and Mandallaz, D. (2006). Vulnerability of spruce (Picea abies) and beech (Fagus sylvatica) forest stands to storms and consequences for silviculture. Eur J Forest Res 125, 291–302.
Stancioiu, P.T., and O’Hara, K.L. (2006). Regeneration growth in different light environments of mixed species, multiaged, mountainous forests of Romania. Eur J Forest Res 125, 151– 162.
22 Toïgo, M., Perot, T., Courbaud, B., Castagneyrol, B., Gégout, J.-C., Longuetaud, F., Jactel, H., and Vallet, P. (2018). Difference in shade tolerance drives the mixture effect on oak
productivity. J Ecol 106, 1073–1082.
Trum, F., Titeux, H., Ranger, J., and Delvaux, B. (2011). Influence of tree species on carbon and nitrogen transformation patterns in forest floor profiles. Annals of Forest Science 68, 837–847.
Valbuena, R. (2015). Forest structure indicators based on tree size inequality and their relationships to airborne laser scanning. Diss. For. 2015.
Valbuena, R., Packalén, P., Martı´n-Fernández, S., and Maltamo, M. (2012). Diversity and equitability ordering profiles applied to study forest structure. Forest Ecology and
Management 276, 185–195.
Vanclay, J.K. (1989). A growth model for north Queensland rainforests. Forest Ecology and Management 27, 245–271.
Wagner, S., Madsen, P., and Ammer, C. (2009). Evaluation of different approaches for modelling individual tree seedling height growth. Trees 23, 701–715.
White, C.R. (2005). Allometric scaling of mammalian metabolism. Journal of Experimental Biology 208, 1611–1619.
Wright, S.J., Muller-Landau, H.C., Calderón, O., and Hernandéz, A. (2005). Annual and spatial variation in seedfall and seedling recruitment in a neotropical forest. Ecology 86, 848–860. Yaacob, W.F.W., Lazim, M.A., and Wah, Y.B. (2010). A Practical Approach in Modelling Count Data. Proceedings of the Regional Conference on Statistical Sciences.
Yoshida, T., Noguchi, M., Akibayashi, Y., Noda, M., Kadomatsu, M., and Sasa, K. (2006). Twenty years of community dynamics in a mixed conifer – broad-leaved forest under a selection system in northern Japan. NRC Canada 1363.
Zhang, X., Lei, Y., Cai, D., and Liu, F. (2012). Predicting tree recruitment with negative binomial mixture models. Forest Ecology and Management 270, 209–215.