HAL Id: tel-01673796
https://tel.archives-ouvertes.fr/tel-01673796v2
Submitted on 1 Jan 2018
HAL is a multi-disciplinary open access archive for the deposit and dissemination of sci-entific research documents, whether they are pub-lished or not. The documents may come from
L’archive ouverte pluridisciplinaire HAL, est destinée au dépôt et à la diffusion de documents scientifiques de niveau recherche, publiés ou non, émanant des établissements d’enseignement et de
Growth, effect and attractiveness of FDI : the role of
institutions
Inès Trojette
To cite this version:
Inès Trojette. Growth, effect and attractiveness of FDI : the role of institutions. Economics and Finance. Université de Toulon, 2016. English. �NNT : 2016TOUL2004�. �tel-01673796v2�
CROISSANCE, EFFET ET ATTRACTIVITÉ DES INVESTISSEMENTS DIRECTS
ÉTRANGERS : LE RÔLE DES INSTITUTIONS
Thèse en vue de l’obtention du grade de Docteur en Sciences Économiques présentée par
Inès TROJETTE
Directeur de thèse : Maurice CATIN Co-Directeur de thèse : Alexandra SCHAFFAR
Soutenue publiquement à l’Université de Toulon le 7 décembre 2016
Membres du Jury :
Maurice CATIN Directeur
Professeur à l’Université de Toulon, LEAD
Jean-Pierre CHAUFFOUR Suffragant
Économiste principal pour le Maroc, Banque Mondiale
Dalila NICET-CHENAF Rapporteur
Maître de conférences HDR à l’Université de Bordeaux, LAREFI
Nicolas PERIDY Suffragant
Professeur à l’Université de Toulon, LEAD
CROISSANCE, EFFET ET ATTRACTIVITÉ DES INVESTISSEMENTS DIRECTS
ÉTRANGERS : LE RÔLE DES INSTITUTIONS
Thèse en vue de l’obtention du grade de Docteur en Sciences Économiques présentée par
Inès TROJETTE
Directeur de thèse : Maurice CATIN Co-Directeur de thèse : Alexandra SCHAFFAR
Soutenue publiquement à l’Université de Toulon le 7 décembre 2016
Membres du Jury : Maurice CATIN
Directeur
Professeur à l’Université de Toulon, LEAD
Jean-Pierre CHAUFFOUR Suffragant
Économiste principal pour le Maroc, Banque Mondiale
Dalila NICET-CHENAF Rapporteur
Maître de conférences HDR à l’Université de Bordeaux, LAREFI
Nicolas PERIDY Suffragant
Professeur à l’Université de Toulon, LEAD
L’Université n’entend donner aucune approbation ou improbation aux opinions émises dans les thèses. Ces opinions doivent être considérées comme propres à leurs auteurs.
REMERCIEMENTS
Avant tout propos, je tiens à exprimer toute ma gratitude à tous ceux et à toutes celles qui, d’une manière ou d’une autre, ont permis l’aboutissement de cette thèse. Je pense en premier lieu au Professeur Maurice Catin et à Madame Alexandra Schaffar pour la confiance qu’ils m’ont accordée et leur suivi régulier durant ces trois années. Je remercie particulièrement le professeur Maurice Catin pour le temps qu’il m’a consacré et son soutien décisif durant les derniers mois de la thèse.
J'exprime mes sincères remerciements aux membres du jury : le Professeur Patrick Villieu, Madame Dalila Nicet-Chenaf, Monsieur Jean-Pierre Chauffour et le Professeur Nicolas Peridy d’avoir accepté d’examiner ma thèse malgré leur emploi du temps chargé.
Durant cette dernière année de thèse j’ai effectuée un séjour de recherche aux Nations Unies à la Commission Economique pour l’Afrique du Nord (UNECA) à Rabat (Maroc) et je tiens à remercier Mr Nassim Oulmane, Salem Sebbar et Isidore Kahoui de m’avoir accueillie. Je tiens également à adresser mes plus vifs remerciements au Professeur d’anglais Catherine Iquille à l’IUT de Brest, où je suis actuellement en poste d’ATER, pour sa disponibilité et sa gentillesse d’avoir relu avec attention ma thèse.
J’ai une pensé particulière pour mes parents pour tous les sacrifices qu’ils ont faits pour moi, mon frère et ma sœur. Merci d’avoir financé mes études et pour votre confiance. Je remercie ma tante Leila celle qui a toujours cru en moi et qui a été présente durant les moments difficiles, et le plus impatient de tous à me voir soutenir, mon grand père que j’admire tant pour ses capacités intellectuelles et pour ses encouragements.
CONTENTS
GENERAL INTRODUCTION
CHAPTER I : THE IMPACT OF INSTITUTIONS ON ECONOMIC GROWTH BY LEVEL OF DEVELOPMENT
CHAPTER II : THE EFFECT OF FOREIGN DIRECT INVESTMENT ON ECONOMIC GROWTH: THE INSTITUTIONAL THRESHOLD
CHAPTER III : THE IMPACT OF FINANCIAL OPENNESS AND FINANCIAL DEVELOPMENT ON FOREIGN DIRECT INVESTMENT: THE ROLE OF INSTITUTIONS
GENERAL CONCLUSION
REFERENCES
GENERAL INTRODUCTION
The most central question in the field of economic growth and development is: Why some countries grow faster than others? The neoclassical growth according to Solow (1956), Cass (1965) and Koopmans (1965), clarify the differences in income per capita in terms of factor accumulation. These differences in factor accumulation are explained by differences in saving rates (Solow, 1956), preferences (Cass, 1965; Koopmans, 1965) and factor productivity. Along this line Romer (1986) and Lucas (1988) endogenize steady-state growth and technology. In fact, in the model of Romer (1989) countries may grow faster than others because they allocate more resources to innovation. However, North & Thomas (1973) explain that innovation, capital accumulation and education are not causes of growth: they are growth. They point that the essential explanation of differences in growth is in institutions.
In this context, the role of institutions has received more attention in explaining the cross-country differences in terms of economic growth. Institutions are generally defined as the “constraints that human beings impose on themselves”. According to Smith (1755): “little else is requisite to carry a state to the highest degree of opulence from the lowest barbarism but peace, easy taxes, and a tolerable administration of justice: all the rest being brought about by the natural course of things”.
High level of institutional quality helps to maintain long run growth over a long period to the extent that institutions allow continuity of reforms beyond governments. The role of institutions as a determinant of growth, however, has remained overshadowed for long owing to focus on other determinants, such as physical and human capital and technological advancement. A limited literature has examined the impact of institutions on economic growth at different stages of development within regions. In fact, institutions perform differently in terms of enhancing economic growth. Furthermore, the effects of these institutions vary across regions and by level of income.
(UNCTAD, 2015). Developing economies thus extended their lead in global inflows. Among the top ten FDI recipients in the world, five are developing economies. Many developing countries have acknowledged the vital role of foreign direct investment (FDI) in long-run growth. A voluminous literature exists that explores the impacts of FDI on the host’s socio-economic well-being (Borensztein et al., 1998; Carkovic & Levine, 2002…). Yet, the findings are diverse, and sometimes far from conclusive (Meyer et al., 2004…). The ambiguous effect of FDI on growth raises an important question: are there any additional factors that determine the effect of FDI on growth? At this level few studies advance the hypothesis of the existence of an institutional threshold beyond which FDI impacts positively growth. Some empirical works have attempted to estimate the institutional threshold effect (Meyer & Sinani, 2009; Cantwell et al., 2010; Jude & Levieuge, 2013; Brahim & Rachdi, 2014). However there is a very limited research dealing with the threshold effect of institutions in explaining the positive effect of FDI on growth by region and by level of income (high and middle income).
Many countries try to implement policies such as capital account openness and financial development to attract FDI inflows. Dunning (1977, 2014) and Dunning & Lundan (2008) attributed a popular theoretical framework for FDI determinants known as the “eclectic paradigm”. It advances that firms invest in foreign markets to look for three types of advantages: Ownership (O), Location (L), and Internalization (I) advantages. Therefore it is called the OLI framework. The authors also identify four categories that motivate foreign investors to invest abroad: resource seeking1, market seeking2, efficiency seeking3, and strategic-asset seeking4 (Cleeve, 2008).
FDI requires larger upfront fixed costs because a new foreign affiliate must be established or acquired. Hence, on the source side, higher financial development can also be expected to foster FDI, with a disproportionate positive impact on FDI in financially vulnerable sectors. Indeed, a financial system is considered as developed when it is easy for individuals and firms that require external funds to have access at reasonably cheap cost (Guiso et al., 2004). A deep and well-functioning financial
1 Access raw materials, labor force, and physical infrastructure resources. 2
system is a key determinant of economic growth (Rajan & Zingales, 1998; Levine, 2005). Furthermore, financial development begets economic efficiency because of its ability to reduce transaction costs, contract enforcement and information flow (Levine, 1997; Hermes & Lensink, 2003; Bartels et al., 2009; Méon & Weill, 2010). Štreimikienė (2012) in the World Economic Forum defines financial development as: “The factors, policies, and institutions that lead to effective financial intermediation and markets, as well as deep and broad access to capital and financial services”
The importance of financial services for foreign firms is twofold. Like local firms, foreign firms can use financial services for overdraft facilities, loans, or payments to their suppliers of intermediate goods. Developed financial services also facilitate financial transactions between foreign firms and their customers and employees in the host country. Furthermore, financial development is an engine of economic growth providing better business opportunities for customers and firms. Since local investors have better information about the opportunities and the risks of the local market, the distance between foreign investors and local market generally worsens this informational asymmetry. Obtaining better information about the risks of the local market through financial intermediaries allows foreign investors to know and be confident about profit opportunities in the country, encouraging FDI.
Directly higher financial development improves access to external finance for those firms, which require outside capital to expand in foreign markets and produce there at their first-best levels. Indirectly, greater financial development also promotes local development. This raises the likelihood of more intense local competition.
Higher financial development tends to be associated with higher FDI inflows (Kaur et al., 2013; Otchere et al., 2015). Furthermore, local financial intermediaries may help foreign investors to overcome informational asymmetries by sharing local knowledge on risks and market opportunities (Kinda, 2010). However, by promoting local firm
the existence of an institutional threshold through which financial development impacts FDI positively. Few papers have investigated the role of the threshold of institutional quality in helping financial development to attract FDI inflows. In addition to financial development, capital account openness could be another type of policy to attract FDI inflows. These two policies may strengthen each other in a way that would lead to a better environment to attract FDI inflows.
Capital account liberalization has been one of the most important economic policies recommended for economic growth. The Managing Director of the IMF said in Hong Kong in September 1997, “Freedom has its risks! Let’s go then for an orderly liberalization of capital movements...the objective is to foster the smooth operation of international capital markets and encourage countries to remove controls in a way that supports the drive towards sustainable macroeconomic policies, strong monetary and financial sectors, and lasting liberalization.”
The neo-classical modeling suggests that capital account liberalization will increase FDI inflows. Nevertheless, this might not be the case if the neoclassical assumptions of perfect information and competitive markets are relaxed5. In this sense, Lucas (1990) observed that too little capital flows from rich to poor countries, relative to the prediction of the standard neoclassical model “Lucas' paradox”. Likewise, he showed that during the 1990s, net capital flows to poor countries remained relatively small, while gross capital flows, in general, were large, in particular among advanced economies 6(Obstfeld et al., 2005).
Investigations relating to capital account liberalization influences on FDI inflows demonstrate that the positive relationship is not systematic. It depends on the scale/magnitude of liberalization, the level of development or the quality of institutions (Edison et al., 2002; Noy & Vu, 2007; Reinhardt et al., 2013; Brafu-Insaidoo & Biekpe,
5 Differences in human capital (Lucas, 1990), in the risk of sovereign default (Reinhart & Rogoff, 2004),
in capacity to use technologies (Eichengreen & Leblang, 2003) , and in institutional quality (Alfaro et al., 2008; Papaioannou, 2009) seem to be relevant for the direction of cross-border capital flows. Furthermore, frictions in national borders may explain the failure of the neoclassical model in accounting for the direction of capital flows.
6
During the boom in international capital markets in the 1990s, capital even flooded countries that had major macroeconomic problems, such as Moldova. After the 1997 East Asian crisis, external financing even dropped in countries that seemed to have good ‘macroeconomic fundamentals’, such as Hong Kong
2014). Recently, some empirical studies have examined the role of institutional quality as a key factor in explaining the mixed results in the effect of capital account liberalization on FDI inflows and have reached more positive conclusions (Noy & Vu, 2007; Okada, 2013). Institutional reforms were often emphasized in order to improve economic performances of developing or emerging countries according to some of the most influential papers of the late 90’s (Easterly et al., 1997). Few studies have paid attention to the critical level of institutions that allows capital account openness to attract FDI inflows. In fact, the institutional development affects the relation between FDI and capital account openness, and a small number of papers discussed the issue using causal effect models.
Despite the importance of literature, the question of the effects of the institutional quality on economic growth remains asked. Similarly, studies on the impact of FDI on economic growth suggest ambiguous effects. Furthermore, capital account openness and financial development policies have mixed results on the attractiveness of FDI following the empirical studies that we can identify. In addition, few works considered a sample of countries following the institutional classification.
In this study we investigate at different levels the relations between economic growth, FDI and the quality of institutions through an empirical analysis using a large sample of developed and developing countries.
Along this line, our study extends previous findings highlighting that the level of development of institutional quality is important to understand the ambiguity of its effect on economic growth and FDI. With this in mind, several questions arise as follows:
- Does the impact of the components of institutions on economic growth depend on the development status of the country?
We contribute to these strands of literature by examining the role of institutions on economic growth. We highlight that institutions matter differently by region and by level of income. Given the importance of institutional quality on economic growth, we try to bring an answer to the ambiguity of the role of FDI on economic growth, by analyzing its role through institutions. The idea here is to estimate an institutional threshold above which FDI foster economic growth. Since FDI acts as an important means for growth, countries try to implement policies to attract FDI. Such policies can be capital account openness and the improvement in financial services. Finally, we investigate whether institutions play a major role on capital account openness and financial development to bring more FDI inflows in the country.
This thesis is organized around three chapters. Chapter I focuses on the impact of the quality of institutions on economic growth. In other words, we examine whether the impact of institutions is different depending on the level of development of the country. Then, Chapter II analyzes the importance of the quality of institutions for the impact of FDI on economic growth. Finally, Chapter III investigates the role of the quality of institutions on capital account openness and financial development to create favorable conditions to attract FDI.
Chapter I examines the effect of the quality of institutions on economic growth by level of development. We use a sample of five regions (MENA, Europe, America, Asia and SSA) over the period 1984-2013. We apply two panel methods: the fixed effects and the instrumental variable (IV) techniques. The IV method is used to check if the endogeneity of institutions changes the results. In the first part, we build a yearly institutional index composed of 12 variables of the ICRG7 database (corruption, democracy, bureaucracy…). Then we test the effect of this institutional index on economic growth by region. We also analyze this effect by level of income within the region. In the second step, we investigate the role of the each of the 12 components of the institutional index on GDP growth by region and by level of income. The analyses indicate that improving the quality of institutions fosters economic growth and this effect is higher in the middle income countries. Furthermore, the components of the
institutional index, such as government stability, is important for economic growth but its impact is different depending on the region and the level of income.
Recognizing the fundamental role of foreign direct investment (FDI) in fostering long run growth, Chapter II emphasizes the role of the institutional environment in determining the relation between FDI and economic growth. We consider the same sample as in Chapter I that is the MENA, Europe, America, Asia and SSA divided by level of income over the period 1984-2013. In order to tackle the problem of endogeneity of institutions, we use the GMM method and the technique of Lewbel (2012) to build the appropriate instruments. Therefore, in the first part we test the impact of FDI on economic growth. Given the ambiguity of the effect of FDI on economic growth, we introduce the institutional effect to see above which level the impact of FDI on economic growth becomes positive and significant. This leads us to the second part in which we introduce the institutional threshold level. We use the method of Caner & Hansen (2004) following the transformation by Kremer et al., (2013) to estimate the threshold. A threshold is estimated for the institutional index and for each of its 12 subcomponents. This critical level enables us firstly to detect the indirect effect of FDI on growth through institutions for countries that are below and above the threshold. Secondly, to compare in each region the impact of FDI on growth between high, middle and low income countries by the institutional threshold. We consider the twelve components of institutions to get the most important institutional variables that condition the positive effect of FDI on growth.
The findings that FDI inflows play a major role on GDP growth through institutions encourages countries to try and implement policies to attract more FDI into their economies. This is an issue that we address in Chapter III. More precisely, Chapter III focuses on the effect of capital account openness and financial development on FDI inflows. We examine how the quality of institutions intervenes on the impact of capital account openness and financial development to foster the attractiveness of FDI. We
development and another one for stock market development using the method of Demirgüç-Kunt & Levine (1996a). Therefore, we consider in the first part, the direct impact of capital account openness and the index of banking development on FDI inflows. Then we test each of its components that are bank assets, liquid liabilities and credit to the private sector on FDI inflows. We also analyze the second measure of financial development, which is stock market development index on FDI inflows. Afterwards, we investigate its components such as stock market value traded, turnover ratio and capitalization on FDI inflows.
In this analysis of the effect of financial development on the attractiveness of FDI we consider the whole sample then the resource and the non resource endowed countries. In the second part, we investigate the indirect effect of capital account openness and financial development on FDI inflows through the institutional quality. To this aim, we estimate an institutional threshold above which capital account openness and financial development impact FDI inflows positively. An institutional threshold is also estimated for each of the components of the banking and the stock market index (Solow, 1956) under which the effect of these financial development variables foster FDI inflows. In the third part, we apply a new methodology called the Propensity Score Matching (PSM) to check for the robustness of capital account openness on FDI for countries that are above and below the institutional threshold. Following this method, the first step attributes scores of probability of opening the capital account to each country. Taking into account these scores, the second step aims at applying the matching method. The purpose here is to compare the impact of capital account openness on FDI inflows for a country that has liberalized its capital account with a country that has not liberalized it. This analysis is at the core of our study because it allows us to demonstrate the substantial role played by institutional quality on financial development and financial openness to attract FDI.
The key results emerging from these three chapters enable to clarify the role of institutions on economic growth, especially through the effects and the attractiveness of FDI. These results show the existence of an institutional threshold for both the effect and the attractiveness of FDI by level of development of countries.
CHAPTER I : THE IMPACT OF INSTITUTIONS ON
ECONOMIC GROWTH BY LEVEL OF DEVELOPMENT
I.
Introduction
The aim of this chapter is to analyze the role of different measures of institutions on economic growth. This study relies on the idea that institutions perform differently in terms of enhancing economic growth. Furthermore, the effects of these institutions differ across regions and by level of income. Thus we take into consideration 5 subsamples of regions following the World Bank regional classification (MENA, Europe, America, Asia and SSA) and 3 income levels (high, middle and low).
The literature gives evidence that institutional quality plays an important role in determining growth performance. North (1981), Rodrik et al., (2004) and Acemoglu & Robinson (2010) find a positive effect of institutions on economic growth. Although, these findings exhibited significant effects of institutions, they greatly vary in terms of magnitude.
North & Thomas (1973), North (1981), Olson (1982) and Jones (2003) are the pioneers of investigations on the role of institutions in clarifying the differences in the economic development across countries. The quality of institutions is a key factor determining the process of growth by influencing the incentive structure for investment in human and physical capital, in technological and innovations. Using European mortality rates as an instrument for institutions, Acemoglu et al., (2001a) emphasize the positive effects of institutions on income per capita. Valeriani & Peluso (2011) and Law et al., (2013) also find that the WGI8 have positive effects on economic growth. Moreover, Knack & Keefer (1995) using ICRG 9 and BERI10 dataset, showed that the quality of institutions is central for growth and investment.
Focusing on the subcomponents of institutions, Rodrik et al., (2004) prove that property rights play a main role in determining the long-run economic growth. North (1990)
100 countries over the sample period 1960–1990. Furthermore, Rodrik et al., (2004) confirm the strong impact of law and order on income. Acemoglu & Johnson (2003) use constraint on executive as an instrument for private property institutions. They show that private property plays a major role on long-run growth, investment, and financial development.
Some studies introduce more criteria in the analysis by taking into account heterogeneity across the economies. This heterogeneity includes the level of GDP per capita, the level of income, and institutional quality. As an example, Latin American countries have tried to implement institutions like those of the United States but differences in term of economic growth persist (Lin & Nugent, 1995). Furthermore, developed countries like the United Kingdom, Taiwan and Hong Kong have recorded high growth despite differences in the institutional quality established in these countries (Valeriani & Peluso, 2011).
Iqbal & Daly (2014) demonstrated that fighting against corruption fosters economic growth in strongly democratic economies and fails to improve growth in democratically weak countries. Marakbi & Turcu (2016) point that in countries with high levels of institutional quality, corruption appears to “sand the wheels” of economic activity. However, in countries with low levels of institutional quality, corruption seems to “grease the wheels”. This means, in a context of high institutional quality, corruption will affect growth through investment, human capital, political stability, and other means. In contrast, in a context of low institutional quality, corruption allows to circumvent institutional failures. In these countries, and below a threshold, the sensitivity of growth to corruption is low. Liu & Zhou (2015) find that rule of law positively impacts economic growth in the developed countries, but not in the developing ones. Valeriani & Peluso (2011) study the effect of institutional quality on the economic growth considering different stages of development. They point that the effect of civil liberties, quality of government and number of veto players on economic growth is more effective in the developed than in the developing countries. Chauffour (2011) reveal that institutions, measured by economic freedom and civil and political liberties clarify why some countries reach better economic outcomes. His results show that economic freedom matter most for growth in developed economies. In addition, in
effect on growth.
The empirical literature discussed above highlights a positive relationship between institutions and economic growth. However, the conclusions of these studies vary considerably depending on the level of institutional quality, the development status and the region of countries in the samples. The results on institutions-growth nexus are also related to the ways of measuring the quality of institutions and the estimation methodology. However, few studies have taken into account the impact of institutions on growth by region and by level of income.
The present study tests the effects of a wide range of institutional variables on economic growth at a disaggregate income level. The empirical analysis suggests that measures of institutional quality matter differently, depending on the region and by level of income. Such an observation leads us to divide the developed and developing countries into 5 regions (MENA, Europe, America, Asia and SSA). Furthermore, within groups we consider the level of income to assess what types of institutions are the most relevant in each region.
The rest of the chapter is organized as follows. Section 2 present the empirical model, the methodology and the data used. Then section 3 provides regression estimates and discusses the results. Section 4 concludes the chapter.
II. Model and methodology
II.1. ModelTo test whether institutions play any role in mediating the impact of institutions on economic growth, we follow Mankiw et al., (1992) and Hall & Jones (1999). The study specifies the model as follows:
where i : is country index and t : is time index. 𝜇𝑖: is unobserved country-specific effect
term, and 𝜀𝑖t is a white noise error term.
Y is the log of GDP (constant 2005 US$), 𝑌𝑖𝑡−1 is the lag of the dependent variable log of GDP, G is government consumption, GFCF is gross fixed capital formation, INFL is the inflation rate consumer price, POP is the annual population growth rate, HK is Human Capital, TRADE is trade in goods and services, Y84 is the log of GDP of 1984
and INST is the variable institutions. This model predicts that institutions (INST) impacts economic growth positively. All the variables that we include in the model have often been used in the growth literature (Mankiw et al., 1992; Barro & Lee, 1996; Sala-i-Martin, 1997). The entire variables are in logarithm and inflation (INFL) is equal to ln (1+ inflation rate). The model’s variables are presented in section II.3 and their definitions are on Table I-1.
II.2. Econometric methodology
In order to test the effect of institutions on GDP growth we apply the Fixed Effects (FE) as well as Random Effects (RE). The test of Hausman is used to select the appropriate estimator. If the result of the Hausman test rejects the null hypothesis, this would indicate that the individual effects are significantly correlated with the some explanatory variables. Then the most suitable estimators would be those of the fixed-effect model.
While the FE and the RE methods take into consideration respectively fixed and random individual characteristics, these methods can present biased results because of the endogeneity of the variable institutions (INST). Therefore, to solve the problem of endogeneity and the measurement errors on the institutional quality, we apply the instrumental variable technique. According to the literature on the relation between institutions and economic development (Porta et al., 1996; Acemoglu et al., 2001a,b), we consider different measures of instruments. These instruments are presented in the next section II.3. Furthermore, the lag of GDP growth 𝑌𝑖𝑡−1is also considered as an endogenous variable and instrumented by its lagged value for one period 𝑌𝑖𝑡−2.
II.3. The explanatory variables
II.3.1. Institutional quality: measures and data
In order to measure the different aspects of institutions we use the International Country Risk Guide (ICRG) database. This database is compiled by the Political Risk Services (PRS) Group. It provides information on several risk indicators grouped into three categories: political, economic and financial risks. For the purpose of our study we use the economy index risk. In every case the lower the value, the higher the risk, and the higher the value the lower the risk.
The variable institutions (INST in the model) measures the political risk of countries. It comprises 12 components. It is about government stability, socioeconomic conditions, investment profile, internal conflict, external conflict, corruption, military in politics, religious tensions, law and order, ethnic tensions, democratic accountability and bureaucracy quality. These variables stem from ICRG database (See APPENDIX I-1, Table A I-1 for their descriptions).
The ICRG database has several advantages over other measures of institutional quality. First, it provides an assessment of institutional quality for 142 countries over the period 1984-2013. This enlarges the sample and allows us to perform panel estimations. Moreover, the ICRG provides information on 12 dimensions of institutional quality, which can be used to construct a collective indicator that captures the quality of the overall institutional environment. This flexibility enables us to study the general effect of institutions on GDP growth and to compare it with the effects of other policy-related determinants of GDP growth. This database covers a long period of study beginning from 1984 as opposite to the Kaufmann database which begins from 1996. Although, the ICRG database includes a large number of variables (12), however Kaufmann database provides only 6 variables.
composite index (INST) using the 12 variables of the International Country Risk Guide's (ICRG). The measure of INST is an average of its 12 components. In order to compare between the subcomponents of institutions, we standardize all sub-indicators to range between 0 and 1. Higher values indicate higher quality of institutions.
In the literature institutions has been identified as an endogenous variable. We analyze in the next paragraph the different instruments of the variable institutions.
II.3.2. Instruments of institutions
Aghion et al., (2004) support the idea that institutions are chosen by individuals and they progress in response to changing of the political and economic conditions. Furthermore, Acemoglu et al., (2005) state about the endogeneity of institutions: "they are at least in part, determined by society, or a segment of it". Therefore, institutions must be instrumented by variables, which are exogenous, highly correlated with institutions and not directly caused by economic growth.
II.3.2.1. Legal Origin
The first contribution on the effect of legal origin on institutions goes to the contributions of Porta et al., (1996) and La Porta et al., (1997). They analyze the law governing investor protection, the enforcement of the law, and the extent of concentration of firm ownership across countries. Their results point that laws are largely influenced whether by colonialism, conquest, or outright imitation. La Porta et al., (1997) indicate that commercial laws are from Common law and Civil law traditions. In fact they point that English law is common law, prepared by judges and therefore integrated into legislature. In contrast civil law tradition is French, German, and Scandinavian laws. They are made by scholars and legislator and are from the Roman law. La Porta et al., (1997) results show that countries managed by Common law tend to protect investors more than those governed by French civil law. The level of protection of German civil law and Scandinavian civil law countries is in the middle. These legal origin variables have been widely used as exogenous variable of institutional quality in the economic growth literature.
Berkowitz et al., (2003a,b) argue that legal origin is not the only determinant of institutions. Along this line, they have advanced that countries, which have made their formal legal order have an advantage in developing their legal institutions in comparison with countries on which a foreign formally legal order was imposed externally. Berkowitz et al., (2003a,b) point that the manner how law was firstly transplanted is a more important determinant of legal institutions than the supply of a particular legal family. Furthermore, the legal transplantation process has a great (indirect) effect on economic development via its impact on legal institutions. Berkowitz & Clay (2004) find that the economy which had been developed by civil law and adopted common law after the American revolution had significantly lower median household income as well as higher share of population living under the poverty in 2001.
II.3.2.3. Initial Endowments
Acemoglu et al., (2001b) claim that the legal origin is poor instruments of institutional quality. In fact, they argue that "it is not the identity of the colonizer or legal origin that matters, but whether European colonialists could safety settle in a particular location: where they could not settle, they created worse institutions"
The theory of Acemoglu et al., (2001b) is based on three ideas:
- First, they observe that Europeans adopted different sorts of colonization strategies, which resulted on different set of institutions in the colonies. Indeed, the main goal of colonization strategy was to extract as much of the resources from the colony to the colonizer. Furthermore, the Europeans settled and established institutions to be protected against expropriation.
- Second, Acemoglu et al., (2001b) state that the colonization strategy was impacted by the feasibility of settlements. In areas where endowments favored settlement, Europeans
after independence.
Acemoglu et al., (2001b) consider that the mortality rates expected by the first settlers in the colonies as an instrument for institutions. They summarize their theory as follow:
Settler mortality SettlementsEarly institutionsCurrent institutionsCurrent performance
This indicate that settler mortality rate is determinant of settlements, then settlements is a major element of early institutions and there is a strong correlation between early institutions and institutions today (Acemoglu et al., 2001b). Moreover, the rate of settler mortality is considered as a measure of initial endowments Beck et al., (2008).
The empirical results of Acemoglu et al., (2001b) confirm their theory. They find that mortality rates faced by settlers more than 100 years ago explain over 25 percent of the variation in current institutions. Therefore, settler mortality during the period of colonization can be a valid instrument of institutions. Other authors like Alfaro et al., (2008) and Papaioannou, (2009) have used the European settler mortality rates (Acemoglu et al., 2001a,b) as an instrument of institutions.
II.3.2.4. Ethnic heterogeneity
The literature has identified the importance of ethnic heterogeneity in explaining growth, investment, or civil wars. In fact, La Porta et al., (1999) find that ethnic diversity leads to corruption and low efficiency in governments that expropriate the ethnic losers. They show a positive correlation between ethnic diversity and poor economic performance. It is a consequence associated to conflict in a highly fractionalized society.
In this context, Aghion et al., (2004) point out a positive relation between racial fragmentation and institutions. This means that in more fragmented systems, political systems are chosen to insulate certain groups and prevent other to have a voice. Consequently, many papers have used the ethno-linguistic fractionalization11 index as
indicator of ethnic heterogeneity.
Nevertheless, Fearon (2003) advances that the index of ethnic fractionalization can not capture important differences in ethnic structures. Thus, Montalvo & Reynal-Querol (2005) support that the measure of ethnic heterogeneity appropriate to capture potential conflict is the polarization12 measure. Indeed, Horowitz (1985) and Montalvo & Reynal-Querol (2005) find that the most severe conflicts arise in societies where a large ethnic majority.
II.3.3. Other explanatory variables
G is government consumption as a proportion of GDP is expected to negatively influence GDP growth (Barro et al., 1991). In fact, higher level of government consumption leads to a lower level of steady state, therefore to a lower rate of growth (Andreano et al., 2013). It can be also explained by the fact that public consumption is financed by distortionary taxes, which reduce growth rate (Barro, 2004). The variable can be also seen as a proxy of political corruption and mis-managed administration, and may reflect the negative effects of non-productive expenditure and taxation. This is confirmed by the positive relationship between the growth rate and the indicators of governance (A higher quality of governance raises the value of competition and this determines an increase in the average rate of development).
GFCF is the gross fixed capital formation is expected to positively impacts growth. It has always been seen as a potential of enhancing growth. GFCF determines the capacity of an economy to produce, which in turn, impacts economic growth. The literature has proved that capital formation plays a crucial role in the models of economic growth (Ghura & Hadjimichael, 1996; Ghura, 1997; Bakare, 2011). Romer (1986) and Lucas (1988) using growth models argue that increased capital accumulation may result in a permanent increase in growth rates. According to Jhinghan (2003), the process of GFCF
requires three inter-related conditions. First, it is about the existence of real savings and rise in them. Second, it is the existence of credit and financial institutions to mobilize savings and to direct them to desired channels. Third, it is about using these savings for investment in capital goods. The rise in investment through non-financial assets has led to the increase in the GDP through further increase in employment (Adekunle & Aderemi, 2012). Some developing countries, suffer from the huge under-utilization and unemployment of educated labor, so that its social productivity can be minimal at the margin. GFCF can be classified into gross private domestic investment and gross public domestic investment (Bakare, 2011). In this case Beddies (1999) indicates that private capital formation has a greater, more promising effect on growth rather than government capital formation. They clarify that private capital formation is more efficient and less closely associated with corruption.
POP is the annual population growth rate. It is predicted to increase GDP growth. Coale & Hoover (2015) argue that in the high income countries, the problem is to assure a full use of the resources available to avoid unemployment both of the labor force and physical capital. Keynesian analysis point that under these circumstances an increase in the demand for capital goods will have a stimulating effect on the whole economy, and will lead to higher incomes. It can be argued that this stimulus to demand is due to a faster population growth rate. The other case is an economy that suffers from deficiency of a supply of capital. A higher schedule of saving rather than of consumption would help to generate higher incomes by making more rapid rate of investment. Similarly, a less need for investment to duplicate facilities would allow a greater increase in the amount of capital per worker, higher per capita income.
INFL is inflation measured by the consumer price index Inflation. The effect has been negative on growth, offsetting the Mundell–Tobin effect (Barro, 2004, 1998). The low level of institutions combined with political instability, facilitated the process of generating easy money (Acemoglu et al., 2008). This can be a policy used by governments that are losing control of their own finances to fund themselves (Fischer, 1993). The process of generating easy money leads to higher inflation rates, with all their consequences on macroeconomic uncertainty, economic activity, growth and welfare in general. Khan & Ssnhadji (2001) and Seleteng et al., (2013) argue that only
impact growth.
HK is human capital which is predicted to improve the GDP growth rate as explained in the work of Borensztein et al., (1998). The inclusion of human capital in a Barro regression overlooks the double role played by the latter. Human capital not only impacts growth as an additional factor of production, but together with the efficiency physical capital and labor. Mankiw et al., (1992), point that the share of physical and human capital with population growth explain about 80 percent of international variation in per capita income. Young (1994) clarify that the economic growth of the “Asian miracle,” is the outcome of a rapid factor accumulation.
TRADE measures trade in goods and services. Sustained growth requires active policies that promote economic diversification and foster structural change from low-productivity activities (traditional agriculture and informality) to mostly tradable higher-productivity activities. It requires pulling the economy’s resources into those sectors that are on the automatic escalator up (Rodrik, 2011). He explains that once an economy gets to produce electric generators, or motor vehicles, labor productivity in that industry is placed on an automatic upward trajectory. The trajectory is steeper the lower the starting point. The trick is to get a toehold in these automatic-growth industries and to expand domestic employment in them. This is a large part of the explanation of why Latin America and Africa have underperformed relative to Asia in recent decades (McMillan & Rodrik, 2011).
Y84 is initial GDP per capita (GDP per capita of 1984). According to the neoclassical
theory the sign of the coefficient associated to per-capita income should be negative. A negative coefficient of this variable indicates a convergence within the group.
We use five groups of countries: SSA, MENA, Europe, America and Asia. Each group is divided on high, middle and low income countries according to the World Bank
The matrix of correlation (APPENDIX I-1, Table A I-3) indicates the correlation between the explanatory variables. Most of the correlation’s coefficients are between 0.06 and 0.48. As the sign of the Pearson correlation coefficient is positive, we can conclude that there is a positive correlation between Government consumption, GFCF, HK, population growth, institutions with GDP growth. That is, growth increases with these variables. The variable INST is correlated with HK (0.48) and with POP (-0.44). For this reason, we run the Variance Inflation Factor to test the muticolinearity of this variable INST. Results point that the VIF of INST is 1.91 (APPENDIX I-1, Table A I-3). It is less than 10, we can conclude that there is no evidence of multicollinearity.
Table I-1: Description of the variables
LABEL DEFINITION SOURCE
Yit
Gross Domestic Product at market prices (constant
2005 US$). WDI, 2014
Government consumption
(G)
General government final consumption expenditure includes all government current expenditures for purchases of goods and services. It also includes most expenditure on national defense and security, but excludes government military expenditures.
WDI, 2014
GFCF
Gross Fixed Capital Formation (% of GDP). It includes land improvements (fences, ditches, drains, and so on); plant, machinery, equipment purchases; the construction of roads, railways, including schools, offices, hospitals, private residential dwellings, and commercial and industrial buildings. According to the 1993 SNA, net acquisitions of valuables are also considered capital formation.
WDI, 2014
INFLATION (INFL)
Inflation as measured by the consumer price index reflects the annual percentage change in the cost to the average consumer of acquiring a basket of goods and services that may be fixed or changed at specified intervals, such as yearly.
WDI, 2014
Population growth
(POP)
Annual population growth rate. Population is based on the de facto definition of population, which counts all residents regardless of legal status or citizenship-except for refugees not permanently settled in the country of asylum, who are generally considered part of the population of the country of origin.
World Bank (WDI), 2014
Human capital (HK)
-Literacy rate, adult total (% of people ages 15 and below)
-Enrolment in tertiary education per 100,000 inhabitants
-Mean years of schooling of adults
World Bank (WDI) UNESCO, UNDP, 2014 TRADE Trade is measured by trade in goods and services as a
Institutions (INST)
The resulting index ranges between zero and 1 and a larger value means lower political risk. It is computed through an average of twelve different indicators from the ICRG database.
International Country Risk Guide (ICRG),
2014
III. Results and discussions
III.1. The impact of institutions on growth by level of income
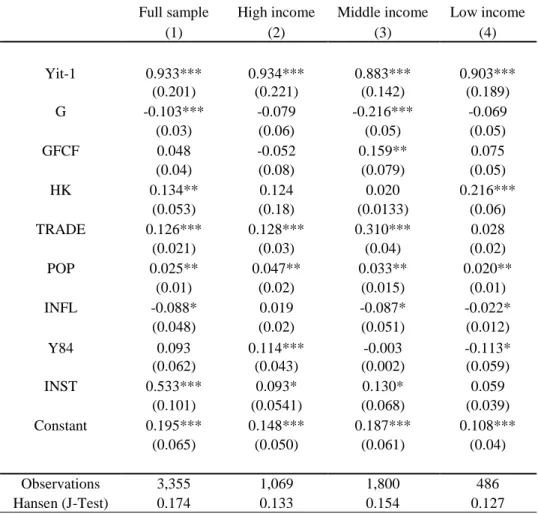
Table I-2 tabulates the estimation results of Equation I-1. In this regression we use the whole sample divided by level of income. First, we run estimations using the FE and RE. The results of the Hausman test in Table I-2 (columns (1) to (4)) valid the FE for all the sample, as well as for the three groups by level of income. Then, columns from (5) to (8) give the results using the instruments of institutions.
According to La Porta et al., (1997) and Acemoglu et al., (2001a,b), we consider two variables as instruments of institutions: legal origin and ethnic fractionalization. In fact, we consider a dummy variable legal origin as an instrument for the institutional index (INST). It is equal to 1 if a country has a common law and 0 if it has civil law tradition. For ethnic fractionalization, it is the probability that two randomly selected individuals from a given country will not belong to the same ethnic group. These two instruments valid the Hansen test (see APPENDIX I-2, Table B I-1). However, given that we use panel data, these instruments could not be appropriate because they don’t vary over time. For this reason, we run estimations using the lagged values of institutions by two periods as instrument (Table I-2).
Results clearly show that the coefficients obtained with the IV estimator are more significant and higher than the ones with the fixed effect estimator. We use Hansen's over identification test (J-test) to check the null hypothesis of the validity of instruments. Given the P-value of the Hansen test, our instruments (lagged values of institutions and Yit-1) are valid.
stability performs better in speeding up the economic growth. This finding is consistent with the existing literature that emphasizes the importance of good institutions for economic growth (Alguacil et al., 2011). Although, Aisen & Veiga (2013) argue that institutions14 are associated with higher growth rates of GDP. In high-income countries the estimated coefficient of institutions is positive and significant on GDP growth (column 6), this effect (0.104) is lower than in the middle income countries, the coefficient comes to 0.163 (column 7).
A positive and significant coefficient for lag GDP indicates that previous GDP exert persistent effect on growth. The initial level of GDP is positive in the high income countries and negative in the low income countries which indicates a convergence only in the latter group. Government expenditure as a proportion of GDP shows negative influence on GDP growth in the full sample as well as in the middle income countries, which is also consistent with findings in classic papers (Barro et al., 1991). One percent increase in the variable G, decrease GDP growth by 0.10 percent in the full sample and by 0.21 percent in the middle income countries (columns 5 and 7).
Gross fixed capital formation (GFCF) enters with the expected sign. It improves growth in the high and in the middle income countries (column 5 and 6). Considering the annual rate of growth of population, results show a positive effect in the three groups. Inflation measured by the consumer price index has a negative effect on growth in the middle as well in the low income group (columns 7 and 8).
Human capital has the expected sign15 (Borensztein et al., 1998). It has a positive impact on growth and the higher impact is in the low income countries (column 8). Trade increases growth and the higher impact is in the middle countries. An increase of 1 percent in the ratio of trade increases growth by 0.31 percent in the middle income countries and by 0.12 percent in the high income countries (columns 6 and 7 respectively).
14 The components of institutions are: political stability, economic freedom and ethnic heterogeneity. 15 Human capital was also tested using data from the World Bank like: net enrollment rate for primary
Table I-2: The effect of institutions on GDP growth by income VARIABLES Full sample High income Middle income Low income Full sample
High income Middle income
Low income
(1) (2) (3) (4) (5) (6) (7) (8)
Fixed Effects Instrumental Variable
Yit-1 0.898*** 0.826*** 0.883*** 0.903*** 0.931*** 0.933*** 0.882*** 0.907*** (0.107) (0.115) (0.111) (0.120) (0.162) (0.119) (0.112) (0.119) G -0.100*** 0.0231 -0.216*** -0.069 -0.120*** -0.0786 -0.179*** -0.034 (0.0347) (0.1822) (0.0484) (0.053) (0.0308) (0.060) (0.048) (0.050) GFCF 0.0458 -0.121 0.159*** 0.0748 0.039* 0.0532** 0.149** 0.055 (0.0401) (0.0974) (0.0581) (0.055) (0.0236) (0.026) (0.059) (0.047) HK 0.095* 0.089* 0.025 0.116*** 0.195*** 0.108** 0.121* 0.145*** (0.052) (0.051) (0.081) (0.041) (0.047) (0.051) (0.0789) (0.056) TRADE 0.093*** 0.128*** 0.110*** -0.028 0.138*** 0.159*** 0.184*** 0.049*** (0.035) (0.048) (0.043) (0.019) (0.048) (0.059) (0.044) (0.018) POP 0.069 0.057 0.0326 -0.020 0.0134* 0.0691** 0.077** 0.054*** (0.114) (0.118) (0.025) (0.048) (0.00813) (0.0256) (0.031) (0.015) INFL -0.078 0.039 -0.0737* -0.0219 -0.068* 0.0191 -0.096* -0.042* (0.132) (0.117) (0.043) (0.107) (0.041) (0.016) (0.0534) (0.025) Y84 0.122 0.117*** -0.255 -0.134** 0.139 0.137** -0.264 -0.164*** (0.151) (0.043) (0.184) (0.0532) (0.168) (0.057) (0.184) (0.054) INST 0.023** 0.065** 0.093** -0.008 0.041*** 0.104*** 0.163*** 0.150 (0.011) (0.032) (0.041) (0.255) (0.014) (0.037) (0.062) (0.369) Constant 0.836*** 0.300*** 0.887*** 0.408*** 0.752*** 0.347*** 0.885*** 0.289***
III.2. The impact of institutions on GDP growth by region
The full simple is now divided into five regions: MENA, SSA, America, Asia and Europe groups. See APPENDIX I-1, Table A I-2 for the list of countries
III.2.1. The impact of institutions on GDP growth
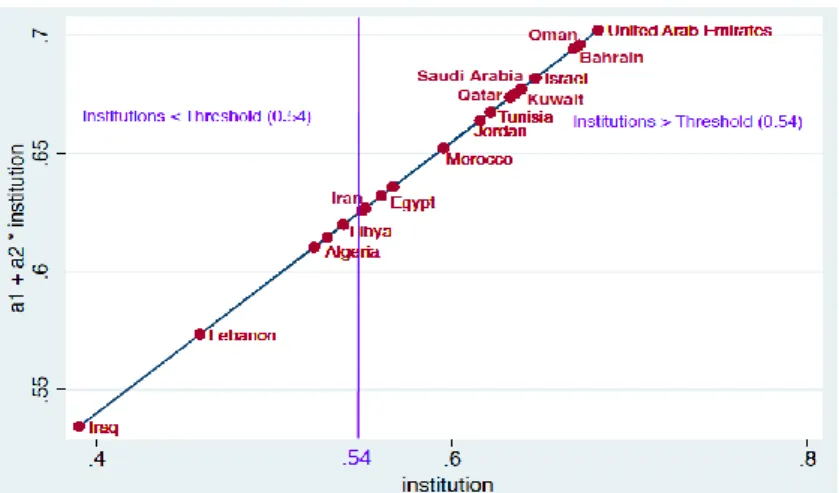
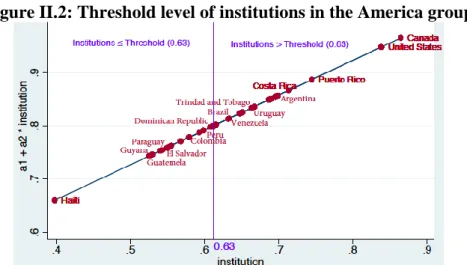
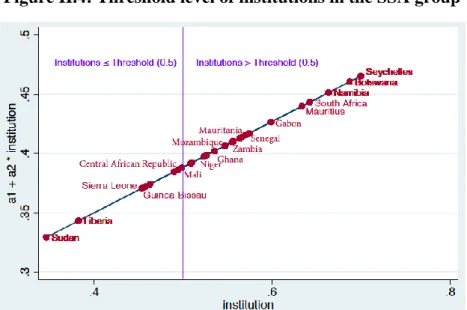
Table I-3 reports the effect of institutions on GDP growth by region. It points that institutions have a positive effect on growth in all the groups. For the five groups the results are similar but there are some differences with respect to the size of the estimated coefficients. We highlight that the coefficient is higher in SSA with 1.027 comparing to the MENA region with 0.712, America group with 0.715, Asia group with 0.686 and the Europe group with 0.591. An increase of 1 percent in the level of institutions increases GDP growth by 1.027 percent in SSA and 0.712 percent in the MENA region. For the MENA region, the America and the Europe group, the effect of institutions on GDP growth is higher in the middle income countries than in the high income countries. This effect is different in the SSA group in which the impact of institutions is higher in the low income countries than in the middle income ones. The opposite effect is found for the Asia group, the impact of institutions on GDP growth is higher in the middle income countries than in the low income countries. Tintin (2012) finds similar results for the least developed countries. His results show that institutions16 have bigger effect on GDP growth in the least developed than in the developing and developed countries.
Table I-3: The effect of institutions on GDP growth by region
VARIABLE MENA MENA SSA SSA AMERICA AMERICA ASIA ASIA EUROPE EUROPE
(1) (2) (3) (4) (5) (6) (7) (8) (9) (10) Yit-1 0.660*** 0.588*** 0.975*** 0.911*** 0.808*** 0.818*** 0.936*** 1.113*** 0.904*** 0.918*** (0.135) (0.198) (0.169) (0.215) (0.171) (0.183) (0.213) (0.265) (0.2186) (0.213) G 0.428*** 0.219 -0.0375** -0.050** -0.116 -0.148 -0.250*** -0.604*** 0.551* 0.057* (0.156) (0.193) (0.0153) (0.025) (0.074) (0.097) (0.077) (0.078) (0.321) (0.033) GFCF 0.085** 0.205 0.063 -0.028 0.125* 0.0284* 0.0509* 1.187*** 0.141 0.0276 (0.035) (0.181) (0.042) (0.030) (0.071) (0.015) (0.029) (0.435) (0.088) (0.111) HK 0.510*** 0.447** 0.00439 -0.125** 0.064 -0.0463 0.081 0.749*** 0.636** 0.502** (0.082) (0.202) (0.0271) (0.052) (0.042) (0.246) (0.053) (0.180) (0.318) (0.240) TRADE 0.374*** 0.388*** -0.0301 -0.095*** 0.554*** 0.583*** 0.093*** -0.0811 0.381*** 0.292*** (0.098) (0.122) (0.0222) (0.033) (0.066) (0.087) (0.0272) (0.0780) (0.088) (0.0579) POP 0.012* 0.140* 0.049*** 0.081*** 0.105** 0.078 -0.0185 0.496*** 0.029 -0.008 (0.0065) (0.076) (0.0181) (0.024) (0.0411) (0.066) (0.0363) (0.115) (0.032) (0.005) INFL -0.038 -0.0119 0.0155* 0.020* -0.0163 -0.019 0.0388 -0.0258 -0.0914** -0.033** (0.038) (0.052) (0.008) (0.011) (0.0184) (0.019) (0.0293) (0.0861) (0.0404) (0.0165) Y84 -0.051* -0.041* -0.0344*** -0.034*** 0.059 0.031 0.0231*** 0.0215 0.084 -0.084 (0.0301) (0.021) (0.012) (0.013) (0.039) (0.021) (0.00617) (0.0177) (0.056) (0.061) INST 0.712* 0.385* 1.027* 0.190*** 0.715*** 1.093 0. 686** 0.524*** 0.591*** 0.517** (0.391) (0.211) (0.604) (0.057) (0.143) (0.817) (0.312) (0.121) (0.162) (0.210) INST middle 0.224** -0.594*** 0.067* 0.389*** 0.0242* (0.112) (0.185) (0.039) (0.093) (0.014)
The effect of institutions on GDP growth seems to be higher in groups with low level of institutions. Lee & Kim (2009) find that if institutions are going to have any impact on growth, it is more likely to appear in the sample of lower-income countries17. They argument that these results don’t claim that institutions matter only for lower-income countries, they simply imply that basic political institutions, not others, are important at the early stages of development18.
Table I-4 shows the mean of institutions by region and by the level of income. The Europe group has the highest level of institutions among the groups and among the middle income countries.
The lowest level is found in the SSA group, which could explain the higher impact of institutions on growth. Nawaz (2015) explains that the lesser positive impact of institutions in the developed economies could be that these economies have already reaped the benefits of improvement in their institutions and, therefore, the room for further improvement in this respect is now limited, in a relative sense19.
Table I-4: Mean of institutions by region and income
ALL High Income Middle Income Low Income
MENA 0.58 0.65 0.54 SSA 0.53 0.57 0.50 AMERICA 0.62 0.73 0.60 ASIA 0.61 0.79 0.56 0.47 EUROPE 0.73 0.79 0.61 Full simple 0.62 0.76 0.57 0.49
* Values in bold indicate higher values of institutions.
The lag of GDP per capita is positive and significant in the five groups. Government consumption has a positive effect in the MENA region and in the Europe group. However, this variable has a negative effect on growth in the SSA and the Asia group. Furthermore, GFCF improves growth in the MENA, America, Asia and the Europe group. Human capital enhances growth in the MENA, Asia and the Europe group. Considering the ratio of trade on GDP growth, it contributes to growth in the MENA region, the America, the Asia and the Europe group. Regarding the population growth, it
has a positive effect on growth in the 5 regions. Inflation has is detrimental to growth in the Europe group the SSA group. The initial level of GDP indicates a convergence in the MENA region and the SSA group. This effect is positive in the Asia group which indicates an absence of convergence.
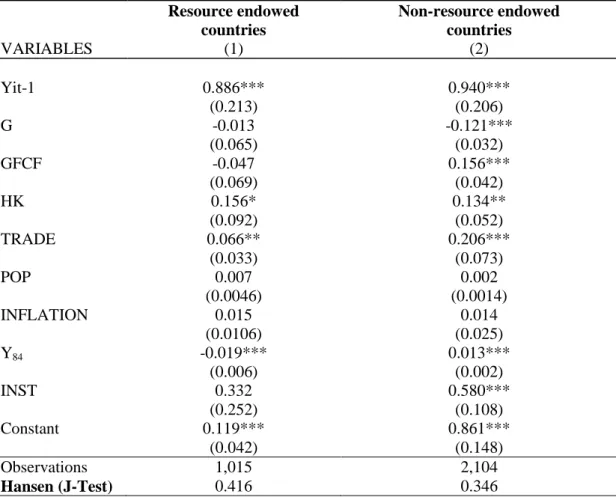
One particularity of the full sample is that it is mixed by resource endowed and non-resource endowed countries. Table I-5 reveals that the positive effect of institutions on GDP growth is higher in the non-resource endowed countries. Countries that are heavily dependent on natural resources have more difficulties than others to benefit from institutions. Resource-rich countries are coupled with wasteful consumption and public investment behaviour. It also affords incentives for rent seeking and other ineffective activities. Furthermore, it is generally perceived that natural resource prevent operative institutional reforms. In fact the role of total investment in improving growth is also weakened in oil-exporting countries.
Table I-5: The impact of institutions on GDP growth: the natural resource endowment Resource endowed countries Non-resource endowed countries VARIABLES (1) (2) Yit-1 0.886*** 0.940*** (0.213) (0.206) G -0.013 -0.121*** (0.065) (0.032) GFCF -0.047 0.156*** (0.069) (0.042) HK 0.156* 0.134** (0.092) (0.052) TRADE 0.066** 0.206*** (0.033) (0.073) POP 0.007 0.002 (0.0046) (0.0014) INFLATION 0.015 0.014 (0.0106) (0.025)
III.2.2 The effect of the subcomponent of institutions on growth
In a previous subsection, institutional quality (INST) is discussed as a composite index of political risk comprising 12 subcomponents; however, this index may be too aggregated to capture the appropriate effects of institutions on growth.
As an attempt to evaluate the individual effect of institutions on GDP growth and to avoid problems caused by multi-collinearity, we estimate Equation I-1 adding each institutional variable in succession. This approach was used in the literature by Walsh & Yu (2010).
Table I-6 summarizes the effect of FDI and the subcomponent of institutions for the five groups in order to compare the institutional variables the most determinant for growth in each group. In the literature, few studies consider the stages of development of countries to explain the effect of institutions on economic growth. In our case, we take into account the level of income for the five regions to estimate the influence of the twelve institutional variables of the ICRG database. Our purpose is to analyze in each group which institutional variable matter more on GDP growth and to investigate if the impact is greater in the high or in the middle income countries. See APPENDIX 2, Table B I-2 to Table B I-11 for the detailed results in each group.
Government stability (Table I-6, column 1) is a pre-condition to economic development as foreign investors make long-term plans when they trust in a country’s future. The effect of government stability is higher in the MENA region in comparison with the SSA group and the Europe group. Which means a one percent increase in government stability, increases growth by 0.11 percent in the MENA region, by 0.06 percent in the SSA group and by 0.03 in the Europe group. Aisen & Veiga (2013) and Gurgul & Lach (2013) point that political instability is associated with lower growth rates in the per capita GDP. However, these authors did not take into account the level of income. For our case, we find evidence that the effect of government stability on GDP growth may be different within the same group. In fact, this effect is higher in the middle income countries of the MENA region, SSA and the Europe group.
Socioeconomic conditions evaluate the social dissatisfaction which mean how government treats with unemployment, working conditions and poverty. These
the MENA region and in the SSA group in comparison with the other groups (Table I-6, column 2). We observe that the negative impact is higher in the middle income of the MENA region and in the low income of the SSA group. In these countries, the social dissatisfaction rate is high in comparison with other countries. Our results are the same as Brahim & Rachdi (2014). For the SSA group, the level of this variable has decreased over the period from 0.40 in 1984 to 0.37 in 2013 in the SSA group20. The decline in this value is a sign of higher social dissatisfaction. Though it is the opposite in the America, Asia and the Europe group. The decrease in social dissatisfaction in these countries has highly contributed to GDP growth in. The effect of socioeconomic condition on growth is higher in the middle income countries of the America and the Asia group. However this effect is higher in the high income countries of the Europe group. One percent increase in the level of socioeconomic conditions improves GDP growth by 0.044 percent. In the latter group, the rise in the level of socioeconomic conditions has contributed to enhance economic growth.
Investment profile expresses the contract viability (expropriation), profits repatriation or payment delays. The effect of investment profile on growth is higher in the Asia group (Table I-6, column 3). It is explained by the increase in the level of this variable by 0.07 over the period 1984-2013. It increases only by 0.02 in the MENA region and by 0.02 in the Europe group. We highlight here that the level of investment profile in 1984 was the lowest in the Asia group so they have more margin to improve their level. Investment profile has a greater effect in the high income countries of the MENA and Europe group. This effect is in contrary higher in the middle income countries of the Asia and SSA group.
In case of external conflict (Table I-6, column 4), decreasing the level of external conflict by one percent in the Asia and in the SSA group increase growth by 0.839% and by 0.01% respectively in the Asia and in the SSA group. In these groups, we found that external conflict has larger effect in the middle income countries. In fact, External