HAL Id: tel-01333558
https://tel.archives-ouvertes.fr/tel-01333558
Submitted on 17 Jun 2016
HAL is a multi-disciplinary open access
archive for the deposit and dissemination of sci-entific research documents, whether they are pub-lished or not. The documents may come from teaching and research institutions in France or abroad, or from public or private research centers.
L’archive ouverte pluridisciplinaire HAL, est destinée au dépôt et à la diffusion de documents scientifiques de niveau recherche, publiés ou non, émanant des établissements d’enseignement et de recherche français ou étrangers, des laboratoires publics ou privés.
Calorimeter for Gamma-Ray Astronomy
Aleksandar Gostojić
To cite this version:
Aleksandar Gostojić. Development of a Compton Telescope with 3D Imaging Calorimeter for Gamma-Ray Astronomy. Instrumentation and Methods for Astrophysic [astro-ph.IM]. Université Paris Saclay (COmUE), 2016. English. �NNT : 2016SACLS136�. �tel-01333558�
NNT : 2016SACLS136
T
HESE DE
D
OCTORAT
DE
L
’U
NIVERSITE
P
ARIS
-S
ACLAY
PREPAREE A
L
’U
NIVERSITE
P
ARIS
-S
UD
CENTRE DE SCIENCES NUCLÉAIRES
ET DE SCIENCES DE LA MATIÈRE
ÉCOLE DOCTORALE N°576
Particules, Hadrons, Énergie, Noyau,
Instrumentation, Imagerie, Cosmos et Simulation
Spécialité de doctorat : Astrophysique Nucléaire et Nucléosynthèse
Par
M. Aleksandar Gostojić
DÉVELOPPEMENT D’UN TÉLESCOPE COMPTON AVEC UN
CALORIMÈTRE IMAGEUR 3D POUR L’ASTRONOMIE GAMMA
Thèse présentée et soutenue à Orsay, le 21 Avril 2016 :
Composition du Jury :
M. KHAN, Elias Professeur – Université Paris-Sud Président Mme HANLON, Lorraine Professeur – UCD, Dublin Rapporteur M. LAURENT, Philippe Ingénieur chercheur – APC, IRFU/SAp, Paris Rapporteur M. JEAN, Pierre Professeur – IRAP, Toulouse Examinateur M. DE SEREVILLE, Nicolas Chercheur - IPNO, Orsay Examinateur M. TATISCHEFF, Vincent Directeur de Recherche – CSNSM, Orsay Directeur de thèse
T o my parents.
Acknowledgments
Before expressing any gratitude, I will allow myself a moment to share my reflections on the past several years I have been working on the manuscript you hold. These years, were, without a doubt, a time fulfilled with the most resonating experiences of my life, making me who I am today. A person much different then the one who stepped inside the building 104 to begin his Master 2 internship, more than 4 years ago. I have grown on a personal plan, I have grown on a professional plan maybe even more. I had the honor to work with some of the best scientists in the field today, to feel the frontiers of science, to present in front of great audiences in different countries, to publish my first paper... A start of a scientific career to wish for!
As such, it brings me great pleasure, being able to say thank you to all the people I came in contact with over this period, I will mention some of you by name, but in the same manner, a big greetings go to all of you!
Firstly, I wish to thank Mr. Jean Antoine Scarpaci, director of CSNSM, for supporting my thesis and our project from the very beginning, and Mr. Jean Duprat, assistant director of the CSNSM, for the equal support and following my progress over the years.
I am deeply grateful to the members of the jury of my PhD defense: Mr. Elias Khan, the president of the jury, for his constant support, Ms. Lorraine Hanlon and Mr. Philippe Laurent, the rapporteurs, for their patience while reading the first manuscript and valuable inputs which improved it. Further, to the two examinaters: Mr. Pierre Jean, for the interesting discussion and interest in our work and Mr. Nicolas de Séréville, our colleague on the project, for the great cooperation over the time.
Moreover, I owe a very important debt to the ladies from our lab for always having a smile, and making my non-scientific part of the day feel great. Firstly, to Ms. Réjane Bodson, to whom I have said thank you numerous times, but I repeat it gladly, thanks for guiding me through, what is without exaggeration, every single document in existence. Thank you Mes-dames Christelle Dodeman-Denys, Sonia Martineau, Patricia Duarte, Kim N’Guyen, Christine Zaoui, Emilie Bonnardel and Moufida Dziri-Marcé.
To the person, who without a doubt, deserves the biggest thanks and the biggest acknowl-edgement for this work, my thesis director Mr. Vincent Tatischeff, it was a pleasure and a privilege to work with you, and thank you for always being there for me, for all the patience and guidance and simply for being the best supervisor any student can wish for.
I would also like to offer my gratitude to the members of our nuclear astrophysics group: Jürgen Kiener, Clarisse Hamadache, Alain Coc and Anne Lefebvre-Schuhl; for clarifying vari-ous questions, providing invaluable assistance and most importantly nice workdays.
Special thanks to the electronics group of CSNSM for all the work and effort they placed into the project, and for patiently making the acquisition work every time when we needed it: Vincent Alaphilippe, Laurent Gibelin, Nabil Karkour, Xavier Lafay and Denis Linget. My deepest appreciation also goes to the IT developers Eric Legay, Nicolas Dosme and Xavier Grave. I am also grateful to Gregory Sedes, Isabelle Deloncle, Bruno Travers and Stéphane Cabaret for the work and assistance they provided during the initial phase of the project, and to Jean Peyré for sharing many consultations on all possible technical issues.
urgent emails she answered, Ms. Marine Valois from the University Library for being patient and helpful in polishing my final manuscript, and to all other personnel of the Université Paris-Sud who I came in contact with.
Cheers to all the stagiaires, students and postdocs I had the pleasure to meet, even if briefly: Rosa for my first coffee breaks, Vincent for being a friend in need, Nejc for sharing his apart-ment, and a big group shout-out to the guys from building 108.
My love goes firstly to my parents Leli i Mitru, hvala, no words can describe what you have done for me over the years, but likewise to my other someone, Nathalie, thanks bibs.
Finally, hey to my friends, wherever you are in the world, for all of the real and virtual support and moments: Bojana, Tanja, Irena, Budo, Dunja, Miso, Bojane, Sarah, Lorena, Jovane and all of you other wonderful people I have the pleasure to know.
Contents
1 Gamma-ray astronomy 7
1.1 Introduction . . . 7
1.2 Ground-based gamma-ray instruments . . . 8
1.3 Space borne gamma-ray instruments . . . 10
1.4 MeV astronomy . . . 14
1.4.1 MeV astronomy science . . . 15
1.4.2 Gamma-ray interaction with detector material . . . 16
1.4.3 Principle of a Compton telescope . . . 19
1.4.4 New concepts in MeV gamma-ray instruments . . . 22
2 A prototype of an advanced Compton telescope 27 2.1 Introduction . . . 27
2.2 The ACT prototype test bench . . . 27
2.2.1 Tracker . . . 28
2.2.2 Calorimeter . . . 30
2.3 Simulations of the ACT prototype . . . 30
2.3.1 MEGAlib . . . 30
2.3.2 Model of the prototype . . . 31
2.3.3 Simulated performance . . . 32
3 Development of the Calorimeter testbench 37 3.1 General view of the test-bench . . . 37
3.2 LaBr3:Ce detector module . . . 38
3.3 CeBr3detector module . . . 39
3.4 Electronics and data acquisition . . . 40
3.5 Calibration of the acquisition system . . . 42
3.6 Scanning measurements . . . 45
3.7 Energy measurements . . . 48
3.8 One photoelectron calibration . . . 48
4 Geant4 simulation of the Calorimeter modules 51 4.1 Introduction to Geant4 . . . 51
4.1.1 Simulating optical light propagation and tracking . . . 52
4.2 Simulating the LaBr3:Ce and CeBr3detector modules . . . 53
4.2.1 LaBr3:Ce simulation configuration . . . 54
4.2.2 Parametrization of the LaBr3:Ce simulation . . . 55
4.2.3 Simulation versus experiment for the LaBr3:Ce detector . . . 56
5.1 Introduction . . . 63
5.1.1 Artificial Neural Network . . . 63
5.1.2 JETNET 3.0 . . . 64
5.2 ANN configuration and training . . . 67
5.3 ANN performance using simulated data . . . 68
5.3.1 X–Y position reconstruction . . . 68
5.3.2 Depth of interaction reconstruction . . . 68
5.3.3 Module design optimization . . . 71
6 Experimental results 73 6.1 Position reconstruction . . . 73
6.1.1 Anger logic algorithm . . . 73
6.1.2 ANN performance with experimental data . . . 74
6.1.3 2D position resolution . . . 77
6.1.4 Depth-of-interaction reconstruction . . . 82
6.2 Energy characterization . . . 83
6.2.1 Energy dynamic range . . . 84
6.2.2 Energy resolution . . . 84
Conclusions and perspectives 89
Appendix 94
A Defining geometry for the simulation of the LaBr3:Ce module 95
Chapter 1
Gamma-ray astronomy
1.1 Introduction
Astronomy of today implies performing observations over the whole range of the electro-magnetic spectrum (see Figure 1.1), from radio astronomy with lowest energies of order of 1 peV (10 12 eV; 1.24⇥1015 nm) to gamma-rays with energies going up to 100 TeV (1014 eV;
1.24⇥10 11nm). To study each of these energy bands astronomy expanded into scientific
sub-fields such as X-ray astronomy, which focuses on X-rays or optical astronomy, which studies the visible spectrum and others. Each of these require separate instruments and study meth-ods, but in return each field provides us with wast amount of information. Some phenomena may be studied by more than one field, others are unique to a specific energy signature or a narrow energy interval.
In the same manner, gamma-ray astronomy is the astronomy which focuses on the most energetic phenomena. It starts at energies of several hundreds keV and goes up to several hundred TeV, covering more than nine orders of magnitude of the electromagnetic spectrum. Formally, there is no upper energy limit to gamma rays, yet pair-production on background photons ( + ! e++ e ) effectively sets a horizon to the explorable Universe. For photon
energies above 1 PeV (1015 eV), this horizon is of the size of our Galaxy (Gould and Schréder,
1966). Even more, the modern gamma-ray astronomy is divided into more narrow fields, such as: the low-energy range from about 100 keV to 2 MeV, the medium-energy range from about 2 to 100 MeV, the high-energy range from about 100 MeV to 100 GeV and the very-high-energy range above 100 GeV.
Gamma-ray astronomy has been growing since the mid of 20th century and provided us with the opportunity to study a wide range of topics, including stellar coronas, white dwarf stars, neutron stars, black holes, supernova remnants, clusters of galaxies, diffuse gamma-ray background radiation, gamma-ray bursts, pulsars and many others. The broad width of the gamma-rays energy range necessitates a big versatility in detectors applied. However, we can roughly separate all of the instruments into two groups: first one includes telescopes installed on the ground, which are grouped into ’ground-based’ gamma-ray astronomy instruments, and second one are all instruments carried into atmosphere or space by balloons and satellites, they constitute ’space-borne’ gamma-ray astronomy.
1.2 Ground-based gamma-ray instruments
Ground based instruments, as mentioned, are all the instruments located on the Earth’s sur-face. Usually they involve an array of several interconnected telescopes focused on detection of gamma-rays with energies above 100 GeV (very-high-energy gamma-ray astronomy). The main principle of work is an indirect detection of high energy -rays through their interaction with the Earth’s atmosphere. One example would be a telescope array based on Cherenkov technique, illustrated on the Figure 1.2, as it is one of the main techniques used today.
As seen on Figure 1.2, the incoming high energy -ray enters and interacts with the Earth’s atmosphere, and so produces secondary particles which may further interact with the atmo-sphere on their own. Such chain effect may eventually lead to a creation of an air shower effect, i.e. the creation of an "avalanche” of particles in the atmosphere. If the particles in the shower possess speeds close to the speed of light they will emit visible radiation (blue light on Fig-ure 1.2), due to Cherenkov radiation effect. Cherenkov radiation is then directly visible and recorded via optical telescopes from the ground. The Cherenkov cone opening is of the order of 105 106m2. The array of telescopes aims to cover as much of this area as possible. The data
Ground-based gamma-ray instruments
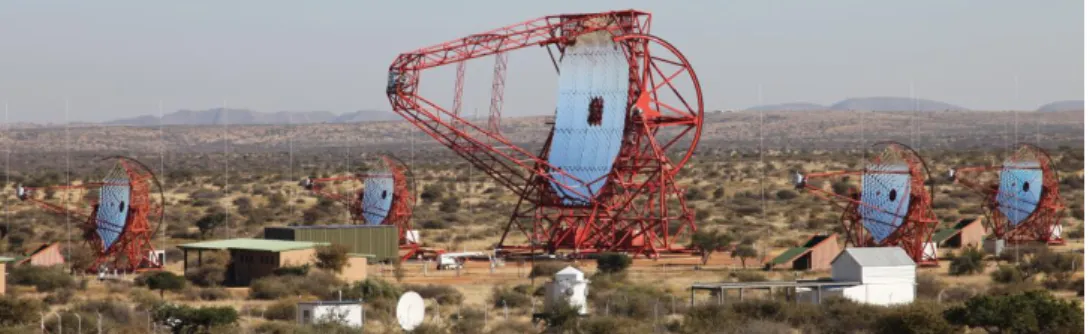
Figure 1.3: H.E.S.S. Telescope Array located in Namibia. It consisted of 4 smaller, 12 meters diameter telescopes, and one central telescope of 28 meters diameter.
from all of the individual instruments is then combined, in order to reconstruct the energy and the point/direction of origin of the primary -ray. An example of such telescope array is the High Energy Stereoscopic System (H.E.S.S.) shown on Figure 1.3.
On each telescope dish the Cherenkov light is collected via mirrors and focused on high sen-sitivity cameras. Some other well known telescopes, of the same type are: MAGIC, VERITAS and a future concept called the Cherenkov Telescope Array (CTA).
The CTA, Figure 1.4 is a large telescope array, currently under development, aiming to detect Very High Energy (VHE) gamma-rays, with the operating range from 10 GeV up to 300 TeV. When finished, the CTA will include two large groups of telescopes, one located in the Northern and the other located in the Southern hemisphere.
Figure 1.4: Left : Artist impression of the CTA site, including 23 m and 12 m telescopes. Right :Gamma-ray Cherenkov Telescope (GCT), one of the prototype instruments for the CTA. GCT is a small 4 m diameter telescope, installed at Paris Observatory in Meudon. It is also the first Schwarzschild-Couder telescope to be used in detection of the Cherenkov light.
Currently the Location South is planned in Atacama desert in Chile and Location North is planned on La Palma in the Canary Islands, Spain. The construction phase is expected to last from 2018 to 2023. Each of the two locations will be designed using different types of Imag-ing Atmospheric Cherenkov telescopes (IACTs) dependImag-ing on the energy range they observe. Several big, 23 m diameter telescopes, will focus on the gamma-rays between 20 and 200 GeV, a bigger array of medium, 12 m telescopes, will focus on energies from 100 GeV to 10 TeV and finally a large number of small, 4 m telescopes, is planned for the highest energies from sev-eral up to sevsev-eral hundred TeV. Although, the exact number of individual instruments is not yet determined, performance studies have been done with Location South containing 4 big, 24 medium and 72 small telescopes and Location North having 4 big and 15 medium-sized
scopes (Bernlöhr et al., 2013). The scientific goals are roughly grouped into three main parts: the origin and role of cosmic rays, nature and variety of particle acceleration around black holes and the search for the nature of matter and physics beyond the Standard Model1.
1.3 Space borne gamma-ray instruments
On the other hand, gamma-rays, from 0.1 MeV up to 10 GeV, are not visible from Earth and are mostly absorbed by the Earth’s atmosphere (see Figure 1.1). Therefore, to be able to study this part of the gamma-ray spectrum, balloons and satellites carrying instruments are launched into the Earth’s stratosphere or orbit. In this way, a direct observation of gamma-ray sources is performed.
In fact, this is why gamma-ray astronomy, as a discipline had a late start, it lacked any means for direct observations of gamma-rays from space. Therefore, first real experiments started after the 1960s. However, even before any experimental confirmations, there were var-ious scientific works predicting the existence of gamma-ray sources in the universe. Processes such as: cosmic ray interactions with interstellar gas, supernova explosions, and interactions of energetic electrons with magnetic fields were all believed to produce gamma-rays.
The first real astrophysical observation in gamma-rays domain was the detection of 2.223 MeV line from the solar flares, predicted by Morrison (1958). One of the first notable gamma-ray missions was Orbiting Solar Observatory 3 (OSO-3) mission, launched in 1967. Over the operating period of 16 months it recorded 621 gamma-ray sources, mostly above 50 MeV, distinguishing among galactic equatorial, galactic center and extragalactic sources, while mapping the sky distributions (Kraushaar et al., 1972). The mission carried various ex-periments utilizing NaI(Tl) and CsI(Tl) scintillators, photomultipliers and Anti-Coincidence Shielding (ACS) made of plastic scintillators.
Next notable gamma-ray mission was the Small Astronomy Satellite B (SAS-B/SAS-2) (Fichtel et al., 1975). It was launched by NASA in 1972. It consisted of spark chambers and Cherenkov counters with ACS, and operated in 30–200 MeV range. The main purpose was to measure the spatial and energy distribution of primary galactic and extragalactic gamma-ray emissions.
The first gamma-ray mission from ESA, Cosmic ray Satellite (’option B’.) or COS-B was launched in 1975. It provided extensive and important results in the energy range from 50 MeV to 5 GeV, including: creation of 2CG Catalogue (Swanenburg et al., 1981) with over 25 detected gamma-ray sources, the first complete map of the gamma-ray emission from the disc of our Galaxy and the first detectable emission from an extra-galactic object 3C273. The instrument implemented a CsI calorimeter and a spark chamber for determining the direction of gamma-rays (Bignami et al., 1975).
In 1979. NASA launched (H.E.A.O. 3) the third of its High Energy Astronomy Observatory satellites. It was the first mission to carry a gamma-ray instrument based on high-resolution Germanium detectors (Mahoney et al., 1980). The ’C-1’ or The Gamma-ray Line Spectrometer Experiment was an instrument made with oxygen cooled p-type High-Purity Ge (HPGe) de-tectors enclosed with CsI scintillators. It was capable of monitoring energies from 45 keV up to 10 MeV. Over six months it performed all-sky surveys, observing numerous gamma-ray lines, including the26Al line at 1.8 MeV for the first time.
Space borne gamma-ray instruments
OSSE COMPTEL
EGRET BATSE
Figure 1.5: View of the Compton Gamma Ray Observatory during deployment of the space-craft.
In more recent history we have the two of the biggest realized gamma-ray astronomy mis-sions; NASA’s Compton Gamma-Ray Observatory (CGRO) mission and ESA’s INTEGRAL mission.
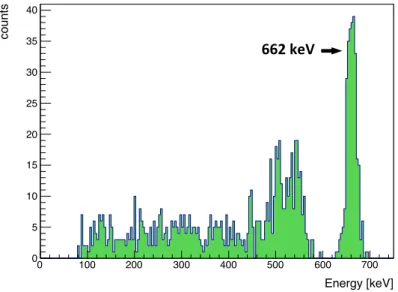
Compton Gamma-Ray Observatory (CGRO) was the second of NASA’s Great Observato-ries. At 17 tons, it was the heaviest astrophysical payload ever flown at the time of its launch, aboard the space shuttle Atlantis, on April 5th, 1991. CGRO was safely de-orbited and re-entered the Earth’s atmosphere on June 4, 2000. CGRO carried four instruments (Figure 1.5). COMPTEL (a classical Compton telescope, see Sect. 1.4.3) was one of the main instruments on board and was used to study the gamma-ray sky between 0.8 and 30 MeV. Energetic Gamma Ray Experiment Telescope (EGRET) was a pair production telescope, which covered the en-ergies from 20 MeV up to 30 GeV, composed of multi-level thin plate spark chamber for pair production detection with NaI scintillators underneath for added dynamics range. The Burst and Transient Spectrometer Experiment (BATSE) was an all sky monitor used for search of gamma-ray bursts, in the range of 20–600 keV. It was composed of modules containing NaI Spectroscopy Detector and NaI Large Area Detector. The Oriented Scintillation Spectrometer Experiment (OSSE) was designed to undertake comprehensive observations of astrophysical sources in the 0.05-10 MeV energy range. Secondary capabilities for gamma-ray and neutron observations above 10 MeV have also been included, principally for solar flare studies. The pri-mary detector element was the NaI(Tl)-CsI(Na) phoswich consisting of a 102-mm thick NaI(Tl) crystal optically coupled to a 76-mm thick CsI(Na) crystal. Each phoswich was coupled from the CsI(Na) to seven 89-mm diameter photomultiplier tubes (PMTs), providing an energy res-olution of 8% at 662 keV. Overall, the CGRO is a showcase of versatility in instrumental design for specific purposes.
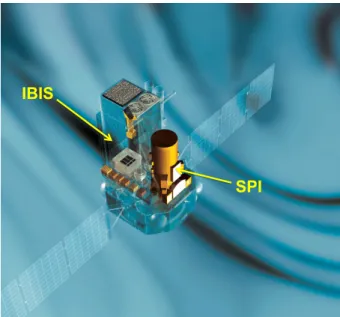
INTErnational Gamma-Ray Astrophysics Laboratory (INTEGRAL) is more recent and an-other great example of MeV astronomy instruments. This, still ongoing, big space mission was launched in 2002. by ESA. Onboard it has two instruments dedicated for gamma-ray detection (Figure 1.6): the Spectrometer on-board INTEGRAL (SPI) and the Imager on-board INTEGRAL (IBIS). SPI has a very high energy resolution of 2.2 keV (FWHM) at 1.3 MeV. It can observe energy interval between 18 keV and 8 MeV. The very high energy resolution comes from 19 hexagonal HPGe detectors which are used as primary calorimeters. Above the calorimeters is a complex hexagonal coded aperture mask. The coded mask is used to "cast a shadow" on the
SPI IBIS
Figure 1.6: Artist’s view of the INTEGRAL satellite.
detectors, by knowing the position of this shadow on the detectors plane it is possible to re-construct the incoming direction of the detected gamma-rays. IBIS, on the other hand, focuses on monitoring the continuum emission and the broad lines within the range of 15 keV up to 10 MeV. It also has a coded mask and two layers of detectors. The upper layer, ISGRI, is made from 16384 CdTe crystals and is used for detecting lower energy gamma-rays, while the bot-tom one, PICsIT, consists of 4096 CsI detectors which capture higher energy gamma rays. IBIS can also work as a Compton telescope when ISGRI and PICsIT are used in coincidence (Forot et al., 2007). Furthermore, two other instruments, OMC and JEM-X, are monitoring the visible and X-ray bands, respectively. This is a good example of how complex detection and study of gamma-ray phenomena can be, involving sometimes observations from several instruments covering different wide ranges of EM spectrum.
Fermi Gamma-Ray Space Telescope (formerly GLAST) is a large mission launched by NASA in 2008. It carries two main instruments onboard, first is a Large Area Telescope (LAT) and the second is The Glast Burst Monitor (GBM).
Fermi covers the gamma-rays energies from 8 keV up to 300 GeV. Main purpose of the LAT is to perform all sky surveys by covering the entire sky each 3 hours, with the ability for more precise point observation. It is a pair-production telescope comprised of two main de-tector volumes: a tracker and a calorimeter, both shielded with the anti-coincidence dede-tectors. LAT’s tracker is made of 16 tower modules, where each has 16 single sided silicon detector layers separated with 18 tungsten converter layers, meant for inducing the pair creation. The calorimeter is made of 16 CsI(Tl) modules, each containing 96 crystals placed in 8 layers. The anti-coincidence is done with a series of plastic scintillators placed outside of the detectors. The GBM instrument is aiming to monitor all sky, whenever possible and search for very prompt gamma-ray emissions, such as gamma-ray bursts (GRBs). The GBM is placed on the opposite side of LAT, and it has two main types of detectors: 12 NaI(Tl) scintillators for monitoring the X-rays and low-energy gamma rays from 8 keV to 1 MeV, and two bismuth germanate (BGO) detectors for monitoring higher energies up to 30 MeV. This currently operating mission has, so far, provided many important results and discoveries. Some of the examples of Fermi results are:
Space borne gamma-ray instruments
Figure 1.7: Fermi (GLAST) satellite schematic, with noted two main instruments: LAT - with tracker, calorimeter and ACS; and GBM on the opposite side.
J1906+0722).
• Measurement of the strongest energy release, recorded up to date, from a gamma-ray burst (GRB 080916C).
• Discovery of the gamma-ray bubbles originating from the center of the Milky Way. • Detection of more then 160 gamma-ray pulsars (only 9 were catalogued before Fermi
mission), including the first gamma-ray pulsar from another galaxy (PSR J0540-6919). • Observation of the first pulsar (PSR J1023+0038) that underwent emission transformation
from X-rays to gamma-rays, within the binary system AY Sextantis. Noted as the first example of a transient, compact, low-mass gamma-ray binary.
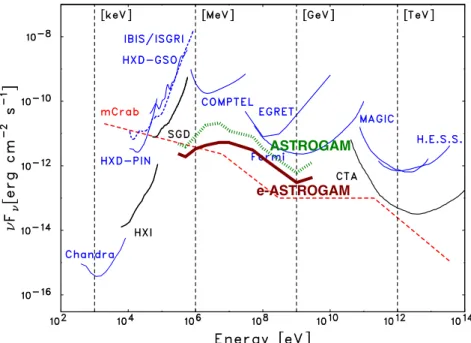
• Establishing classical novae as a distinct class of gamma-ray sources. For the first time ever, Fermi detected gamma-ray emissions produced by novae explosions, observing four such cases: V407 Cyg 2010, V1324 Sco 2012, V959 Mon 2012 and V339 Del 2013. Figure 1.8 shows the sensitivity of several space and ground-based instruments of high-energy astronomy. The highest energies, the TeV scale, is covered with high sensitivity ground based instruments such as HESS and CTA (Sect.). Such sensitivity is matched or even sur-passed with X-ray instruments, at the opposite side of the spectrum, e.g. with the Chandra observatory. Contrarily, the MeV range is standing out by poorest achieved sensitivity. The reasons for such inequality in coverage are discussed in the following section.
Figure 1.8: Sensitivity achieved in different energy bands of the gamma-ray astronomy by different instruments (from: Takahashi et al., 2012). Here, ⌫F⌫ = S(E) ⇥ E2 , where E is
the photon energy and S(E) the differential sensitivity, i.e. the minimum flux (e.g. in pho-tons cm 2s 1MeV 1) that can be detected at a given confidence level (usually 3 or 5 ) after
a given time of observation of the astrophysical source (see: Takahashi et al., 2012). The lines in blue represent past or currently operating instruments, while instruments planned for the near future are in black. The dashed red line shows the sensitivity reference expressed by mCrab, an equivalent to one thousandth part of intensity detected from the Crab nebula (including the Crab pulsar within it).
1.4 MeV astronomy
From the Figure 1.8 it is straightforward that the sensitivity of the instruments in the MeV range is weaker, up to five orders of magnitude, when compared to instruments in other energy bands. In association with this, stands the fact that currently and in the near future there are no planned missions to specifically cover the MeV range. Therefore the MeV astronomy remains an understudied part of the EM spectrum, and, at the moment, leaves a big scientific potential untouched. These facts, apart from being the main problems for the MeV astronomy are at the same time the main motivator which drives the community to constantly work and push out new ideas and projects in order to overcome the sensitivity gap. However, there are several strong limitations which provide a challenge for constructing instruments with higher-than-current sensitivities:
1. Gamma-rays are very hard to reflect, since their wavelengths are much smaller than the typical interatomic distance. Consequently, focusing mirrors for gamma-rays are of lim-ited performance and require large focal lengths, and as such are difficult to operate in space.
2. The instrumental background in the MeV range is very high, as MeV is also the domain of nuclear -ray lines which are produced by irradiation and activation of active and passive materials of the instrument in space.
MeV astronomy
3. Within the MeV range, the dominant process of photon interactions with matter is Comp-ton scattering, which causes difficulties in reconstructing detected events.
4. The probability of photons interacting with matter reaches minimum at around 1 MeV, which additionally decreases the probability for detection.
1.4.1 MeV astronomy science
The MeV astronomy domain is nevertheless associated with various scientific questions and future studies may provide information of interest to a large number of fields. Some of the main scientific topics of present MeV gamma-ray astronomy2include:
• Cosmic rays; their origin, propagation and interaction. Observation of emission between 0.1 and 10 MeV, e.g. 4.4 MeV and 6.1 MeV lines from 12C and16O respectively, would
give a direct measurement of the densitiy of low-energy cosmic-rays (LECRs) in the Milky Way.
• Supernovae; for the supernovae of the type Ia and related subtypes, information such as ignition mechanism and stellar configuration may be deduced from the radioactive isotopes they produce. Therefore, detecting gamma-rays from these isotopes is a diag-nostics tool to study the explosion process. For example, one of such isotopes is the56Ni
and its radioactive chain. For core collapse type II supernovae observations on isotopes as56Co,57Co can give information on nucleosynthesis, dynamics, possible jet formation
and more. 44Ti is one of the radioactive nuclei which is present in all supernovae
explo-sions (thermonuclear and core collapse) and is one of the most important tools to search for supernovae remnants and study the physical parameters of supernovae explosions. • Novae; they produce several gamma-ray lines of interest which may put constrains on
theoretical understanding of these objects. Most important are 511 keV line from e+–e
pairs annihilation, 478 keV from7Be decay and 1275 keV from22Na decay.
• Gamma-ray lines from long lived radioactive isotopes; e.g. 26Al and60Fe are produced and ejected into the interstellar medium by massive stars. Their lifetimes are of the order of 106 years, comparable to the evolutionary time scales of the OB associations and the
stars contained within. The presence of these isotopes traces the regions where massive stars formed recently. Further, by mapping the26Al in the Galactic plane, we could see
at which locations star formation happens and where the large-scale outflow from these regions transports matter, energy and momentum within the Galactic disc.
• Gamma-ray bursts; overall study of gamma-ray bursts through spectroscopy and po-larimetry in the MeV range may explain the physics of GRB jets as well as particle accel-eration and emission.
• Blazars and Active galactic nuclei (AGNs); most AGNs discovered so far emit in the MeV range, thus MeV astronomy can boost the discovery of new AGNs, placing constraints on physical models, determining the energy output.
• MeV emission from neutron-star and black-hole binaries; both inflows and outflows in accreting black-hole binaries can produce continuum MeV emission. Relativistic elec-trons appear to be present in accretion flows in both hard and soft spectral states. MeV
2see, e.g., the AstroMeV website at http://astromev.in2p3.fr/?q=aboutus/science.
tails due to their Compton emission have been discovered in Cygnus X-1 and a number of other sources. Jets of those systems are known to contain relativistic electrons and can produce MeV emission via both synchrotron and Compton processes. Thus, studying the MeV emissions we could understand both the jets and accretion flows in those systems. • Gamma-ray emission from magnetars and rotation-powered pulsars; magnetars are
neu-tron stars with extremely powerful magnetic fields. It is still not clear which processes, in such extreme fields, produce the non-thermal soft gamma-rays emission, nor do we understand the connection between the pulsar and magnetar population. More sensi-tive and extensive study of the pulsar emissions in the MeV range, can help identify the sources of these emissions and understand pulsar population.
• Gamma-ray emission from the active Sun; lots of questions related to solar flares such as the mechanisms of energy release and the acceleration of particles may be resolved by observation of various gamma-ray lines emitted from the Sun, e.g. 4.44 MeV from12C
and 6.13 MeV from16O are prompt lines produced in nuclear collisions during the solar
flares. Further examples of solar gamma-ray activity include, the 2.2 MeV line from neu-tron capture on hydrogen or delayed lines produced by radioactive isotopes synthesized during flares, such as 847 keV from56Co, or still unobserved52Mn line predicted at 1434
keV.
• Terrestrial Gamma-Ray Flashes; study of recently discovered terrestrial gamma-ray flashes (TGFs). Their emission spectrum goes up to 100 MeV and contains a 511 keV annihilation line as well. The process of TGFs creation is not yet explained and is be-lieved to be connected to particle acceleration during thunderstorms. More information on the topic would greatly improve our understanding of atmospheric phenomena and climate in general.
1.4.2 Gamma-ray interaction with detector material
Primary principle of detecting gamma rays in the MeV range is based on exploiting main gamma-rays interaction mechanisms with matter.
As seen on Figure 1.9, depending on the incident energy, gamma rays may undergo several processes: photoelectric absorption, Compton scattering and e+–e pair production.
1.4.2.1 Photoelectric absorption
Photoelectric effect is the dominant interaction for X-ray and gamma-ray energies from sev-eral keV up to sevsev-eral hundred keV. An incoming gamma-ray interacts primary with a bound atomic electron, transferring its total energy to the interaction material and disappearing in the process. In order for photoelectron to be emitted from the material, the energy of the gamma-ray has to be higher than the binding energy of an electron. The photoelectric effect can be followed by fluorescent emission which can further lead to secondary photoelectric effect. The energy of the created photoelectron Ee is given by the formula:
Ee = h⌫ EION (1.1)
where h⌫ is the energy of the original gamma-ray and EIONis the ionization or binding energy
of the electron in the atomic shell. Essentially, EION is also absorbed in the interaction
MeV astronomy 10-3 10-2 10-1 1 10 10-2 10-1 1 10 102 103 104 Photoel. Compton Pair
Mass attenuation for Si
Photon energy (MeV)
Mass attenuation (cm
2 g
-1 )
Figure 1.9: Cross-sections for different interactions of gamma-rays with matter, calculated for Si, depending on the energy of an incident gamma-ray.
probability for the photoelectric effect scales roughly as: pphotoelectric/
Zn
(h⌫)3, (1.2)
where Z is the atomic number of the target material and the exponent n ranges from 3 to 4 depending on the energy.
1.4.2.2 Compton Scattering
The probability for Compton interaction increases for gamma-rays above 100 keV and be-comes the dominant interaction at ⇠1 MeV. The effect is illustrated on Figure 1.10. An incident gamma-ray is scattered on an electron and thus changes its original trajectory and energy. An electron, called Compton electron, receives a part of the gamma-ray’s energy and also changes its trajectory. The energy of the scattered -ray is given by the classical Compton formula:
E0 = E 1
1 +mE
ec2(1 cos ⇥)
, (1.3)
where meis the mass of an electron at rest and scattering angle ⇥ may take any value from 0 to
2⇡.
The differential cross section of Compton scattering for unpolarized photons scattering off unbound electrons is given by the Klein-Nishina formula:
d d⌦ = 1 2↵ 2r c2f (E , ⇥)2[f (E , ⇥) f (E , ⇥) 1 1 + cos ⇥2] , (1.4)
where ↵ is a fine structure constant, rc = m~ec is the reduced Compton wavelength and
f (E , ⇥) = EE0 = 1
1+ E
mec2(1 cos ⇥)
. The above equation is also called the unbound Compton cross section since the electron is assumed to be not bound to an atom and therefore to be at rest. Because this is not the case for any detector material used in Compton telescopes today, the Klein-Nishina cross section constitutes an approximation.
Figure 1.10: Simple representation of a Compton effect. The incident gamma-ray (in red) hits an electron at rest and scatters with lower energy (in blue). The noted angle ⇥ is the angle between the original and scattered direction of the gamma-ray, and is called Compton scattering angle. A part of energy is also given to the electron, called Compton electron, which scatters in a different direction, defined by the electron scattering angle.
Z"
γ"
Z’"
e
+"e
&"Figure 1.11: Representation of an electron-positron (e e+) pair production in the
electromag-netic field of a nucleus of charge Z. Noted with Z0 is the nucleus of the same charge but with
change in momentum due to occurred interaction.
1.4.2.3 Pair production
When a gamma-ray possesses an energy above 1.022 MeV (double energy of an electron at rest) it can interact with matter via pair production. The interaction usually occurs in the electro-magnetic field of a nucleus and the energy of an incident gamma-ray is transformed to produce an electron-positron pair (e e+). The excess of energy of the gamma-ray affects the nucleus,
which recoils. The effect is visualized on Fig. 1.11 and described through the following equa-tions of energy and momentum conservation:
E = Ee + Ee+ + En+ 2mec2 (1.5) ~
p = ~pe + ~pe++ ~pn. (1.6) Here, Ee , Ee+, and Enare the kinetic energies of the electron, positron and recoiling nucleus, respectively, and ~piis the momentum of the particle i.
If the photon’s energy exceeds four times the rest mass of an electron, pair creation can also happen in the field of an electron. Here the momentum is not transferred to the nucleus, but instead to the target electron. The ratio of the probability for pair production on an electron to that for pair production on a nucleus is given by:
pelectron=
1
CZpnucleus, (1.7)
where C is a factor depending on the incident gamma-ray energy, e.g. C = 2.6 at E = 6 MeV and C = 1.2 at E = 100 MeV.
MeV astronomy r1, E1 r2, E2 Ω θ γ#
a)
D1 D2b)
r4, E4 Calorimeter TrackerFigure 1.12: a) Principle of a classical Compton telescope made of two detectors D1 and D2. b) An advanced Compton telescope comprising a tracker allowing the tracking of the Compton electron and a 3-D position sensitive calorimeter. Measuring the direction of the recoil electron can constrain the gamma-ray event to an arc of the Compton annulus.
1.4.3 Principle of a Compton telescope
A so-called classical Compton telescope operates on the method of collecting enough data to be able to calculate all of the values from the Compton formula (Eq. 1.3). It uses a double detector plane as shown in Figure 1.12a. The first plane is used to scatter the incident gamma-rays. In order to increase the probability of Compton scattering with respect to photoelectric absorption and pair creation, low-Z materials are used. Indeed, the Compton scattering probability scales as the number of electrons of the target atom, i.e. Z, whereas the probability for the photoelec-tric effect scales as Znwith n in the range 3–4 (see Eq. 1.2) and that for the pair production scales
as Z2. After scattering it is possible to capture the photon in the second plane. Here, high-Z
materials are used in order to fully absorb the energy of the scattered photon. Combining the energy left in both D1 and D2 we have:
E = E1+ E2 (1.8) and ⇥ = arccosh1 mec2⇥ ✓ 1 E2 1 E1+ E2 ◆ i . (1.9)
The above equation gives the scattering angle ⇥ with respect to the direction defined by the two positions of interaction r1 and r2 inside the detector planes D1 and D2 (Fig. 1.12a). The
calculated direction of an incoming gamma-ray is thus limited to an event circle in the sky and not a specific direction (i.e. a point in the sky).
Finding interaction position within the detector is possible through two options. The first one is to use highly pixelated detectors, made out from a lot of small detector units. The second is to create one big detector and perform position localization within it, a method we are using in our work and that we shall explain more later on. Finally, it is important to maintain the correct sequence of events, where for one event we should know which interaction, either in detector D1 or D2, is the first and which is the second. This can be done by performing time-of-flight measurements between the two detector planes, as in the COMPTEL instrument of the CGRO mission.
1.4.3.1 Advanced Compton Telescope (ACT)
Shown on Figure 1.12b is an ACT concept. By simple comparison with a classical Compton telescope we note a more compact design, where two detector layers, a tracker and a calorime-ter, are next to each other, without any spacing. The tracker is made of multiple layers which allows for detection of events with several Compton interactions, opposed to e.g. single event tracking with COMPTEL. This contributes to a gain in detection efficiency and in field-of-view (FOV) of an ACT, and is allowed by new detector materials.
The main characteristic of an ACT is the use of detectors with a fine sensitivity to the 3D positions of the interactions, in order to track with high accuracy, both, the scattered gamma rays and the Compton electrons. This is important for distinguishing a cosmic gamma-ray photon from a background event produced by, e.g. a cosmic-ray particle impinging the satellite or a radioactive decay from an activated material within the telescope. Taking a full advantage of recent progresses in silicon detectors and readout microelectronics, the tracker of an ACT can be made by a stack of double sided Si strip detectors (DSSSDs) with fine spectral resolution. In general, the possibility to track Compton recoil electrons significantly increases the precision on reconstructing the position of origin of gamma-rays. However, electron tracking is possible only for gamma-rays with energies above about 1 MeV, depending on the thickness of the tracker detectors, as they transfer enough energy for scattered electrons to leave visible tracks in the detector. The benefits of tracking are explained in the next subsection.
Furthermore, an ACT may use two concepts for the calorimeter design, either a highly pixe-lated detector volume or connected bigger detector blocks with an imaging capability. Both are used to track the impact position of detected gamma-rays. However, new scintillators and elec-tronics allow the creation of monolithic scintillator detector modules with imaging capability in 3D. The 3D first-impact-position reconstruction of a detected gamma-ray, when combined with increase in spectral resolution, results in improving the constraints on reconstruction of Compton events.
1.4.3.2 Compton Imaging
Once a full Compton event is detected, we are able to reconstruct a so-called Compton or event cone, as noted on the Figure 1.12. The properties of the reconstructed event circle or arc, shown on the right panel of Fig.1.12, depend on the performance of the detectors. The more precise they are, the thicker and more intense the event circle (arc) will be. Such general method, used by Compton satellites, of determining the position from which the detected gamma-rays originate is named Compton Imaging and is illustrated on the Figure 1.13.
Image on the left of Fig. 1.13 is a Compton image obtained with a classical Compton tele-scope. Each cone corresponds to a detected gamma-ray, and, as mentioned, the accuracy on energy and position measurements influence the shape of the cones. By detecting multiple events with the same origin, the intersection of many event cones determines the position of a detected gamma-ray source.
Using an ACT we can benefit from increased precision by employing the mentioned Comp-ton recoil electron tracking. An example is given on the middle image on Figure 1.13. Such image is usually obtained by detecting the gamma-rays of energies between about 1 and 10 MeV, where the Compton electron paths can be tracked. The information gained from know-ing electron scatterknow-ing angle and its energy allows the reduction of an event cone to an event arc, where the precision by which they are measured defines the arc’s size. The far right im-age on the Fig. 1.13 is the case of Compton reconstruction of high-energy events with electron
MeV astronomy
5.3. IMAGING RESPONSE OF A COMPTON AND PAIR TELESCOPE 83
outside the image space. Consequently, only a fraction of the event is seen in the image, the fraction vi.
The original list-mode algorithm (Wilderman et al., 1998) did not contain any criteria to stop the iterations. It simply converges asymptotically. The best images, however, are obtained shortly before convergence, when the width of the point sources corresponds to the intrinsic angular resolution of the detector. At this point the iteration is stopped by hand.
In the following section the determination of the response T is discussed in more detail.
5.3 Imaging response of a Compton and pair telescope
Figure 5.3: The 4 different event types of a tracking Compton and pair telescope. Left to right: Untracked Compton events; tracked Compton events; high-energy tracked Compton events with incomplete absorption; pair events.
Figure 5.3 illustrates the four basic event types of a MEGA-type instrument: For most interactions below 2 MeV, the kinetic energy of the Compton recoil electron is not sufficient to produce a track. Therefore the photon’s origin can only be restricted to a cone (see Section 2.2.4.1 and Figure 5.3, left). Its width is determined by the accuracy of energy and position measurements. Between 2 and 10 MeV most events have an electron track and a reasonable amount is completely absorbed (at least in the MEGA satellite geometry). Thus, their origin is restricted to an arc, a section of the cone (Figure 5.3, middle left), whose length is determined by Moli`ere scattering. Above 10 MeV most of the Compton scatter events are incompletely absorbed, but the direction of electron and scattered photon is well defined. Therefore, the origin of the photon can be restricted to the great circle between (reverse) electron and photon direction (Figure 5.3, middle right). Since the direction of the scattered gamma ray can be determined more accurately than the direction of the recoil electron (Moli`ere scattering), the origin distribution has a drop-like shape. Measured energies can further restrict this arc (details see Section 2.2.4.2). The origin of pair events (Figure 5.3, right) can be calculated from electron and positron direction and energy (see Section 2.3). The main uncertainties are due to Moli`ere scattering of electron and positron in the Silicon layers.
Two parameters describe the imaging response in Equation 5.5: the event response tijand
the sensitivity sj(Note that the word “sensitivity” denotes a quantity here that is different
from the sensitivity describing the overall performance of an astrophysical telescope). Figure 5.4 summarizes all probabilities which contribute to these parameters for Compton events.
The easiest way to determine the sensitivity sj are Monte-Carlo simulations. This avoids
the analytic calculation of all the probabilities of Figure 5.4. The determination of the response tijis less straightforward: it is calculated by looping over all image-space bins and describes
the probability that the measured photon was emitted from any one given image bin. The calculation has two steps: determine the absorption probability and multiply by a normalized response which basically represents the Compton cone/arc or pair origin distribution.
Using list mode allows to strongly simplify the large response matrix required for a binned-mode approach (see Table 5.1) — given the case of a very sparsely populated data space, as 5.3. IMAGING RESPONSE OF A COMPTON AND PAIR TELESCOPE 83
outside the image space. Consequently, only a fraction of the event is seen in the image, the fraction vi.
The original list-mode algorithm (Wilderman et al., 1998) did not contain any criteria to stop the iterations. It simply converges asymptotically. The best images, however, are obtained shortly before convergence, when the width of the point sources corresponds to the intrinsic angular resolution of the detector. At this point the iteration is stopped by hand.
In the following section the determination of the response T is discussed in more detail.
5.3 Imaging response of a Compton and pair telescope
Figure 5.3: The 4 different event types of a tracking Compton and pair telescope. Left to right: Untracked Compton events; tracked Compton events; high-energy tracked Compton events with incomplete absorption; pair events.
Figure 5.3 illustrates the four basic event types of a MEGA-type instrument: For most interactions below 2 MeV, the kinetic energy of the Compton recoil electron is not sufficient to produce a track. Therefore the photon’s origin can only be restricted to a cone (see Section 2.2.4.1 and Figure 5.3, left). Its width is determined by the accuracy of energy and position measurements. Between 2 and 10 MeV most events have an electron track and a reasonable amount is completely absorbed (at least in the MEGA satellite geometry). Thus, their origin is restricted to an arc, a section of the cone (Figure 5.3, middle left), whose length is determined by Moli`ere scattering. Above 10 MeV most of the Compton scatter events are incompletely absorbed, but the direction of electron and scattered photon is well defined. Therefore, the origin of the photon can be restricted to the great circle between (reverse) electron and photon direction (Figure 5.3, middle right). Since the direction of the scattered gamma ray can be determined more accurately than the direction of the recoil electron (Moli`ere scattering), the origin distribution has a drop-like shape. Measured energies can further restrict this arc (details see Section 2.2.4.2). The origin of pair events (Figure 5.3, right) can be calculated from electron and positron direction and energy (see Section 2.3). The main uncertainties are due to Moli`ere scattering of electron and positron in the Silicon layers.
Two parameters describe the imaging response in Equation 5.5: the event response tijand
the sensitivity sj (Note that the word “sensitivity” denotes a quantity here that is different
from the sensitivity describing the overall performance of an astrophysical telescope). Figure 5.4 summarizes all probabilities which contribute to these parameters for Compton events.
The easiest way to determine the sensitivity sj are Monte-Carlo simulations. This avoids
the analytic calculation of all the probabilities of Figure 5.4. The determination of the response tijis less straightforward: it is calculated by looping over all image-space bins and describes
the probability that the measured photon was emitted from any one given image bin. The calculation has two steps: determine the absorption probability and multiply by a normalized response which basically represents the Compton cone/arc or pair origin distribution.
Using list mode allows to strongly simplify the large response matrix required for a binned-mode approach (see Table 5.1) — given the case of a very sparsely populated data space, as 5.3. IMAGING RESPONSE OF A COMPTON AND PAIR TELESCOPE 83
outside the image space. Consequently, only a fraction of the event is seen in the image, the fraction vi.
The original list-mode algorithm (Wilderman et al., 1998) did not contain any criteria to stop the iterations. It simply converges asymptotically. The best images, however, are obtained shortly before convergence, when the width of the point sources corresponds to the intrinsic angular resolution of the detector. At this point the iteration is stopped by hand.
In the following section the determination of the response T is discussed in more detail.
5.3 Imaging response of a Compton and pair telescope
Figure 5.3: The 4 different event types of a tracking Compton and pair telescope. Left to right: Untracked Compton events; tracked Compton events; high-energy tracked Compton events with incomplete absorption; pair events.
Figure 5.3 illustrates the four basic event types of a MEGA-type instrument: For most interactions below 2 MeV, the kinetic energy of the Compton recoil electron is not sufficient to produce a track. Therefore the photon’s origin can only be restricted to a cone (see Section 2.2.4.1 and Figure 5.3, left). Its width is determined by the accuracy of energy and position measurements. Between 2 and 10 MeV most events have an electron track and a reasonable amount is completely absorbed (at least in the MEGA satellite geometry). Thus, their origin is restricted to an arc, a section of the cone (Figure 5.3, middle left), whose length is determined by Moli`ere scattering. Above 10 MeV most of the Compton scatter events are incompletely absorbed, but the direction of electron and scattered photon is well defined. Therefore, the origin of the photon can be restricted to the great circle between (reverse) electron and photon direction (Figure 5.3, middle right). Since the direction of the scattered gamma ray can be determined more accurately than the direction of the recoil electron (Moli`ere scattering), the origin distribution has a drop-like shape. Measured energies can further restrict this arc (details see Section 2.2.4.2). The origin of pair events (Figure 5.3, right) can be calculated from electron and positron direction and energy (see Section 2.3). The main uncertainties are due to Moli`ere scattering of electron and positron in the Silicon layers.
Two parameters describe the imaging response in Equation 5.5: the event response tijand
the sensitivity sj(Note that the word “sensitivity” denotes a quantity here that is different
from the sensitivity describing the overall performance of an astrophysical telescope). Figure 5.4 summarizes all probabilities which contribute to these parameters for Compton events.
The easiest way to determine the sensitivity sjare Monte-Carlo simulations. This avoids
the analytic calculation of all the probabilities of Figure 5.4. The determination of the response tijis less straightforward: it is calculated by looping over all image-space bins and describes
the probability that the measured photon was emitted from any one given image bin. The calculation has two steps: determine the absorption probability and multiply by a normalized response which basically represents the Compton cone/arc or pair origin distribution.
Using list mode allows to strongly simplify the large response matrix required for a binned-mode approach (see Table 5.1) — given the case of a very sparsely populated data space, as
Figure 1.13: Left : A Compton image gained from a classical Compton telescope. Middle : An image obtained with a Compton telescope capable of electron tracking. Right : Imaging with electron tracking for the case of high-energy events (from: Zoglauer, 2006).
2.2. COMPTON SCATTERING 25 [MeV] g Partly measured E 0 1 2 3 4 5 [MeV]e Partly measured E 0 1 2 3 4 5 6 7 8 9 10 0 5 10 15 20 25 30 35 40
is smaller than measured: Calculated
impossible in the absence of measurement errors Complete absorption [deg] d 1 - cos 0 E 2 /tan 0 2E
Figure 2.11: Angular extent of the seg-ment of the great circle describing the possible origins of the Compton event in case of incompletely absorbed energies but well defined directions of the recoil electron and the scattered gamma ray for a fixed total scatter angle of 45 . Only those photons which lie on the line of com-plete absorption can be reconstructed to a point (in absence of measurement errors).
through the layers. Fortunately, it is in this same energy regime above 10–20 MeV were the approach is needed most, since here almost all Compton events are incompletely absorbed.
Of course, although it is possible to image such events, only lower and sometimes upper limits on the photons’ incident energy can be given.
2.2.5 Angular resolution determination
No Compton telescope has perfect energy and position resolutions. Together with Doppler-broadening (Section 2.2.6), those measurement uncertainties limit the accuracy with which the origin of the photons can be determined. For an electron-tracking Compton telescope, this angular resolution can be described in terms of the angular resolution measure (ARM) and the scatter plane deviation (SPD). To determine these, the origin of the photons and thus their original direction ~eineeds to be known.
Origin of photons
!" !"
Real Origin of photons Calculated origin of photon
!# !#
Figure 2.12: The angular resolution measure (ARM) is defined as the smallest angular distance between the known origin of the photon and the Compton cone. It is a measure for the width of the Comp-ton scatter cone or arc. A real origin lying within the cone, which mostly implies that the scattered gamma ray is incompletely absorbed, results in a neg-ative ARM value, a real origin outside the cone,
i.e. an incompletely absorbed recoil electron, results in a positive ARM value.
Figure 2.13: The scatter plane deviation (SPD) is defined as the angular distance on the Compton cone between the known origin of the photons and the calculated one. It is a measure for the length of the Compton scatter arc.
The ARM (Figure 2.12) for a reconstructed Compton event is defined by the shortest dis-tance between the known initial photon direction ~ei and the photon scatter cone defined by
Figure 1.14: The ARM ( ') is the measure of the width of the Compton scatter cone or an arc. The 'ARM value can be positive, meaning the real point of origin lays outside the cone and
we have an incomplete detection of an recoil electron, or if 'ARM is negative, the point of
origin lies inside the cone, and the scattered gamma-ray is incompletely absorbed (Zoglauer, 2006).
tracking. Usually, gamma-rays with energies above 10 MeV are not fully detected, meaning the Compton scattering is incompletely absorbed by the instrument. However, for these events the recoil electrons receive high enough energies, so they have a well defined recoil paths. Such paths are easier to track and thus provide an increase in precision on determining the original position of the gamma-ray source.
1.4.3.3 Angular resolution measure
For any Compton telescope, the ability to determine the point of origin (the incoming direc-tion) of a detected gamma-ray, is, as noted before, limited by the uncertainties of the measure-ment (i.e. energy or position resolution) and additionally by Doppler broadening. Therefore, through a value named Angular Resolution Measure (ARM), we express the precision of an instruments in determining the original direction of the detected events. The ARM is defined as the smallest angular distance between the known point of origin and the Compton cone (Zoglauer, 2006). Or in other words, the shortest distance between the known original direction of the photon and the scatter cone reconstructed from the information on the scattered gamma photon. The ARM is illustrated on the Figure 1.14.
Coded mask Laue lens 30 meters deployable mast Focal-plane instrument
Figure 1.15: DUAL in deployed configuration with a detailed view of the focal plane instru-ment ASCI (All-Sky Compton Imager) made of a compact array of cross-strip germanium de-tectors.
1.4.4 New concepts in MeV gamma-ray instruments
To be able to access the science of the MeV range and to overcome the instrumental limits, the MeV scientific community is working constantly on new concepts of instruments and detection, with the goal to gain experience and better prepare for the future missions. I will give a list of several such projects, proposed to the European Space Agency (ESA) over past several years, as they illustrate new ideas and approaches in the field, and then in Chapter 2 give an overview of our project, as a part of these future space mission research and development. In addition, the work presented in the next chapters is a direct continuation of work done for missions such as e.g. GRIPS (detailed below).
1.4.4.1 Gamma-ray proposals of ESA’s M3 Call
In 2010, the European Space Agency solicited proposals from the broad scientific community for the competitive selection of mission concepts to be candidate for the implementation of the third medium-size mission (“M3”) of the Cosmic Vision scientific program for launch in 2025. Three proposals were issued by the gamma-ray community: DUAL (von Ballmoos et al., 2012), CAPSiTT (Lebrun et al., 2010) and GRIPS (Greiner et al., 2012).
DUAL was a proposal which implements a novel type of gamma-ray lens. Using a mosaic of small crystals in Laue geometry (e.g. see: Section 2, von Ballmoos, 2007), allows the focusing of gamma-rays through diffraction on a small detection area. This provides the separation of collection and detection area, reducing background, as less material is used. The concept is shown on Figure 1.15. The focal plane instrument is a Compton telescope made of cross-strip Ge detectors working in the range from 0.1 to 10 MeV. However, the drawback of germanium is the need for a cooling system. In addition to a Laue lens, the main satellite also carries a coded mask. The plan was to use a Soyuz launcher to place the DUAL instrument in an L2 orbit.
Compton And Pair Silicone Timing Tracker (CAPSiTT), illustrated on Figure 1.16, is an all silicon instrument, made from layers of double sided silicon strip detectors (DSSSDs). The operational energy range was from 100 keV up to 100 MeV. It can work as a pair production telescope and Compton telescope, using a 3 Compton technique, where by knowing the energy and position of two consecutive Compton scatterings can give us the incoming direction of the original particle. The advantages include lower mass, which means lower internal background, and the use of a single technology for the whole instrument. However, this concept requires a large number of thick (2 mm) DSSSDs (11520 detectors of 10 ⇥ 10cm2 area), which raises a
problem of supply and cost. As for the space deployment, idea was to use a VEGA launcher to send the instrument to an equatorial low-Earth orbit (at about 550 km altitude).
MeV astronomy
Figure 1.16: View of the CAPSiTT payload made of a stack of double-sided silicon strip detec-tors, on top of the Sentinel 3 platform developed by Thales Alenia Space.
GRM
XRM
IRT
Figure 1.17: GRIPS configuration in the two satellite option, where the Gamma-Ray Monitor (GRM) is on one satellite, and the X-Ray Monitor (XRM) and the InfraRed Telescope (IRT) on the other.
Gamma-Ray Imaging, Polarimetry, and Spectroscopy (GRIPS) (Figure 1.17) was the third M3 ESA mission proposal for a gamma-ray observatory. The main on-board instrument Gamma-Ray Monitor (GRM) is an ACT and a pair-production telescope, meant to operate be-tween 0.2 and 100 MeV. It is designed out of two main detector layers. The first detector is a tracker constructed of 64 layers of 8 ⇥ 8 DSSSDs of 10 ⇥ 10 cm2 area. The tracker works as
a Compton scatterer in the Compton telescope mode, and as a pair production telescope in the high-energy mode, above about 10 MeV. Above 2 MeV the DSSSDs are able to perform a tracking of a Compton recoil electron. The second main GRM detector is a calorimeter made of a very large number (⇠ 75000) of small LaBr3:Ce scintillator bars of 5 ⇥ 5 mm2 cross
sec-tion with the total mass of ⇠ 500 kg. The scintillator crystals are read out with Si Drift Diode (SDD) photodetectors and are encasing the tracker volume from all sides, apart the detection plane. The side scintillators are 2 and 4 cm thick, while the bottom one is 8 cm thick and read out on both ends. Such calorimeter enables the GRM to operate in the ‘spectroscopy’ mode, apart from the ‘telescope’ mode; this implies performing only spectroscopic measurements of energy deposits inside the scintillators, for e.g. high-level spectroscopy of the GRBs. The whole
!
AC system
Tracker Calorimeter
Figure 1.18: Left : ASTROGAM satellite with deployed solar panels and radiators. Right : Zoom-in on the satellite’s payload showing the Silicon Tracker, the Calorimeter and the Anti-Coincidence (AC) system.
GRM instrument is surrounded with an Anti-Coincidence Shielding (ACS) made with plastic scintillators.
GRIPS mission carries two further instruments, an X-Ray Monitor (XRM) and an InfraRed Telescope (IRT). The main purpose of XRM is to gain the precision on the determining the position of the GRBs, where it works in the combination with GRM, and further to observe the GRB emission in the X-ray range from 0.2 to 12 keV. It is a concept made of 7 Walter-I telescopes, identical to eROSITA instrument (Predehl et al., 2014). The IRT is meant to to rapidly identify the GRBs at high redshift. It is a telescope of mirrors with multi-band photometry similar to the EUCLID mission (Laureijs et al., 2010). The GRIPS mission was supposed to be launched to equatorial low-Earth orbit using a Soyuz launcher.
In summary, although quite different in their design (with or without a calorimeter, asso-ciated or not to a focusing optics etc.), the three gamma-ray instruments proposed for ESA’s M3 Call were all advanced Compton telescopes with some capabilities for electron tracking, characterized by a very large field of view to monitor the poorly known MeV gamma-ray sky.
1.4.4.2 ASTROGAM
ESA’s Call for the fourth medium-size mission opportunity in the Agency Science Program was released in August 2014 and the proposal submission deadline was January 15, 2015. This time, the gamma-ray scientific community has responded in a unified manner by working together on a single proposal: the ASTROGAM mission. The main elements of the ASTROGAM pay-load (Figure 1.18) include a Si Tracker made from 2520 Si DSSSDs arranged in 70 layers of 6 ⇥ 6 tiles, which is coupled to a calorimeter made from 12544 bars of CsI(Tl) scintillation crystals.
The operating modes of such instrument are Compton regime from 0.1 to 10 MeV and pair productionregime up to 3 GeV. The Si tracker, similarly to GRIPS or CAPSiTT, is capable of resolving energy deposits and tracking of both the Compton photon and (for the energies above 1 MeV) the recoil electron. While the calorimeter, due to precision and high pixelization, is capable of resolving both the energy and the interaction position of a Compton scattered pho-ton. Combined with an Anti-Coincidence Shielding (ACS) the instrument operates as an Ad-vanced Compton Telescope which performs Compton Imaging and polarimetry. At energies above 10 MeV, the Si Tracker is used as electron-positron pair production medium by gamma-rays interacting with the fields of hit nuclei within the tracker, allowing for ASTROGAM to
MeV astronomy
ASTROGAM
e-ASTROGAM
Figure 1.19: Same as Figure 1.8, but with the predicted sensitivity of ASTROGAM for an effec-tive exposure of one year of a high Galactic latitude source. The curve for e-ASTROGAM is the goal sensitivity of the larger scale and enhanced instrument that will be proposed to ESA in 2016 in response of the M5 Call.
function as a pair-production telescope.
Following ESA’s guidelines for the M4 Call, the ASTROGAM payload was designed to have a mass of 300 kg. Although the proposed mission concept has been very well evaluated by ESA’s Technical and Programmatic Evaluation Panel, it was unfortunately finally not selected for a mission study. For the M5 Call, to be issued in 2016, the ASTROGAM Collaboration is currently working on a larger scale instrument and satellite (the e-ASTROGAM mission), with an estimated payload mass of about one ton. The enabling technologies and processes will be the same as those of the M4 project. Such an extension of the mission concept is aiming at further improving the leap in sensitivity compared to previous missions, especially between 1 and 10 MeV (see Fig. 1.19).
In the preliminary design of e-ASTROGAM, the Si Tracker consists of four units compris-ing 56 layers of 5 ⇥ 5 DSSSDs. Each DSSSD has a geometric area of 9.5 ⇥ 9.5 cm2, a thickness
of 500 µm, and a strip pitch of 240 µm. The total detection area then amounts to 9025 cm2
and the total Si thickness to 2.8 cm, which corresponds to 0.3 radiation length on axis. The e-ASTROGAM Calorimeter comprises 8464 parallelepiped bars of CsI(Tl) of 8 cm length (cor-responding to 4.3 radiation length) and 10⇥10 mm2cross section. The scintillation light of each
bar is collected by two matrices of 4 ⇥ 4 SDDs, which are glued to the crystal at both ends. The new design aims to further significantly improve the sensitivity in the crucial energy range 0.3 – 100 MeV (see Fig. 1.19). The proposed gamma-ray observatory would then open an entirely new window of opportunity for discovery in the evolving energetic Universe.
Chapter 2
A prototype of an Advanced Compton
Telescope
2.1 Introduction
The main goal of this thesis is to develop and study a small scale prototype of an Advanced Compton Telescope (ACT). The prototype consists of one to three double sided silicon strip detector (DSSSD) detector planes, that form the tracker, and one Anger-type calorimeter mod-ule, made of monolithic scintillator crystal. The tracker and the calorimeter are mounted on a specialized test bench that has been developed at CSNSM (Centre de Sciences Nucléaires et de Sciences de la Matiére) and IPN (Institut de Physique Nucléaire) in Orsay. The project is done in the framework of a collaboration between several research groups. IPNO and APC (AstroParticule et Cosmologie) laboratories are working on the tracker elements, primary on testing the DSSSDs and the corresponding read-out and acquisition systems. Our group at CSNSM is producing a calorimeter based on novel inorganic scintillator detectors, with the following electronics and acquisition system. In parallel, all of the work is connected to in-ternational collaboration under ASTROGAM proposals as well as any similar future missions for the MeV gamma-ray astronomy, with the overall goal to improve and push forward the performance of instruments in this range.
2.2 The ACT prototype test bench
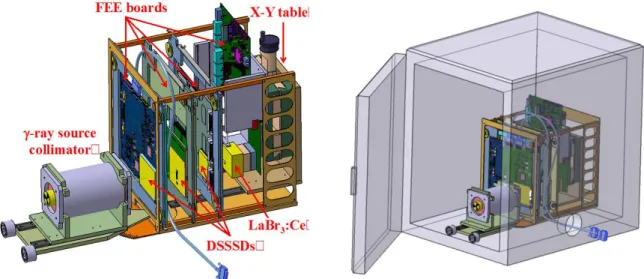
The model of an instrument and a designed test-bench aimed for performance testing are pre-sented on the Figure 2.1.
The mechanical device of the telescope is completed and the integration of the LaBr3:Ce module and the first DSSSD is under way. The system comprises supports to accommodate up to three DSSSDs with their associated FEE cards (the two developed at IPNO and the one made by the team of the LabEx UnivEarthS). The instrument is mounted on an X-Y table which allows the full frontal coverage using collimated gamma-ray sources. The complete readout from all detectors is lead to a PC and controlled by NARVAL (Grave et al., 2005) based applica-tion. This entire device will be placed in a special black box, designed at IPNO, ensuring both the light sealing and good electromagnetic compatibility of the apparatus. Moreover, some of the test measurements will be performed in a climatic chamber, available at IPNO, at tempera-tures between 10oand 20oC. This will allow us to study the telescope under better operating
Figure 2.1: Left: Mechanical drawing of the gamma-ray telescope concept. Right: Presenta-tion of the telescope and the collimator for radioactive gamma-ray sources inside the climatic chamber. The telescope is placed in a black box not shown in this diagram.
Figure 2.2: Photograph of the BB7 DSSSD test bench around PACI preamplifiers. The detector is mounted in the lower left corner of the electronic readout card. A copper cooling circuit provides temperature control of the preamplifiers.
conditions for the DSSSDs (low leakage current at low temperatures), closer to the expected conditions in space and the upper atmosphere.
2.2.1 Tracker
For the main element of the ACT prototype’s tracker, the team studied the spectral response of the DSSSD BB7 version 2 of Micron Semiconductor Ltd, which is a detector of 64⇥64 mm2
area, 1.5 mm thickness, and 32⇥32 strips. Initial tests showed that this detector has the ability to detect low energy deposits. To optimize the electromagnetic compatibility of the detection device, a first test bench, shown on Figure 2.2, was designed and constructed. The bench is dedicated to the reading of DSSSDs around a conventional analog electronics readout. This task required the realization of electronic cards around the PACI (charge preamplifier with additional current output) preamplifiers previously developed at IPNO (Hamrita et al., 2004).