INFLAMMATORY DISORDERS
Fluorescein and indocyanine-green angiography in ocular
syphilis: an exploratory study
Konstantinos Balaskas&Theodoros N. Sergentanis&
Stefano Giulieri&Yan Guex-Crosier
Received: 14 June 2011 / Revised: 27 November 2011 / Accepted: 30 November 2011 / Published online: 25 December 2011 # Springer-Verlag 2011
Abstract
Background Fluorescein (FA) and indocyanine-green angi-ography (ICGA) may offer valuable information concerning disease severity and prognosis in ocular syphilis. The aim of the present study is to describe angiographic patterns en-countered in the context of ocular syphilis, and to explore the associations between specific angiographic manifesta-tions and severity of disease presentation, as well as disease evolution after treatment.
Methods We performed a retrospective institutional study with the inclusion of 23 patients with ocular syphilis pre-senting to the uveitis clinic of the Jules-Gonin Eye Hospital in a 10-year period. FA and ICGA were performed following a standard protocol for posterior uveitis. Patterns of fluores-cence were noted, and statistical associations between each angiographic pattern and any demographic, clinical, or lab-oratory parameter at baseline and after treatment were sought.
Results The presence of any dark dots in ICGA was signif-icantly associated with anterior uveitis (p00.031). The
presence of hot spots in ICGA was significantly associated with longer duration of symptoms prior to initial visit (p0 0.032) and with male gender (p00.012). Weak non-significant trends were found associating vascular staining in FA with anterior uveitis (p00.066), vitritis (p00.069), and younger age (p00.061), as well as disc hyperfluorescence in FA with seropositivity for HIV (p00.089) and macular edema in FA with longer disease duration (p00.061). The presence of any dark dots in ICGA exhibited a weak trend of association with anterior uveitis and/or vitritis (p00.079). Conclusions Out of the several associations identified im-plicating specific angiographic features, we underline the possible role of the presence of dark dots in ICGA for identifying active inflammation, and the role of hot spots in ICGA as markers of long-standing disease. Vascular staining in FA appears to be more common in patients with severe ocular inflammation with presence of anterior uveitis and/or vitritis.
Keywords Ocular syphilis . Fluorescein angiography . Indocyanine-green angiogrpahy
Introduction
Ocular involvement in the context of syphilitic infection presents certain particularities stemming from the close an-atomic proximity of the eye to the central nervous system. Ocular syphilis is therefore classified as a variant of neuro-syphilis, irrespective of compatible findings in the cerebro-spinal fluid. The classical description of the clinical course of syphilitic infection in three consecutive stages is less relevant in the presence of ocular involvement, as reflected in the Centers for Disease Control (CDC) guidelines for the management of syphilis that prompt clinicians to treat all
No financial support or funding was received in support of this study K. Balaskas
:
Y. Guex-Crosier (*)Jules-Gonin Eye Hospital, University of Lausanne, Av. de France 15,
CH-1004, Lausanne, Switzerland e-mail: [email protected] T. N. Sergentanis
Department of Epidemiology and Biostatistics, Medical School, University of Athens,
Athens, Greece S. Giulieri
Department of Infectious Diseases, Centre Hospitalier Universitaire Vaudois, Lausanne, Switzerland
cases of ocular syphilitic infection as neurosyphilis [1]. The value of laboratory investigations in determining disease severity and prognosis in ocular syphilis is limited. Al-though serum VDRL titers are considered appropriate for evaluating disease activity and response to treatment in syphilis, this is less clear in the context of ocular involve-ment, which is most common in the secondary, but also in the tertiary stage of the disease, when VDRL serology is almost invariably negative. Active and potentially debilitat-ing ocular disease can therefore be accompanied by negative non-treponemal serology for syphilis [2]. Further laboratory investigations would therefore be needed to offer clues as regards disease severity and prognosis. The role of angiog-raphy in determining disease severity and in predicting disease evolution after treatment has not been adequately studied in ocular syphilis.
Fluorescein angiography (FA) has been extensively used for the evaluation of ocular inflammation in the context of posterior uveitis [3–5]. As fluorescein sodium fluoresces in the wavelengths of visible light, its value is mostly limited in revealing pathology of the superficial structures of the fundus [6]. Indocyanine-green (ICG), on the other hand, fluoresces on the infrared spectrum, giving access to the choroidal compart-ment through the retinal pigcompart-ment epithelium. ICG leaks un-impaired from fenestrated choriocapillaris, albeit slowly, gradually impregnating choroidal tissue and giving rise to intermediate and late choroidal background fluorescence in the course of the angiogram. This fluorescence and its distur-bance from choroidal inflammatory lesions are the main com-ponents studied in ICG angiography (ICGA) performed for posterior granulomatous uveitis [7–9].
FA manifestations of ocular syphilis have been reported in previous publications, identifying non-specific patterns of retinal inflammation, such as retinal and vascular staining, capillary leakage, macular edema, and optic disc hyperfluor-escence [3–5]. A pattern unique to the disease has been described by Gass [10], corresponding to the entity named syphilitic posterior placoid chorioretinitis. ICGA patterns in ocular syphilis have been described in a case series by Mora et al., emphasizing the presence of late scattered hyperfluor-escence as characteristic to the disease [11].
The purpose of the present study is to describe angio-graphic patterns in ocular syphilis both in fluorescein and ICG angiography, and to look for meaningful associations between specific angiographic findings and any baseline demographic or clinical parameter, as well as disease evo-lution after treatment and probability for relapse.
Methods
We retrospectively reviewed the charts of 26 patients with ocular inflammation and a positive treponemal serologic test
for syphilis presenting to the Uveitis department of the Jules-Gonin Eye Hospital in the period between January 1999 and December 2009. Inclusion criteria for this study were signs of uveitis compatible with ocular syphilis on clinical evaluation, together with a positive TPHA or FTA-Abs test. Medical history and serology for each patient were discussed with an infectious disease spe-cialist (SG), in order to ascertain diagnosis of syphilis and determine stage of disease progression. All patients were followed by the same uveitis specialist (YGC), and according to official recommendations laid down for the management of ocular syphilis [1]. Treatment consisted of either a standard regimen of intravenous penicillin for neurosyphilis at a dose of 6 × 4 MO IU per day for 14 days, or an alternative regimen of intravenous cef-triaxone at a dose of 2 gr per day for 14 days. Inclusion criteria, clinical and laboratory evaluations, and manage-ment are extensively discussed in a previous publica-tion. Associations drawn from the same study sample as regards disease severity at baseline and disease evolu-tion after treatment have also been previously reported [12]. Out of the 26 patients, three refused to enter into the proposed follow-up including fluorescein and ICG angiography, lumbar puncture, and visual field assess-ment. Twenty-three patients underwent dual fluorescein and ICG angiography following a standard protocol for the evaluation of posterior uveitis at the moment of disease diagnosis [13]. The same angiographic evaluation was per-formed after the completion of a treatment cycle for ocular syphilis in 17 patients.
As angiography constitutes an examination not readily quantifiable in clinical practice, and its interpretation remains to a large extent descriptive, we employed a qualitative ap-proach to the recording of angiographic findings, noting the presence or absence of each characteristic pattern, but not its extent. This was mainly done in order to proceed to a concise, parsimonious statistical analysis of angiographic findings, given the small study sample.
Recorded angiographic patterns in FA included macular edema, disc hyperfluorescence, retinal staining, vascular staining, retinal ischemia, pinpoint leakage, mask effect from preretinal hemorrhage, window defects, and fluoresce-in leakage from choroidal or retfluoresce-inal neovascularization.
Recorded angiographic patterns in ICGA included: (1) persistent dark dots, defined as diversely sized hypofluor-escent areas already present in the early and intermediate phases of the angiogram and remaining hypofluorescent in the late phase, (2) vanishing dark dots, different in that they became isofluorescent in the late phase of the angiogram, and (3) atrophic dark dots, a sub-variant of persistent dark dots remaining unaltered in subsequent angiograms after proper antibiotic treatment. Other noted angiographic features included hot spots, defined as scattered hyperfluorescent foci
in the posterior pole or the mid-periphery in late angiographic frames, and fuzzy choroidal vessels observed in the interme-diate phase of the angiogram.
With regard to statistical analysis of observed angio-graphic patterns, the following angioangio-graphic features were set as main factors in a series of univariate comparisons: retinal staining, vascular staining, disc hyperfluorescence, and macular edema in FA, as well as the presence of any dark dots and hot spots in ICGA. More specifically, the associations between the main factors and all registered demographic, clinical or laboratory parameters (ten in total) at baseline were thoroughly assessed. The aforementioned parameters included gender, age at diagnosis, unilateral or bilateral involvement, HIV status, duration of symptoms prior to initial visit, pain as a calling sign, anterior uveitis, vitritis, optic nerve involvement [as evidenced by a relative afferent pupillary defect (RAPD), and/or optic disc swell-ing], and relapse of inflammation after treatment. A further parameter, constituting an indicator of active ocular inflam-mation, was examined against all registered angiographic manifestations; the presence of anterior uveitis and/or vitritis vs the absence of both.
Inter-eye correlations implicating specific angiographic manifestations in cases with bilateral disease involvement were calculated in order to identify the degree of symmetry in FA and ICGA of ocular syphilis with bilateral involve-ment. Associations among the various angiographic mani-festations both in FA and in ICGA were also sought.
Pearson’s chi-square, Fisher’s exact test and the Mann– Whitney–Wilcoxon test for independent samples (MWW) were appropriately applied in the light of deviation from normality (as evidenced from Kolmogorov–Smirnov and Shapiro–Wilk tests). With regard to continuous variables, median values and inter-quartile ranges are reported given the nonparametric statistical approach adopted. The level of statistical significance was set to 5%. A patient-based anal-ysis was performed in order to circumvent the potential inter-eye correlation in cases with bilateral involvement; the presence of any specific angiographic manifestation in any particular patient was only included once in the analysis irrespective of unilateral or bilateral involvement, thus elim-inating the effect of inter-eye correlation. In simple terms, at the patient-based analysis, each patient was deemed positive regarding an angiographic manifestation when one or both eyes had exhibited the respective manifestation. Neverthe-less, an alternative eye-based analysis was also performed, and is thoroughly presented in the Appendix, ensuring a comprehensive approach to available data. Given the ex-ploratory nature of the present study, no adjustment of the significance level to account for multiple statistical compar-isons was deemed to be warranted. Taking into account the small sample size, no multivariate analysis was performed. Observed associations may therefore be prone to mutual
confounding which cannot be further investigated by multi-variate analysis in the context of this study. Statistical anal-ysis was performed with STATA 8.0 statistical software (Stata Corporation, College Station, TX, USA).
Institutional Review Board (IRB)/ Ethics Committee ap-proval of the University of Lausanne was obtained. De-scribed research adhered to the tenets of the Declaration of Helsinki.
Results
Simultaneous fluorescein and ICG angiography were per-formed in 23 patients (39 eyes) at presentation, following a standard angiographic protocol for the evaluation of poste-rior uveitis. The most frequent patterns of fluorescence in FA and ICGA are presented in Table 1. The features most frequently observed in FA were retinal staining of focal punctate retinal lesions (43.5%), followed by staining of retinal vessels, mainly veins (30.4%) and disc hyperfluor-escence (30.4%) (Fig.1). Four patients presented a particu-lar angiographic pattern consisting of hypofluorescent foci corresponding to the presence of chorioretinal scars, sur-rounded by hyperfluorescent areas in the late phase, an aspect compatible with syphilitic posterior placoid chorior-etinitis. ICGA features could be classified into three main patterns. The first pattern consisted of hypofluorescent cho-roidal lesions, visible from the early and intermediate phases of the angiogram onwards, which either became isofluores-cent in the late phases, or remained hypofluoresisofluores-cent. These lesions, also referred to as dark dots, varied considerably in size, number and localisation, sharing the common charac-teristic of being invisible in fluorescein angiography or
Table 1 Findings in fluorescein and indocyanine-green angiography (n023 and 22 patients respectively)
N (%) Findings in fluoroangiography (n023)
Disc hyperfluorescence 7 (30.4)
Macular edema 4 (17.4)
Vascular staining 7 (30.4)
Retinal staining and/or capillary leakage 10 (43.5)
Retinal ischemia 2 (8.7)
Normal 2 (8.7)
Findings in ICGA (n022)
Dark dots 13 (59.1)
Persistent dark dots exclusively 3 (13.6) Persistent and vanishing dark dots 10 (45.5)
Hot spots 11 (50.0)
Fuzzy choroidal vessels 5 (14.7)
fundoscopy, and were observed in 13 patients (59.1%) (Fig. 2). The second pattern corresponded to scattered hyperfluorescent spots (hot spots) appearing in the late phases of the angiogram, in the mid-periphery and/or the posterior pole present in 11 patients (50%). The third pattern was fuzzy choroidal vessels with leakage from the interme-diate phase of the angiogram onwards in five patients (14.7%). In 13.6% of patients, the persistent variant of dark dots that remained unaltered in the late frames of the angio-gram was observed, while 45.5% of patients presented both persistent and vanishing dark dots, the latter becoming iso-fluorescent in late frames. Seventeen patients were submitted to the same angiographic investigations after the completion of an antibiotic treatment regimen for neurosyphilis. Where comparison was possible, in FA vascular staining disappeared after treatment in five out of seven cases (71.4%), disc hyper-fluorescence in five out of seven cases (71.4%), and retinal
staining in four out of ten cases (40%). In ICGA, three cases of persistent dark dots remaining unaltered in size after treat-ment, corresponding to chorioretinal scars, were identified. Hot spots disappeared in almost every case after treatment (9 out of 11 patients, 82%) (Fig.3).
Out of the 23 patients, 13 had inflammatory signs evidenced by the presence of anterior uveitis and/or vitritis, whereas ten did not. Out of the latter patients, six had concomitant optic nerve involvement, two had posterior placoid chorioretinitis, three had retinal staining in FA, and only one had vascular staining, whereas no patient without anterior uveitis and/or vitritis presented with macular ede-ma. With regard to dark dots, which were more common in eyes with anterior uveitis and/or vitritis though not in a statistically significant way, they were present in all four cases that presented relapse of inflammation after proper antibiotic treatment.
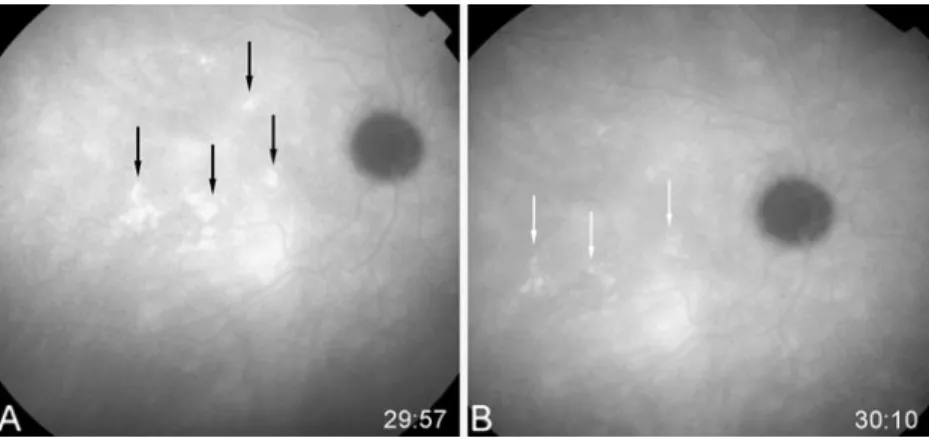
Fig. 1 a Fundus photograph depicting snowballs in the vitreous. b, d Extensive central and peripheral retinal staining and/or capillary leakage in FA. c Foci of peripheral retinal vascular staining in FA
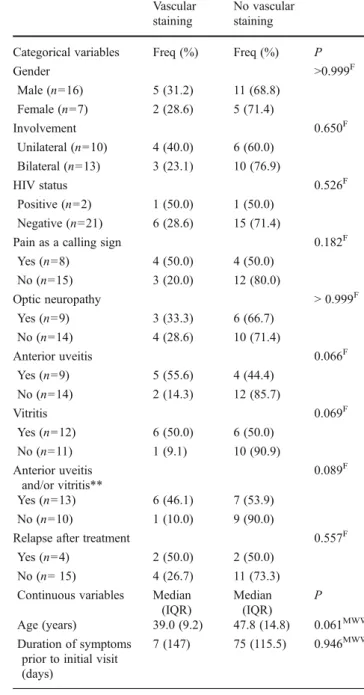
Fig. 2 a Fundus photograph depicting normal retina. b FA of the same case revealing minimal retinal staining. c ICGA of the same case revealing extensive dark dots and some hot spots, invisible on both fundus photograph and FA
Associations among the various angiographic manifesta-tions in FA and ICGA are presented in the triangular Table2. It is obvious that no significant associations could be iden-tified, other than a weak trend implicating vascular staining and macular edema in FA (p00.067, Fisher’s exact test), though not reaching statistical significance.
Associations between the two most frequent angiograph-ic manifestations in FA, retinal staining and vascular stain-ing, and all registered baseline factors are presented in Tables 3 and 4 respectively. With regard to associations implicating specific angiographic features, vascular staining in FA exhibited a weak trend of association with vitritis (6/ 12 patients with vitritis also exhibited vascular staining in FA, whereas only 1/11 patients without vitritis exhibited vascular staining, p00.069, Fisher’s exact test), anterior uve-itis (5/9 patients with anterior uveuve-itis presented with vascular staining vs 2/14 patients without anterior uveitis, p00.066, Fisher’s exact test) and younger age at presentation [39.0 years (inter-quartile range (IQR) 9.2] for patients with vascular staining vs 47.8 (IQR 14.8) for those without, p00.061, Mann–Whitney–Wilcoxon test), though none of the associa-tions reached statistical significance. A strong association between presence of anterior uveitis and presence of vitritis was also identified (p00.015, Fisher’s exact test). The associ-ation between vascular staining in fluorescein angiography with worse visual acuity at baseline did not reach formal statistical significance (p00.072, MWW), though there was a significant association with improvement in visual acuity after treatment (p00.005), as exhaustively described in a
previous publication [12]. There was a weak trend of associ-ation between disc hyperfluorescence in FA and seropositivity for HIV infection (2/2 patients with HIV also exhibited disc hyperfluorescence vs only 5/21 patients without HIV infec-tion, p00.083, Fisher’s exact test) as well as between macular edema in FA and longer disease duration prior to initial presentation [225 days (IQR 122) for patients with macular edema vs 12 (IQR 23) for patients without macular edema, p0 0.061, MWW], though the associations did not reach statisti-cal significance. As expected, disc hyperfluorescence was significantly associated with optic nerve involvement (p< 0.001). All other associations implicating specific FA mani-festations were non-significant.
Associations between the presence of any dark dots in ICGA and any other parameter are presented in Table5. The presence of any dark dots was significantly associated with anterior uveitis (p00.031, Fisher’s), while dark dots were more common in patients with anterior uveitis and/or vitritis (p00.079, Fisher’s). The presence of any hot spots in ICGA was associated with male gender (p00.012, Fisher’s) and longer duration of symptoms prior to initial visit (p00.032, MWW), as can be seen in Table6. The former association remained significant even after the exclusion of patients positive for HIV infection (p00.008, Fisher’s). There was, however, no association between hot spots and any sign of active ocular inflammation.
In cases with bilateral disease, angiographic manifesta-tions strongly correlated between fellow eyes as follows: retinal staining (rho00.854, p00.005), vascular staining
Fig. 3 a ICGA revealing hot spots. b Disappearance of hot spots after treatment
Table 2 Associations between the various angiographic manifestations in FA and ICGA
Retinal staining Vascular staining Disc hyperfluorescence Macular edema Dark dots Hot spots Retinal staining — Vascular staining 0.405 — Disc hyperfluorescence 0.405 >0.999 — Macular edema 0.104 0.067 0.557 — Dark dots 0.674 0.648 0.648 0.616 — Hot spots >0.999 >0.999 >0.999 >0.999 >0.999 —
(rho00.779, p00.038), macular edema (rho00.779, p0 0.038), dark dots (rho00.810, p00.024),and hot spots (rho00.837, p00.010). Disc hyperfluorescence did not ex-hibit a significant correlation in cases with bilateral disease (rho00.426, p00.203), with rho values corresponding to Pearson’s correlation coefficient and p-values deriving from Fisher’s exact test. In the eye-based analysis, a shift was observed of some statistically non-significant results to-wards statistical significance, as is thoroughly presented in
theAppendix.
Discussion
We conducted this exploratory study in search of associations between specific angiographic manifestations and several baseline demographic, clinical, or laboratory parameters. As regards the associations implicating specific angiographic manifestations in FA, only the one between vascular staining and improvement in visual acuity after treatment reached formal statistical significance. Several weak trends of associ-ation were, however, highlighted in this analysis, specifically
Table 3 Variables associated with retinal staining (patient-based anal-ysis). Percentages are given with 100% corresponding to each row
Retinal staining
No retinal staining Categorical variables Freq (%) Freq (%) P
Gender >0.999F Male (n016) 7 (43.8) 9 (56.3) Female (n07) 3 (42.9) 4 (57.1) Involvement 0.402F Unilateral (n010) 3 (30.0) 7 (70.0) Bilateral (n013) 7 (53.9) 6 (46.2) HIV status 0.486F Positive (n02) 0 (0.0) 2 (100.0) Negative (n021) 10 (47.6) 11 (52.4)
Pain as a calling sign 0.074F Yes (n08) 1 (12.5) 7 (87.5) No (n015) 9 (60.0) 6 (40.0) Optic neuropathy > 0.999F Yes (n09) 4 (44.4) 5 (55.6) No (n014) 6 (42.9) 8 (57.1) Anterior uveitis >0.999F Yes (n09) 4 (44.4) 5 (55.6) No (n014) 6 (42.9) 8 (57.1) Vitritis 0.214F Yes (n012) 7 (58.3) 5 (41.7) No (n011) 3 (27.3) 8 (72.7) Anterior uveitis and/or vitritis** 0.402F Yes (n013) 7 (53.9) 6 (46.1) No (n010) 3 (30.0) 6 (70.0)
Relapse after treatment 0.582F Yes (n04) 1 (25.0) 3 (75.0)
No (n015) 8 (53.3) 7 (46.7) Continuous variables Median
(IQR) Median (IQR) P Age (years) 43.0 (11.5) 47.6 (11.8) 0.385MWW Duration of symptoms
prior to initial visit (days)
36 (87) 90 (146) 0.755MWW
F
Fisher's exact test
MWW Mann–Whitney–Wilcoxon test
Table 4 Variables associated with vascular staining (patient-based analysis). Percentages are given with 100% corresponding to each row
Vascular staining
No vascular staining Categorical variables Freq (%) Freq (%) P
Gender >0.999F Male (n016) 5 (31.2) 11 (68.8) Female (n07) 2 (28.6) 5 (71.4) Involvement 0.650F Unilateral (n010) 4 (40.0) 6 (60.0) Bilateral (n013) 3 (23.1) 10 (76.9) HIV status 0.526F Positive (n02) 1 (50.0) 1 (50.0) Negative (n021) 6 (28.6) 15 (71.4)
Pain as a calling sign 0.182F Yes (n08) 4 (50.0) 4 (50.0) No (n015) 3 (20.0) 12 (80.0) Optic neuropathy > 0.999F Yes (n09) 3 (33.3) 6 (66.7) No (n014) 4 (28.6) 10 (71.4) Anterior uveitis 0.066F Yes (n09) 5 (55.6) 4 (44.4) No (n014) 2 (14.3) 12 (85.7) Vitritis 0.069F Yes (n012) 6 (50.0) 6 (50.0) No (n011) 1 (9.1) 10 (90.9) Anterior uveitis and/or vitritis** 0.089F Yes (n013) 6 (46.1) 7 (53.9) No (n010) 1 (10.0) 9 (90.0)
Relapse after treatment 0.557F Yes (n04) 2 (50.0) 2 (50.0)
No (n0 15) 4 (26.7) 11 (73.3) Continuous variables Median
(IQR) Median (IQR) P Age (years) 39.0 (9.2) 47.8 (14.8) 0.061MWW Duration of symptoms
prior to initial visit (days)
7 (147) 75 (115.5) 0.946MWW
F
Fisher's exact test
between vascular staining and anterior uveitis, vitritis, anterior uveitis and/or vitritis, worse visual acuity at presentation, and younger age at presentation, as well as between disc hyper-fluorescence and seropositivity for HIV and between macular edema and longer disease duration prior to the initial visit. The findings implicating vascular staining may point to a close association between these markers of active inflammation, indicating that eyes with vascular staining are more severely inflamed, which in turn may account for the weak trend towards worse BCVA at baseline in these patients. As
evidenced in our previous study, improvement in visual acuity after treatment was significantly associated with presence of vascular staining in FA, underlining the reversible nature of this type of ocular inflammatory reaction in the context of ocular syphilis [12]. The high rate of disappearance of vascu-lar staining in FA performed after treatment points to the same conclusion, indicating that vasculitis is not accompanied by permanent visual repercussions in ocular syphilis, when prop-erly treated. The fact that all patients with HIV seropositivity
Table 5 Variables associated with dark dots (patient-based analysis). Percentages are given with 100% corresponding to each row
Dark dots No dark dots
Categorical variables Freq (%) Freq (%) P
Gender >0.999F Male (n0 16) 9 (56.3) 7 (43.7) Female (n06) 4 (66.7) 2 (33.3) Involvement 0.192F Unilateral (n0 10) 4 (40.0) 6 (60.0) Bilateral (n0 12) 9 (75.0) 3 (25.0) HIV status >0.999F Positive (n0 2) 1 (50.0) 1 (50.0) Negative (n020) 12 (60.0) 8 (40.0)
Pain as a calling sign >0.999F Yes (n08) 5 (62.5) 3 (37.5) No (n014) 8 (57.1) 6 (42.9) Optic neuropathy 0.674F Yes (n09) 6 (66.7) 3 (33.3) No (n013) 7 (53.9) 6 (46.1) Anterior uveitis 0.031F Yes (n09) 8 (88.9) 1 (11.1) No (n013) 5 (38.5) 8 (61.5) Vitritis 0.192F Yes (n012) 9 (75.0) 3 (25.0) No (n010) 4 (40.0) 6 (60.0) Anterior uveitis and/or vitritis** 0.079F Yes (n0 13) 10 (76.9) 3 (23.1) No (n09) 3 (33.3) 6 (66.7)
Relapse after treatment 0.245F Yes (n04) 4 (100.0) 0 (0.0)
No (n015) 8 (53.3) 7 (46.7) Continuous variables Median
(IQR) Median (IQR) P Age (years) 45.1 (9.1) 42.2 (11.8) 0.867MWW Duration of symptoms
prior to initial visit (days)
12 (147) 90 (83) 0.867MWW
F
Fisher's exact test
MWW Mann–Whitney–Wilcoxon test
Table 6 Variables associated with hot spots (patient-based analysis). Percentages are given with 100% corresponding to each row
Hot Spots No Hot Spots
Categorical variables Freq(%) Freq(%) p
Gender* 0.012F Male (n016) 11 (68.8) 5 (31.2) Female (n06) 0 (0.0) 6 (100.0) Involvement 0.670F Unilateral (n010) 6 (60.0) 4 (40.0) Bilateral (n012) 5 (41.7) 7 (58.3) HIV status 0.476F Positive (n02) 0 (0.0) 2 (100.0) Negative (n020) 11 (55.0) 9 (45.0)
Pain as a calling sign 0.659F Yes (n08) 3 (37.5) 5 (62.5) No (n014) 8 (57.1) 6 (42.9) Optic neuropathy > 0.999F Yes (n09) 4 (44.4) 5 (55.6) No (n013) 7 (53.9) 6 (46.1) Anterior uveitis >0.999F Yes (n09) 4 (44.4) 5 (55.6) No (n013) 7 (53.9) 6 (46.1) Vitritis 0.670F Yes (n012) 7 (58.3) 5 (41.7) No (n010) 4 (40.0) 6 (60.0) Anterior uveitis and/or vitritis** 0.387F Yes (n013) 8 (61.5) 5 (38.5) No (n09) 3 (33.3) 6 (66.7)
Relapse after treatment 0.582F Yes (n04) 1 (25.0) 3 (75.0)
No (n015) 8 (53.3) 7 (46.7) Continuous variables Median
(IQR) Median (IQR) P Age (years) 39.0 (18.4) 45.1 (8.9) 0.376MWW Duration of symptoms
prior to initial visit (days)
90 (210) 7 (59) 0.032MWW
* After the exclusion of patients with HIV infection, the association persists (11/15 males vs 0/5 females exhibit hot spots in ICG, p00.008)
F Fisher's exact test
exhibited disc hyperfluorescence in FA, illustrates a probable previously unrecognised site of preferential posterior involve-ment of ocular syphilis in the context of HIV co-infection. The potential increased prevalence of macular edema in patients with longer duration of intra-ocular inflammation has been suspected in uveitis [14], and may point to a deleterious effect of persistent inflammatory stimuli, leading to gradual accu-mulation of intraretinal fluid in the macular area. The aspect of “leopard spots” in fluorescein angiography described by Gass [10] in the context of syphilitic posterior placoid chorioretinitis as being highly indicative of syphilitic infection was also observed in four patients in our series. Interestingly, patients without anterior uveitis and/or vitritis mainly presented with optic nerve involvement, and to a lesser extent posterior placoid chorioretinitis and retinal staining, though only one such patient exhibited vascular staining, and none had macular edema.
Similar patterns in ICGA to those observed in our series have been described in other forms of granulomatous pos-terior uveitis, such as sarcoidosis and tuberculosis [15,16], and are not unique to ocular syphilis. Probable interpreta-tions for the above mentioned patterns are atrophy, fibrosis, or full-thickness granuloma for persistent dark dots, partial thickness granuloma or delayed perfusion of choriocapillaris for vanishing dark dots, and choroidal vasculitis for fuzzy choroidal vessels. Dark dots have also been described in ocular sarcoidosis and ocular tuberculosis, the latter alleg-edly being associated with more extensive and more conflu-ent lesions [17]. Our study revealed a significant association between presence of dark dots and anterior uveitis, and a weak trend of association with presence of anterior uveitis and/or vitritis. It should be emphasized that there was a strong association between the presence of anterior uveitis and the presence of vitritis, prompting us to introduce a combined parameter implicating both inflammatory indica-tors and to test all baseline facindica-tors against this parameter as well. Dark dots were present in all four patients that exhibited relapse of inflammation after initial remission fol-lowing proper antibiotic treatment, though no statistically significant association could be drawn from such small numb-ers. We suggest that the presence of dark dots, excluding those associated with atrophy, may signify active granulomatous posterior choroidal inflammation. Due to the small sample, however, we were unable to identify the specific character-istics of dark dots, for instance size, number, and localisation, which are more evocative of active inflammation.
With regard to hot spots, although they have been observed in other granulomatous uveitis, their high prevalence in ocular syphilis could be characteristic to the disease. These features have been described in the article by Mora et al. [11], and probable proposed interpretations include fixing of ICG mole-cules on active granuloma or staining of leucocytes. These manifestations have also been alleged to indicate active disease or long-standing disease. The former assumption was not,
however, statistically confirmed in the present study. On the contrary, the lack of association between hot spots and any ocular manifestation with important functional repercussions, such as macular edema, optic neuropathy, or anterior uveitis, may reveal an exclusively choroidal origin of these angiograph-ic features. On the other hand, the identified association be-tween the presence of hot spots and a longer duration of symptoms prior to the first visit may render this angiographic finding indicative of long-standing disease. Hot spots appeared to be significantly more common in male patients. This asso-ciation, though persisting even after the exclusion of patients with HIV co-infection, was rather more difficult to interpret.
Surprisingly, no association could be identified between various angiographic manifestations both in FA and ICGA, other than a weak positive trend implicating vascular staining and macular edema. Although both vascular staining in FA and dark dots in ICGA appear to be more common in eyes with anterior uveitis and/or vitritis, they do not seem to co-exist in the same eye. This observation, in conjunction with the absence of any other association between ICGA findings and any clinical parameter indicative of retinal inflammation such as retinal staining or macular edema, could justify the speculation of two morphologically and angiographically dis-tinct patterns of syphilitic eye disease, namely a predominant-ly choroidal versus a predominantpredominant-ly retinal variant.
Inter-eye correlation of angiographic manifestations in case of bilateral disease involvement appears significant and strong as regards all main factors apart from disc hyper-fluorescence. This analysis makes it possible to provide useful insight into the degree of correlation of angiographic findings between fellow eyes in bilateral ocular syphilis, which has not so far been reported. Given the high degree of inter-eye correlation of angiographic manifestations iden-tified, the use of a patient-based analysis becomes even more appropriate in the context of the present study.
This study has certain limitations stemming mainly from its retrospective design and the small study sample. A further shortcoming lies in the loss of six patients to follow-up with regard to angiographic evaluation after treatment, further lim-iting our ability to assess the effect of treatment on observed angiographic patterns. It should also be emphasized that given the small study sample, multivariate analysis could not be performed so as to avoid over-interpretation of available data. Observed associations may therefore be prone to mutual con-founding, and their independence may not be warranted.
We conclude, based on our findings, that angiographic investigation in ocular syphilis can offer valuable informa-tion concerning disease severity and durainforma-tion, and can even contribute some clues to disease prognosis. Vascular stain-ing in FA and dark dots in ICGA appear to be more common in more severely inflamed eyes with anterior uveitis and/or vitritis, whereas hot spots are more often present in patients with long-standing disease without other signs of severe
inflammation. Two variants of the disease, one with predom-inantly choroidal involvement and one predompredom-inantly retinal, could be hypothesized. In view, however, of the exploratory nature of the current study and the above-mentioned limita-tions, further corroborative studies are required to confirm our findings. Nevertheless, some earlier arbitrary hypotheses concerning the significance of specific angiographic features in granulomatous posterior uveitis were for the first time statistically investigated in the present study.
Acknowledgments This article was the object of an oral presentation entitled“Angiographic patterns in ocular syphilis” at the EVER 2010 Congress held in Crete, Greece between 6 and 9 October 2010
We particularly thank Catherine Guex-Crosier for her valuable contribution to data collection and management.
Appendix
An eye-based analysis of registered data was performed in the service of comprehensiveness and in an attempt to exploit all available data. Angiographic manifestations en-countered in FA and ICGA on an eye basis are presented in Table 7. With regard to associations implicating specific angiographic features, vascular staining in FA exhibited a statistically significant association with vitritis (8/19 eyes with vitritis also exhibited vascular staining in FA, whereas only 1/17 eyes without vitritis exhibited vascular staining, p00.020), anterior uveitis (7/15 eyes with anterior uveitis presented with vascular staining vs 2/21 eyes without anterior uveitis, p00.019) and a weak trend implicating macular edema (4/8 eyes with macular oedema vs 5/28 eyes without macular edema exhibited vascular staining, p00.086), with p-values derived from Fisher’s exact test. The association between
vascular staining in fluorescein angiography with worse visual acuity at baseline did not reach formal statistical significance (p00.072, MWW), though there was a significant association with improvement in visual acuity after treatment (p00.005), as exhaustively described in a previous publication [12]. Disc hyperfluorescence in FA was significantly associated with se-ropositivity for HIV infection (3/3 eyes with HIValso exhibited disc hyperfluorescence vs only 6/33 eyes without HIV infec-tion, p00.012, Fisher’s exact test).
Associations between the presence of any dark dots in ICGA and any other parameter are presented in Table8. The presence of any dark dots was significantly associated with
Table 7 Findings in fluorescein and indocyanine-green angiography (n039 eyes) N (%) Findings in fluoroangiography (n036) Disc hyperfluorescence 9 (25.0) Macular edema 5 (13.9) Vascular staining 9 (25.0)
Retinal staining and/or capillary leakage 15 (41.7)
Retinal ischemia 3 (6.5)
Normal 3 (6.5)
Findings in ICGA (n034)
Dark dots 21 (61.8)
Persistent dark dots 4 (11.8)
Persistent and vanishing dark dots 17 (50.0)
Hot spots 15 (44.1)
Fuzzy choroidal vessels 5 (14.7)
Normal 3 (8.8)
Table 8 Variables associated with dark dots (eye-based analysis). Percentages are given with 100% corresponding to each row
Dark dots No dark dots Categorical variables Freq(%) Freq(%) P
Anterior uveitis 0.013F Yes (n015) 13 (86.7) 2 (13.3) No (n019) 8 (42.1) 11 (57.9) Vitritis 0.034F Yes (n019) 15 (79.0) 4 (21.0) No (n015) 6 (40.0) 9 (60.0) Vascular staining in FA 0.427F Yes (n09) 7 (77.8) 2 (22.2) No (n025) 14 (56.0) 11 (44.0)
Relapse after treatment 0.066F
Yes (n07) 7 (100.0) 0 (0.0) No (n024) 14 (58.3) 10 (41.7)
Fp-value derived from Fisher’s exact test
Table 9 Variables associated with hot spots (eye-based analysis). Percentages are given with 100% corresponding to each row
Hot spots No hot spots
Categorical variables Freq (%) Freq (%) P
Gender <0.001F Male (n023) 15 (65.2) 8 (34.8) Female (n011) 0 (0.0) 11 (100.0) Relapse 0.201F Yes (n07) 1 (14.3) 6 (85.7) No (n024) 11 (45.8) 13 (54.2) Continuous variables Median
(IQR)
Median (IQR)
P Duration of symptoms
prior to initial visit (days)
7 (149) 120 (210) 0.007MWW
F
p-value derived from Fisher’s exact test;MWWp-value derived from Mann–Whitney–Wilcoxon test for independent samples; IQR: inter-quartile range
anterior uveitis (p00.013), vitritis (p00.034), while dark dots were observed in all seven eyes with relapse of inflam-mation after proper antibiotic treatment (p00.066). The presence of any hot spots in ICGA was associated with male gender (p<0.001) and longer duration of symptoms prior to initial visit (p00.007), as can be seen in Table9. There was, however, no association with relapse of inflammation after treatment (p00.201).
References
1. Workowski KA, Berman S (2006) Sexually transmitted disease treatment guidelines. MMWR Morb Mortal Wkly Rep 55:22–26 2. Browning DJ (2000) Posterior segment manifestations of active
ocular syphilis, their response to a neurosyphilis regimen of pen-icillin therapy, and the influence of human immunodeficiency virus status on response. Ophthalmology 107:2015–2023 3. Sudharshan S, Ganesh SK, Biswas J (2010) Current approach in
the diagnosis and management of posterior uveitis. Indian J Oph-thalmol 58:29–43
4. Tan-Yaycioglu R, Akova YA, Akca S, Yilmaz G (2006) Inflamma-tion of the posterior uvea: findings on fundus fluorescein and indoc-yanine green angiography. Ocul Immunol Inflamm 14:171–179 5. De Laey JJ (1995) Fluorescein angiography in posterior uveitis. Int
Ophthalmol Clin 35:33–58
6. Patz A (1977) Principles of fluorescein angiography. Int Ophthal-mol Clin 17:1–19
7. Herbort CP, Bodaghi B, Lehoang P (2001) Indocyanine green angiog-raphy in ocular inflammatory diseases: principles, schematic interpre-tation, semiology and clinical value. J Fr Ophtalmol 24:423–447 8. Desmettre T, Devoisselle JM, Mordon S (2000) Fluorescence
properties and metabolic features of indocyanine green (ICG) as related to angiography. Surv Ophthalmol 45:15–27
9. Mordon S, Devoisselle JM, Soulie-Begu S, Desmettre T (1998) Indocyanine green: physicochemical factors affecting its fluores-cence in vivo. Microvasc Res 55:146–152
10. Gass JD, Braunstein RA, Chenoweth RG (1990) Acute syphilitic posterior placoid chorioretinitis. Ophthalmology 97:1288–1297 11. Mora P, Borruat FX, Guex-Crosier Y (2005) Indocyanine green
angiography anomalies in ocular syphilis. Retina 25:171–181 12. Balaskas K, Sergentanis NT, Giulieri S, Guex-Crosier Y (2011)
Analysis of significant factors influencing visual acuity in ocular syphilis. Br J Ophthalmol 96(11):1568–1572
13. Herbort CP, Lehoang P, Guex-Crosier Y (1998) Schematic interpre-tation of indocyanine green angiography in posterior uveitis using a standard angiographic protocol. Ophthalmology 105:432–440 14. Castellano CG, Stinnett SS, Mettu PS, McCallum RM, Jaffe GJ
(2009) Retinal thickening in iridocyclitis. Am J Ophthalmol 148 (3):341–349
15. Wolfensberger TJ, Herbort CP (1999) Indocyanine green angio-graphic features in ocular sarcoidosis. Ophthalmology 106:285–289 16. Wolfensberger TJ, Piguet B, Herbort CP (1999) Indocyanine green angiographic features in tuberculous chorioretinitis. Am J Oph-thalmol 127:350–353
17. Kocak N, Saatci AO, Cingil G, Cimrin A, Ucar ES (2006) Miliary tuberculosis and bilateral multifocal choroidal involvement: place of indocyanine green angiography. Bull Soc Belge Ophtalmol 301:59–65