RESEARCH ARTICLE
Influence of High BMI on Functional Outcome
After Total Hip Arthroplasty
André Busato&Christoph Röder&
Sylvia Herren&Stefan Eggli
Received: 9 May 2007 / Accepted: 27 May 2007 / Published online: 28 March 2008 # Springer Science + Business Media, LLC 2007
Abstract
Background High body mass index (BMI) is associated with diseases of the hip joint and subsequent total hip arthroplasty (THA). Less is known about the effects of BMI on the functional postoperative status after THA in obese patients. The purpose of this study was therefore to quantify the role of high preoperative BMI on long-term pain status and functional outcome after THA.
Methods In a multi-center cohort, study data of 20,553 primary THAs (18,968 patients) and 43,562 postoperative clinical examinations were analyzed for a follow-up period of up to 15 years. Patients were classified into three BMI groups (normal weight <25 kg/m2, overweight 25 to <30 kg/m2, and obese ≥30 kg/m2), and pain status and functional outcome were compared accordingly.
Results High preoperative BMI is associated to an almost perfect dose–effect relationship with decreased ambulation during a follow-up period of 15 years, but pain relief of THA is equally efficient for all BMI groups.
Conclusion Overweight and obesity are modifiable risk factors that may warrant physicians giving recommendations to patients before or after THA, to improve postoperative functional outcome quality.
Keywords Hip replacement . Arthroplasty . Body mass index . Obesity . Outcome research
Introduction
Reducing or eliminating pain and restoring physical func-tion are the primary goals of total hip arthroplasty (THA). Knowledge of prognostic factors associated with postoper-ative outcomes is therefore an important element when surgeons are advising their patients on the risks and benefits of THA [1, 2]. Factors that can be modified either by patients or surgeons to favor better outcomes are of particu-lar interest in this context. High body weight has been associated with negative [3,4] and positive [5] outcomes of THA. However, quantitative and long-term estimates of such effects are currently lacking. The purpose of this study was to quantify the role of high preoperative body mass index (BMI), as a measure of relative body weight, on long-term pain status and functional outcome after THA.
Patients and Method
The study was designed as a cohort study based on data from the total hip registry of the Maurice E. Müller Foundation in Berne, Switzerland, and on a comparable database main-tained at the Sunnybrook and Women’s College Health Sciences Centre in Toronto, Canada. These combined data sets represent one of the largest databases with pre-, intra-, and postoperative clinical data on patients with THA. The data collection was started in 1965 and is still ongoing. Data are collected using optically readable code sheets according to the standards of the International Documentation and Evaluation System (IDES) [6]. The code sheets include information on demographics, pre- and postoperative functional status, pain levels of patients, surgical proce-dures, implant characteristics, and postoperative implant status with reference to component loosening. Additional
DOI 10.1007/s11695-007-9412-8
A. Busato
:
C. Röder (*):
S. HerrenInstitute for Evaluative Research in Orthopaedic Surgery, University of Berne, Berne, Switzerland
e-mail: [email protected] S. Eggli
Dept. of Orthopaedic Surgery, University of Berne, Inselspital, CH-3010 Berne, Switzerland
information is available on implants revised because of component failure. All data have been collected in multiple hospitals located in various countries on a voluntary basis. Baseline information of 18,968 patients older than 20 years with complete preoperative data sets regarding pain status, walking time without support, hip flexion range, and preoperative BMI were evaluated. Primary THAs were performed between 1965 and 2003 in 42 European and one Canadian hospital. Follow-up data up to postoperative year 15 totaled 43,562 postoperative clinical examinations. Bilateral THA was performed in 7.7% of all THAs. Patients with radiographic signs of loose prosthetic components, as well as revision operations, were excluded from the comparative analysis.
Preoperative BMI was calculated for all patients, based on weight and body height at admission (calculated as weight in kilograms divided by the body height in meters squared). Postoperative pain status and functional outcome was compared for BMI groups of patients classified according to National Institutes of Health (Bethesda, MD 20892, USA) as underweight: <18.5 kg/m2; normal weight: 18.5 to <25.0 kg/m2; overweight: 25.0 to <30.0; obese I: 30.0 to <35.0 kg/m2; obese II: 35.0 to <40.0 kg/m2; and as extremely obese:≥40 kg/m2. Outcomes were compared over the entire follow-up period, with formal statistical tests at years 3, 6, 9, and 12 after THA. For purposes of visuali-zation, results were also displayed graphically.
All outcome items were recorded on a ordered catego-rized scale:
– Hip pain: none, mild, moderate, severe, and intolerable. Walking time without support: >60, 31–60, 10–30, <10 min, and none. Stair climbing: normal, assisted, two feet on each step, other method, or not possible. Hip flexion range: >90, 71–90, 30–70, <30°, stiff. Difficulties putting on shoes and socks: none, slight, extreme, unable.
– Hip pain, walking time without support, and hip flexion range are mandatory fields in IDES forms; that is, forms with data missing in these fields cannot be entered into the database. Stair climbing and dif-ficulties putting on shoes/socks are not defined as
mandatory fields. Data for these indicators were therefore not always complete. Nonetheless, there were 39,519 follow-ups where stair-climbing capabil-ities were recorded. Similarly, 16,319 follow-ups provided information about the degree of difficulties with putting on shoes and socks.
For every follow-up year and for each indicator, the proportion of patients with the most favorable outcome was analyzed as a binary variable, i.e., the proportion of patients with no hip pain, with walking time without support >60 min, with hip flexion range >90°, and with capability for normal stair climbing and putting on shoes and socks in a normal way.
Statistical analysis included initial descriptive procedures for continuous data with the calculation of means with 95% confidence intervals (CI95), medians, and quartiles. Categorical data were described using proportions with CI95. Gender- and diagnosis-adjusted associations between age and BMI at THA were analyzed using linear models. For graphical comparisons of outcomes, proportions were directly standardized with reference to gender, age group, and diagnosis. Age groups were defined based on quartiles of the observed data (first quartile=58.5 years, median= 66.0 years, third quartile=73.1 years), and diagnoses were categorized, according to IDES definitions, into osteoar-thritis, dysplasia, inflammatory arosteoar-thritis, fracture, and other diagnoses (osteonecrosis, Paget’s disease, post-septic arthritis, tumors). The statistical differences of pain and functional outcomes between BMI groups were assessed, using multivariate logistic regression separately for follow-up years 3, 6, 9, and 12. The outcome variables were the proportions as described above, and the explanatory variables included BMI groups, gender, age in years at THA, diagnosis, and clinic where THA was performed. Relative risks for the best outcome across BMI groups were calculated with the normal weight group as the reference group (Table 3). Bonferroni adjustments were used to address the problem of multiple testing. Preliminary analyses of patient distribution across BMI groups indicated low frequencies in groups with extreme BMI (Table1). The BMI classification was therefore simplified for statistical
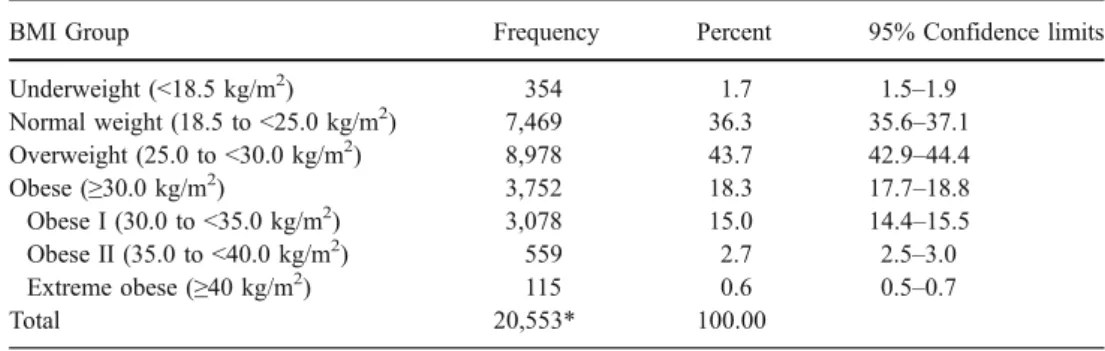
Table 1 Distribution of BMI classes at primary THA
Data derived from 18,968 patients (7.7% bilateral THA).
BMI Group Frequency Percent 95% Confidence limits
Underweight (<18.5 kg/m2) 354 1.7 1.5–1.9 Normal weight (18.5 to <25.0 kg/m2) 7,469 36.3 35.6–37.1 Overweight (25.0 to <30.0 kg/m2) 8,978 43.7 42.9–44.4 Obese (≥30.0 kg/m2 ) 3,752 18.3 17.7–18.8 Obese I (30.0 to <35.0 kg/m2) 3,078 15.0 14.4–15.5 Obese II (35.0 to <40.0 kg/m2) 559 2.7 2.5–3.0 Extreme obese (≥40 kg/m2) 115 0.6 0.5–0.7 Total 20,553* 100.00
analysis as normal weight <25 kg/m2, overweight 25 to <30 kg/m2, and obese ≥30 kg/m2. Confidence interval calculation and statistical analyses of differences accounted for nonindependence of observations in patients with bilateral THA, using the Taylor expansion method. For all statistical tests, a level of significance was set at 0.05 throughout the paper, and SAS 9.1 (SAS Institute, Inc., Cary, NC, USA) was used for all calculations.
Results
Complete preoperative data and follow-up examinations up to year 15 amounted to 64,115 records. The distribution of the initial BMI classes at THA is given in Table 1. The respective numbers of observations in each aggregated BMI group before THA and for follow-up years 3, 6, 9, and 12 are given in Tables2 and3.
A total of 10,138 female (53.5%) and 8,830 male (46.5%) patients were included in the study. The average age at THA
was 64.8 years (CI95=65.7–65.0), male patients were on average 64.1 years old (CI95 =63.9–64.3), and females were 65.5 years (CI95 =65.3–65.7). Average BMI at THA was 26.49 (CI95=26.42–26.55; median=26.2; first quartile= 23.7, third quartile=29.0). The BMI of female patients was 26.04 (CI95=25.94–26.14); the BMI of male patients was 26.99 (CI95=26.91–27.08) and significantly higher than in females. No significant difference in BMI was observed between patients with uni- and bilateral THA. The distribu-tion of the main diagnoses at THA was osteoarthritis in 76.3% of cases, dysplasia in 8.9%, inflammatory arthritis in 3.8%, fractures in 4.7%, and other diagnoses in 6.3% of cases (Table2). The gender-adjusted age at THA, calculated as least square means obtained from a linear model, was significantly decreased in obese patients for osteoarthritis, dysplasia, and inflammatory arthritis, but not for fractures (Table2). The effect of BMI on age at THA was, however, not consistent and nonlinear across diagnostic groups.
The proportions of patients without hip pain at postopera-tive years 3, 6, 9, and 12 are given in Table3. The results
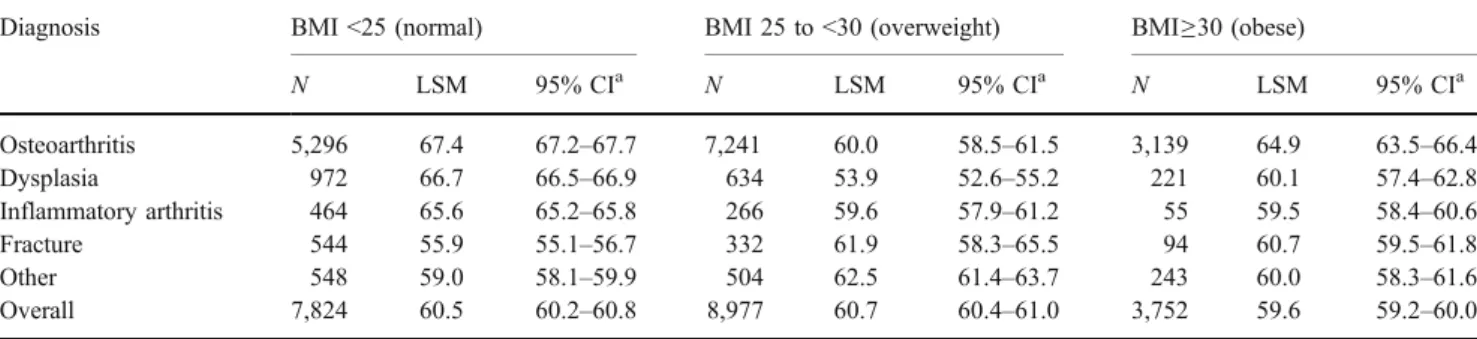
Table 2 Distribution of gender-adjusted age (least square means) in years at THA across diagnoses and BMI groups
Diagnosis BMI <25 (normal) BMI 25 to <30 (overweight) BMI≥30 (obese)
N LSM 95% CIa N LSM 95% CIa N LSM 95% CIa Osteoarthritis 5,296 67.4 67.2–67.7 7,241 60.0 58.5–61.5 3,139 64.9 63.5–66.4 Dysplasia 972 66.7 66.5–66.9 634 53.9 52.6–55.2 221 60.1 57.4–62.8 Inflammatory arthritis 464 65.6 65.2–65.8 266 59.6 57.9–61.2 55 59.5 58.4–60.6 Fracture 544 55.9 55.1–56.7 332 61.9 58.3–65.5 94 60.7 59.5–61.8 Other 548 59.0 58.1–59.9 504 62.5 61.4–63.7 243 60.0 58.3–61.6 Overall 7,824 60.5 60.2–60.8 8,977 60.7 60.4–61.0 3,752 59.6 59.2–60.0 a 95% confidence limits
Table 3 Percentage (±95% confidence limits) of patients without hip pain and with best functional status across BMI groups for follow-up years–3, 6, 9, and 12
Follow-up year
BMI Numbera No hip pain Walking time
without support >60 min Normal stair climbing Hip flexion range >90° Normal tying shoes 3 <25 2,537 79.4 77.8–81.0 63.8 62.0–65.6 85.0 83.6–86.5 80.9 79.3–82.4 75.1 72.1–78.2 25–30 2,884 79.3 77.7–80.8 58.8 57.0–60.6 81.6 80.1–83.2 77.8 76.2–79.4 73.5 70.7–76.4 >30 1,150 78.9 76.5–81.4 49.7b 46.9–52.4 75.1b 72.6–77.6 73.1b 70.5–75.8 61.2b 56.5–66.0 6 <25 1,492 79.5 77.5–81.6 57.9 55.5–60.4 77.8 75.8–79.9 78.4 76.3–80.5 74.4 71.1–77.6 25–30 1,933 80.4 78.6–82.2 54.6 52.5–56.7 72.9 70.9–74.9 76.9 75.0–78.9 69.9 67.1–72.8 >30 828 78.9 76.1–81.8 44.5b 41.3–47.8 64.7b 61.5–68.0 70.2b 67.1–73.3 64.1b 59.7–68.5 9 <25 500 75.5 71.7–79.3 49.6 45.3–53.9 69.3 65.2–73.4 77.3 73.5–81.1 68.7 62.9–74.4 25–30 611 74.2 70.6–77.7 44.4 40.8–48.0 65.7 61.9–69.5 72.7 69.0–76.3 66.0 60.2–71.8 >30 199 76.5 69.8–83.2 38.3b 31.9–44.7 54.8b 47.4–62.2 74.6 68.7–80.5 50.3b 41.3–59.3 12 <25 158 74.6 67.0–82.2 45.3 37.3–53.4 63.4 54.5–72.4 69.3 61.2–77.4 62.9 53.0–72.8 25–30 152 74.4 67.1–81.6 42.0 36.1–47.9 59.2 51.6–66.9 60.6 52.4–68.8 57.5 47.5–67.5 >30 52 81.0 71.2–90.8 22.5b 15.5–29.4 47.3 33.4–61.3 80.9 79.3–82.4 36.8 27.9–45.8 a
Sample size for hip pain, walking time without support, and hip flexion range (mandatory fields in the IDES sheets).
b
indicate no significant differences between BMI groups for postoperative pain for the entire follow-up period.
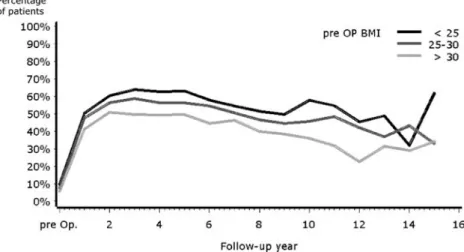
Walking Time Without Support
The proportions of patients capable of walking more than 1 h at postoperative years 3, 6, 9, and 12 are given in Table3. The standardized proportions across preoperative BMI groups and follow-up time are shown as percentages in Fig. 1. The highest prevalence of cases with the best walking capacity was observed during postoperative years 3–6. Compared to normal weight patients (BMI<25), obese patients (BMI >30) had consistently poorer walking capacities. Statistically significant differences between the normal and obese group were observed up to postoperative year 12. The differences in walking time between groups appeared parallel up to year 10 after THA. Postoperative differences in the proportions of patients capable of walking more than 1 h between these two BMI groups were in the range of 9–21%. Overweight patients also had consistently
lower walking capacities. Differences with the normal weight group were, however, not significant for any of the follow-up years 3, 6, 9, and 12.
The crude and standardized data for ascending and descending stairs are given in Table 3 and Fig. 2. The proportion of patients without any impairment in walking up stairs reached its peak during years 2–4 after THA and declined almost in parallel for all BMI groups. The differences in the proportions were significant between the obese and the normal weight group. Similarly consistent but not significant differences were observed between the overweight and the normal weight group.
The crude proportion of patients with hip flexion range greater than 90° is shown in Table3. Hip flexion range was above 90° for more than 70% of all patients in all BMI groups, up to postoperative year 6, but the number of cases with the best flexion range in the obese group was signi-ficantly lower than in the normal weight group. Consistent differences were seen between overweight and normal weight groups, but they were not statistically significant.
Fig. 1 Standardized proportions of patients with walking time without support >60 min
Fig. 2 Standardized proportions of patients capable of normal stair climbing
Discussion
There is high evidence that obesity is a risk factor for osteoarthritis and subsequent THA [7–11]. In addition, obesity was also identified as a risk factor for intra- and postoperative complications in THA [12]. However, there is little information available on the effects of preoperative obesity on postoperative pain and functional status after THA [3, 5]. Postoperative hip pain and functional status were therefore studied in a large cohort of THA patients over a follow-up period of 15 years.
Overweight and obesity are often associated with a variety of additional health problems [13, 14] that may secondarily affect physical function. Furthermore, degenera-tive joint diseases have detrimental effects on other weight-bearing joints and may thus severely affect mobility. The strengths of this study include a possible generalization of the results based on the multi-center nature of the evaluation and the large number of patients and clinical follow-up examinations over a long period of time. Furthermore, the multivariate approach in analyzing the data allowed accounting for effects of confounding factors associated with both outcome and BMI. We therefore consider the results to be applicable to a broad range of patients, irrespective of their age, gender, diagnosis, and factors related to surgical procedures and implants.
Our data support the findings of other studies stating that the probability of developing osteoarthritis with resulting THA is significantly increased in obese patients [8,10,15,
16]. Interestingly, obese patients need THA younger than normal weight patients in the diagnostic groups of osteoar-thritis, dysplasia, and inflammatory arosteoar-thritis, but not for fractures. The older age at THA for the diagnostic group of fractures for obese patients may also indicate some preven-tive effects of obesity, possibly associated with lower levels of physical activity and lower incidence of osteoporosis in such patients. These findings support the hypothesis of Taylor et al. [17], who found a positive correlation between low BMI and increased risk of femoral neck fractures.
There exists only one recent study comparing pain reduction after THA in an obese patients group (BMI>30, n=89) against a non-obese patients group (BMI<30, n=99) [18] with no statistical difference after a mean follow-up of 14.5 years. The authors found a complete and long-lasting relief of pain for 70–80% of all patients. This was irrespective of their preoperative BMI over the entire follow-up period of 15 years. High BMI is therefore an irrelevant prognostic factor for postoperative pain relief. The results confirm the fast alleviation of pain after surgery and the high efficacy of THA in therapy and rehabilitation of disabling disorders of the hip joint.
Furthermore, to our knowledge, this is the first large cohort study showing that high preoperative BMI is
associated in an almost perfect dose–effect relationship with decreased ambulation during the entire follow-up period. Maximal outcomes for ambulation (walking without support and climbing/descending stairs) of obese patients were consistently 10–20% below normal weight patients (Figs. 1 and 2). The data show that peak postoperative walking capacities are reached only 2 to 3 years after THA and remain on a plateau until year 5. No such plateau phase is seen for climbing and descending stairs, most likely because of the fact that climbing or descending stairs is a less demanding task than walking for more than 1 h. Furthermore, there are no indications of delayed postopera-tive mobilization in the overweight or obese patient group or of differences in the course of loss of mobilization with increasing postoperative time.
Differences in hip flexion range between BMI groups are less compelling than outcomes directly related to ambula-tion, and there is no consistent dose–effect relationship after postoperative year 7. It appears therefore that detrimental effects of high BMI on physical function are not directly linked to the biomechanical functionality and flexibility of the hip joint itself, but to the overall agility and mobility of patients. This impression is consistent with the findings regarding the ability to put on shoes and socks, where obese and overweight patients have consistently poorer outcomes during the entire follow-up period, although unimpaired hip flexion range is a prerequisite for putting on shoes and socks.
It can be argued that the overall physical performance of overweight and obese patients is already generally poor before THA and that postoperative functional improvement is regained only in relation to the preoperative status. However, according to the results of this study, BMI is a significant factor associated with poor functional outcome that could be influenced preoperatively [19]. Furthermore, loosing weight has numerous other health benefits, includ-ing fewer perioperative complications [20]. On the other hand, it has to be stressed that the most important goal of implanting an artificial hip joint, which is pain reduction, is accomplished in obese patients similarly as in the normal weight group. These facts might warrant some additional recommendations given to patients by physicians before THA, to reduce perioperative risks and improve postopera-tive outcome quality.
Conclusion
Overweight and obesity, in particular, are modifiable risk factors that not only play a deleterious role in the pathogenesis of osteoarthritis, but also affect physical outcome after THA. It is therefore important that surgeons inform patients about the negative consequences of high
preoperative bodyweight on restoring physical function after THA and that they emphasize pre- or postoperative weight control programs. On the other hand, it has to be stressed that THA is equally efficient for pain relief in all BMI groups.
References
1. Flugsrud GB, Nordsletten L, Espehaug B, et al. The impact of body mass index on later total hip arthroplasty for primary osteoarthritis: a cohort study in 1.2 million persons. Arthritis Rheum. 2006;54(3):802–7.
2. Perka C, Paul C, Matziolis G. Factors influencing perioperative morbidity and mortality in primary hip arthroplasty. Orthopäde. 2004;33(6):715–20.
3. Braeken AM, Lochhaas-Gerlach JA, Gollish JD, et al. Determi-nants of 6–12 month postoperative functional status and pain after elective total hip replacement. Int J Qual Health Care. 1997;9(6): 413–8.
4. Young NL, Cheah D, Waddell JP, et al. Patient characteristics that affect the outcome of total hip arthroplasty: a review. Can J Surg. 1998;41(3):188–95.
5. Stickles B, Phillips L, Brox WT, et al. Defining the relationship between obesity and total joint arthroplasty. Obes Res. 2001;9(3): 219–23.
6. Paterson D. The International Documentation and Evaluation System (IDES). Orthopedics. 1993;16(1):11–4.
7. Wendelboe AM, Hegmann KT, Biggs JJ, et al. Relationships between body mass indices and surgical replacements of knee and hip joints. Am J Prev Med. 2003;25(4):290–5.
8. Karlson EW, Mandl LA, Aweh GN, et al. Total hip replacement due to osteoarthritis: the importance of age, obesity, and other modifiable risk factors. Am J Med. 2003;114(2):93–8.
9. Gelber AC. Obesity and hip osteoarthritis: the weight of the evi-dence is increasing. Am J Med. 2003;114(2):158–9.
10. Marks R, Allegrante JP. Body mass indices in patients with disabling hip osteoarthritis. Arthritis Res. 2002;4(2):112–6. 11. Sturmer T, Gunther KP, Brenner H. Obesity, overweight and
patterns of osteoarthritis: the Ulm Osteoarthritis Study. J Clin Epidemioly. 2000;53(3):307–13.
12. Perka C, Labs K, Muschik M, et al. The influence of obesity on perioperative morbidity and mortality in revision total hip arthroplasty. Arch Orthop Trauma Surg. 2000;120(5–6):267–71. 13. Kenchaiah S, Evans JC, Levy D, et al. Obesity and the risk of
heart failure. N Engl J Med. 2002;347(5):305–13.
14. Calle EE, Rodriguez C, Walker-Thurmond K, et al. Overweight, obesity, and mortality from cancer in a prospectively studied cohort of U.S. adults. N Engl J Med. 2003;348(17):1625–38. 15. March LM, Cross MJ, Lapsley H, et al. Outcomes after hip or
knee replacement surgery for osteoarthritis. A prospective cohort study comparing patients’ quality of life before and after surgery with age-related population norms. Med J Aust. 1999;171(5): 235–8.
16. Cooper C, Inskip H, Croft P, et al. Individual risk factors for hip osteoarthritis: obesity, hip injury, and physical activity. Am J Epidemiol. 1998;147(6):516–22.
17. Taylor BC, Schreiner PJ, Stone KL, et al. Long-term prediction of incident hip fracture risk in elderly white women: study of osteoporotic fractures. J Am Geriatr Soc. 2004;52(9):1479–86. 18. McLaughlin JR, Lee KR. The outcome of total hip replacement
in obese and non-obese patients at 10- to 18-years. J Bone Joint Surg Br. 2006;88(10):1286–92.
19. Parvizi J, Trousdale RT, Sarr MG. Total joint arthroplasty in patients surgically treated for morbid obesity. J Arthroplasty. 2000; 15(8):1003–8.
20. Mantilla CB, Horlocker TT, Schroeder DR, et al. Risk factors for clinically relevant pulmonary embolism and deep venous throm-bosis in patients undergoing primary hip or knee arthroplasty. Anesthesiology. 2003;99(3):552–60; discussion 5A.