ARTICLE
The relation between Cu/Au ratio and formation depth
of porphyry-style Cu
–Au ± Mo deposits
Hiroyasu Murakami&Jung Hun Seo& Christoph A. Heinrich
Received: 7 April 2009 / Accepted: 24 July 2009 / Published online: 13 August 2009 # Springer-Verlag 2009
Abstract Constraints on gold and copper ore grades in porphyry-style Cu–Au ± Mo deposits are re-examined, with particular emphasis on published fluid pressure and formation depth as indicated by fluid inclusion data and geological reconstruction. Defining an arbitrary subdivision at a molar Cu/Au ratio of 4.0×10⁴, copper–gold deposits have a shallower average depth of formation (2.1 km) compared with the average depth of copper–molybdenum deposits (3.7 km), based on assumed lithostatic fluid pressure from microthermometry. The correlation of Cu/ Au ratio with depth is primarily influenced by the variations of total Au grade. Despite local mineralogical controls within some ore deposits, the overall Cu/Au ratio of the deposits does not show a significant correlation with the predominant type of Cu–Fe sulfide, i.e., chalcopyrite or bornite. Primary magma source probably contributes to metal endowment on the province scale and in some individual deposits, but does not explain the broad correlation of metal ratios with the pressure of ore formation. By comparison with published experimental and fluid analytical data, the observed correlation of the Cu/ Au ratio with fluid pressure can be explained by dominant transport of Cu and Au in a buoyant S-rich vapor,
coexisting with minor brine in two-phase magmatic hydrothermal systems. At relatively shallow depth (approx-imately <3 km), the solubility of both metals decreases rapidly with decreasing density of the ascending vapor plume, forcing both Cu and Au to be coprecipitated. In contrast, magmatic vapor cooling at deeper levels (approx-imately >3 km) and greater confining pressure is likely to precipitate copper ± molybdenum only, while sulfur-complexed gold remains dissolved in the relatively dense vapor. Upon cooling, this vapor may ultimately contract to a low-salinity epithermal liquid, which can contribute to the formation of epithermal gold deposits several kilometers above the Au-poor porphyry Cu–(Mo) deposit. These findings and interpretations imply that petrographic inspec-tion of fluid inclusion density may be used as an exploration indicator. Low-pressure brine + vapor systems are favorable for coprecipitation of both metals, leading to Au-rich porphyry–copper–gold deposits. Epithermal gold deposits may be associated with such shallow systems, but are likely to derive their ore-forming components from a deeper source, which may include a deeply hidden porphyry–copper ± molybdenum deposit. Exposed high-pressure brine + vapor systems, or stockwork veins containing a single type of intermediate-density inclusions, are more likely to be prospective for porphyry–copper ± molybdenum deposits.
Keywords Cu/Au ratio . Depth . Pressure . Porphyry copper . Epithermal gold . Exploration
Introduction
Cu/Au ratios as well as bulk metals, specifically Au grade, in porphyry-style Cu–Au ± Mo deposits are at least in part
Editorial handling: B. Lehmann H. Murakami (*)
Geological Survey of Japan, AIST, Central 7,
Tsukuba 305-8567, Japan e-mail: [email protected]
H. Murakami
:
J. H. Seo:
C. A. HeinrichDepartment of Earth Sciences, Isotope Geochemistry and Mineral Resources, ETH Zurich,
Clausiusstr. 25,
controlled by the magmatic fluid source (Sillitoe 1997; Halter et al.2002; Heinrich et al.2005), but the wide range of actual Cu and Au grades of the deposits (Kesler 1973; Singer et al. 2005) is affected by at least two additional factors. First, fluid phase separation into brine and vapor leads to selective Cu–Au fractionation into the vapor and possibly to partial separation of the two ore metals (Heinrich et al.1999; Simon et al. 2005,2007; Pokrovski et al.2008). Second, the final ore grades are controlled by the precipitation efficiency of Cu–sulfides and native gold upon fluid cooling (e.g., Ulrich et al.2001), which in turn can be influenced by selective gold enrichment in primary auriferous Cu–sulfides such as bornite (Simon et al. 2000; Kesler et al.2002).
Previous compilation studies (e.g., Sutherland Brown
1976; Cox and Singer 1988; Sillitoe1997) have indicated that the Au grade of porphyry-style ore deposits increases with decreasing depth of ore deposition. Relationships between Au grade and tectonic setting, magnetite content in the potassic alteration zone, deposit morphology, and associated rock types have also been investigated (Kesler
1973; Sinclair et al. 1982; Sillitoe 1979, 1982). These results indicate that porphyry-style ore deposits range between two end-member types. The most Au-rich porphy-ry Cu–Au deposits, which commonly tend to be associated with relatively mafic intrusive rocks, are emplaced at around 1 km and usually contain abundant magnetite in the potassic alteration zone. Au-poor porphyry Cu ± Mo deposits occur with intermediate to felsic monzogranite and granodiorite emplaced at 3 km or greater depth and contain little or no hydrothermal magnetite (Cox and Singer1988). In these studies, the estimated depths of deposits were based mainly on qualitative geological features and gener-ally involve large uncertainty.
This paper re-examines the empirical relationships of formation depth and fluid pressure with varying Au and Cu ore grades of major porphyry-style Cu–Au ± Mo deposits in several provinces worldwide, using published geological information as well as fluid inclusion studies supported by microthermometry.
Evaluation methods and data sources
A total of 50 porphyry-style Cu–Au ± Mo deposits covering the full range of Cu/Au ratios were compiled in this study (Table1). The deposits are characterized by the presence of porphyritic intrusive rocks and a potassic alteration zone associated with the main Cu–Au ± Mo mineral assemblages, indicating coprecipitation of Cu–Fe– sulfides and gold, with or without molybdenite, which is commonly late in the paragenesis. Cu–Au deposits with a major epithermal overprint on porphyry mineralization
(e.g., Rosario, Chile: Masterman et al. 2005) where it is unclear how much Au may have been added after potassic alteration were omitted. Total tonnage and bulk metal grades of Cu, Au, and occasionally Mo and Ag in the deposits were taken from published compilations (Singer et al.2005,http://pubs.usgs.gov/of/2005/1060/; Camus2003). The Cu/Au ratio of the resulting 50 deposits ranges over four orders of magnitude from 2×10³ to 2.8×10⁶ on a molar scale (weight ratio from 7×10⁻⁶to 9×10⁻³). Original data were taken from the references cited in Table 1. Estimates of formation depths are based on two data types. (1) Depths based on geological features are available for 42 deposits, estimated from stratigraphic relations, erosion level, and alteration sequence (e.g., Sutherland Brown
1976; Vila and Sillitoe1991) as cited in the original papers. Where a depth range is given, the mean value was adopted and the extremes were used to denote uncertainty.
(2) Fluid pressures are mostly based on microthermom-etry of “boiling assemblages,” i.e., coexisting brine and vapor inclusions in the potassic alteration zone of 17 deposits, using the temperature of homogenization of brine inclusions with reference to the two-phase coexistence surface in the NaCl–H2O model system (Driesner and Heinrich2007and earlier references). At the early stage of a fluid-producing intrusive magma, fluids in the potassic zone are likely to be trapped at near-lithostatic pressures (Driesner and Geiger2007). Where several boiling assemb-lages are documented indicating a range of pressures, we, therefore, selected the one giving maximum pressure (which mostly corresponds with the highest temperature) because it is most likely to represent fluid trapping under lithostatic conditions close to the conditions of initial hydrofracturing and stockwork veining (Fournier1999). It is also reasonable to assume lithostatic conditions before the downward retraction of the fluid-producing melt (Burnham 1979). Where a range of fluid pressures is published without further detail, we adopted the maximum value and half of the cited range as an estimate of uncertainty (error bars). All fluid pressures were interpreted as lithostatic on the basis of evidence in the cited references (Table 1), which allows their conversion to depth below surface, using a rock density of 2.5 g/cm3(2.85 g/cm3for Butte, USA: Rusk et al.2008).
Where no indication of uncertainty is available in either of the two estimation methods, a minimum range of ±0.5 km (or +0.5 km only for the estimated depths of less than 0.5 km) is indicated as error bars in Figs.1and2. This is reasonable because economic mineralization in most porphyry-style ore deposits extends over about 1 km vertically. The estimated depths from geological features and microthermometry vary over the same range, from 1.1 to 7.5 km and from 1.1 to 7.0 km, respectively. However, for nine deposits where both types of estimates are
T able 1 Grade, tonnage, and estimated depth of the selected porphyry-style deposits Deposit name Country T onnage a (Mt) Cu a (%) Mo a (%) Ag a (g/t) Au a (g/t) Cu/Au b (molar ratio) Bornite d Estimated depth (km) Basis for estimation of depth Reference Geol. Error Microth. Error Marte c CL 46 0.10 –– 1.430 2,200 + 1.1 ±0.2 Geol. 1 Lobo c CL 80 0.12 –– 1.600 2,300 + 1.4 ±0.2 Geol. 1 Refugio c CL 216 0.10 –– 0.880 3,500 ++ 1.0 ±0.5 1.1 ±0.1 Litho. (vein texture) 2 Elatsite BG 319 0.36 –– 0.960 12,000 +++ 2.3 ±0.2 Litho. (vein texture) 3 Dizon PH 187 0.36 0.003 2.00 0.930 12,000 ++ 1.8 ±0.3 Litho. (vein texture) 4 Cerro Casale c CL 1,265 0.35 –– 0.700 15,000 + 1.0 ±0.5 Geol. 1 Far Southeast PH 650 0.65 – 0.93 1.300 15,000 +++ 1.6 ±0.5 1.6 ±0.2 Litho. (magmatic T) 5 Santo T omas II PH 449 0.38 0.001 1.50 0.700 17,000 +++ 2.0 ±0.2 Litho. (magmatic T) 6, 7 Kingking PH 400 0.35 – 5.00 0.600 18,000 +++ 0.7 ±0.3 Geol. 8, 9 Mt.Polley (Cariboo Bell) CA 293 0.23 0.001 4.00 0.300 24,000 ++ 1.0 ±0.5 Geol. 10, 1 1 Panguna PG 1,420 0.47 0.005 – 0.570 25,000 + 3.0 ±0.3 Litho. (magmatic T) 12, 13 Bajo de la Alumbrera AR 806 0.53 – 2.50 0.640 26,000 + 2.5 ±0.5 3.0 ±0.9 Litho. (vein texture) 14, 15 Kalamatan PH 26 0.34 –– 0.370 28,000 ++ 0.6 ±0.25 Geol. 8, 9 Grasber g ID 4,000 0.60 – 2.00 0.640 29,000 +++ 2.0 ±0.5 Geol. 16 Kadzharan AM 181 0.65 0.050 2.00 0.650 31,000 + 1.5 ±0.5 Geol. 8, 18 Almalyk UZ 6,080 0.39 0.002 – 0.370 33,000 ++ 1.2 ±0.5 Geol. 18 Mapula PH 78 0.40 – 3.60 0.370 34,000 0.4 +0.5 Geol. 8, 9 Galore Creek (Stikine) CA 316 0.68 0.001 7.90 0.520 41,000 ++ 1.2 ±0.5 Geol. 10, 1 1 Iron Mask (Ajax) CA 21 0.45 0.001 2.00 0.340 41,000 + 0.9 ±0.5 Geol. 10, 1 1 T anama PR 126 0.64 0.005 1.70 0.380 52,000 + 3.0 ±0.5 2.4 ±0.2 Litho. (magmatic T) 19 T agpura-Maangob PH 23 0.42 0.008 – 0.230 57,000 0.2 +0.5 Geol. 8, 9 Morrison CA 190 0.40 0.017 1.00 0.210 59,000 + 1.2 ±0.5 3.2 ±0.4 Litho. (vein texture) 10, 20 Schaft Creek (Liard) CA 972 0.30 0.033 1.20 0.140 66,000 +++ 0.6 ±0.5 Geol. 10, 20 Island Copper CA 377 0.41 0.017 1.40 0.190 67,000 1.5 ±0.5 3.1 ±0.5 Litho. (vein texture) 21 Bell (Babine Lake) CA 495 0.36 0.005 1.00 0.160 70,000 1.2 ±0.5 Geol. 10, 20 Ely US 754 0.61 0.010 0.80 0.270 70,000 3.0 ±0.3 Litho. (vein texture) 22, 23 Bingham US 3,230 0.88 0.053 3.30 0.380 72,000 +++ 2.5 ±0.5 2.1 ±0.8 Litho. (isotopes) 24 Recsk HU 700 0.66 0.005 – 0.280 73,000 1.3 ±0.5 Geol. 8, 25 T ongchang (Dexing) CN 1,168 0.45 0.010 – 0.190 73,000 + 2.0 ±0.5 Geol. 26 Agua Rica (Mi V ida) AR 1,710 0.43 0.032 3.20 0.170 78,000 +++ 2.0 ±0.5 Geol. 27
T able 1 (continued) Deposit name Country T onnage a (Mt) Cu a (%) Mo a (%) Ag a (g/t) Au a (g/t) Cu/Au b (molar ratio) Bornite d Estimated depth (km) Basis for estimation of depth Reference Geol. Error Microth. Error Copper Mountain CA 324 0.47 0.001 3.90 0.170 86,000 +++ 1.1 ±0.5 Geol. 10 Oyu T olgoi MN 3,107 0.68 –– 0.240 87,000 ++ 1.7 ±1.0 Geol. 28 Granisle CA 85 0.43 0.009 1.10 0.120 1 10,000 +++ 1.2 ±0.5 Geol. 10 La Escondida CL 4,860 0.97 0.006 5 0.250 120,000 3.2 ±0.4 Litho. (isotopes) 29 Gibraltar CA 965 0.32 0.010 0.90 0.070 140,000 4.6 ±0.5 Geol. 10, 20 La V erde MX 1 1 0 0.70 – 2.50 0.088 250,000 ++ 4.8 ±1.7 Litho. (isotopes) 30 Ber g C A 250 0.40 0.030 5.00 0.050 250,000 + 2.0 ±0.5 Geol. 10, 20 Santa Rita US 3,030 0.47 0.008 1.40 0.056 260,000 ++ 6.0 ±0.5 Geol. 31 El Salvador CL 866 1.41 0.010 1.50 0.120 360,000 ++ 2.0 ±1.0 3.6 ±0.2 Litho. (isotopes) 32 Brenda CA 227 0.16 0.039 0.63 0.013 380,000 4.4 ±0.5 Geol. 10 Aktogai KZ 3,200 0.39 0.008 1.10 0.029 420,000 ++ 2.1 ±0.65 Geol. 8, 18 Butte US 5,220 0.67 0.028 8.60 0.042 500,000 7.5 ±1.0 7.0 ±0.4 Litho. (vein texture) 33 Ithaca Peak (Mineral Park) US 172 0.46 0.032 2.20 0.027 530,000 4.4 ±0.7 Litho. (vein texture) 34 Huckleberry CA 161 0.48 0.015 0.93 0.025 600,000 2.3 ±0.5 Geol. 10, 20 Ann Mason US 495 0.40 0.010 0.00 0.010 1,200,000 3.3 ±0.8 Geol. 35 Chuquicamata CL 17,100 0.65 0.040 5.00 0.013 1,500,000 +++ 4.5 ±0.5 Geol. 36 Highmont CA 265 0.27 0.041 0.90 0.004 2,100,000 +++ 3.9 ±0.5 Geol. 10 Lornex CA 514 0.43 0.015 1.20 0.006 2,200,000 +++ 4.4 ±0.5 Geol. 10, 20 V alley Copper CA 800 0.48 0.010 1.90 0.006 2,500,000 +++ 4.8 ±0.5 Geol. 10, 20 Bethlehem CA 677 0.45 0.016 0.40 0.005 2,800,000 +++ 3.9 ±0.5 Geol. 10, 20 – data not available, AM Armenia, AR Ar gentina, BG Bulgaria, CA Canada, CL Chile, CN China, HU Hungary , ID Indonesia, KZ Kazakhstan, MN Mongolia, MX Mexico, PG Papua New Guinea, PH Philippines, PR Puerto Rico, US United States of America, UZ Uzbekistan, Geol. estimated depth based on geological features such as stratigraphic reconstruction based on erosion level and alteration sequence, Micr oth. microthermometry of boiling fluid inclusions in a potassic alteration zone, Litho. lithostatic pressure based on (1) magmatic temperature (>600°C), (2) isotopes indicating magmatic signatures, (3) vein texture: sugary , granular texture of quartz in a potassic alteration, the irregular vein walls, and the dis continuous nature indicating a ductile nature, 1 V ila and Sillitoe ( 1991 ), 2 Muntean and Einaudi ( 2000 ), 3 von Quadt et al. ( 2005 ), 4 Imai ( 2005 ), 5 Hedenquist et al. ( 1998 ), 6 T akenouchi and Imai ( 1976 ), 7 Imai ( 2001 ), 8 Singer et al. ( 2005 ), 9 Sillitoe and Gappe ( 1984 ), 10 Sutherland Brown ( 1976 ), 11 Lang et al. ( 1995 ), 12 Eastoe ( 1978 ), 13 Eastoe ( 1982 ), 14 Ulrich et al. ( 2001 ), 15 Heinrich et al. ( 2005 ), 16 MacDonald and Arnold ( 1994 ), 17 Recharsky ( 1980 ), 18 Zvezdov et al. ( 1993 ), 19 Cox ( 1985 ), 20 Schroeter ( 1995 ), 21 Arancibia and Clark ( 1996 ), 22 Roedder ( 1981 ), 23 Bauer et al. ( 1966 ), 24 Redmond et al. ( 2004 ), 25 Herrington et al. ( 2003 ), 26 Rui et al. ( 2005 ), 27 Koukharsky and Mirré ( 1976 ), 28 Perello et al. ( 2001 ), 29 Padilla-Garza et al. ( 2004 ), 30 González-Partida and Levresse ( 2003 ), 31 Audétat et al. ( 2004 ), 32 Gustafson and Hunt ( 1975 ), 33 Rusk et al. ( 2008 ), 34 Lang and Eastoe ( 1988 ), 35 Dilles and Prof fett ( 1995 ), 36 Ossandon et al. ( 2001 ) aData in Singer et al. ( 2005 ) with the exception of some deposits denoted in table note c b See text for explanation. The calculated values are rounded to two significant digits c T onnage and grade data in Camus ( 2003 ) d Bornite content in Cu-sulfide minerals: +++ major (ore constituent); ++ minor (partly contained), + trace (microspopic), no symbol not reported
available, individual discrepancies are greater and appar-ently systematic, as discussed below.
Results
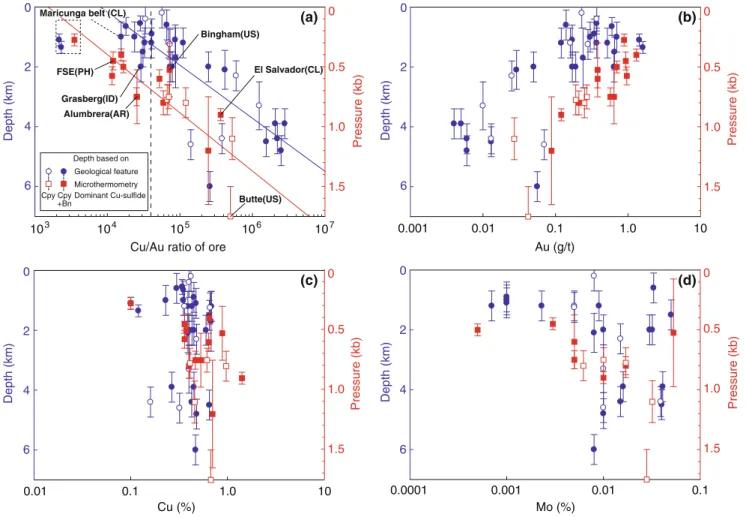
Table 1 summarizes the grade, tonnage, Cu/Au ratio, abundance of bornite, and estimated depth of the deposits together with the data sources. Figure 1 shows the relationships among estimated depths by the two methods and the Cu/Au ratio, as well as the individual Au, Cu, and Mo grades of the deposits.
The Cu/Au ratio of the ore deposits generally increases with increasing depth for both types of depth estimations (Fig. 1a). This is mainly due to the Au grade showing a distinct decrease with mineralization depth (Fig. 1b). Copper grade for the whole range of depths varies less, partly reflecting economic grade limits, with a mean value
of 0.50% and a standard deviation (1σ) of ±0.21%, whereas the range of Au grades is much larger (average 0.29± 0.29 g/t, excluding the Au-rich but Cu-poor porphyry-style deposits in the Maricunga belt; Vila and Sillitoe 1991; Muntean and Einaudi 2000). Molybdenum grade tends to have a wide variation among shallow deposits, but most of the deeper deposits are relatively Mo-rich. Neither element ratio nor estimated depth shows any significant correlation with the abundance of bornite in the deposits.
Based primarily on their Cu/Au ratio, porphyry-style ore deposits are generally classified into copper–gold deposits and copper–molybdenum deposits (e.g., Kirkham and Sinclair 1995; Kesler et al. 2002; Fig. 1a). Splitting the continuous range at a molar Cu/Au ratio of 4.0×10⁴(Kesler et al. 2002), the copper–gold deposits have a shallower average depth by microthermometry (average 2.1 km) than the copper–molybdenum deposits (3.7 km). Deposits containing more than 0.2 g/t Au mainly occur at depths of 6
4 2 0
103
Cu/Au ratio of ore
104 105 106 107 Depth (km) 6 4 2 0 0.1 1.0 10 0.001 0.01 Au (g/t) 0.1 1.0 10 0.01 Cu (%) 6 4 2 0 Depth (km) 6 4 2 0 Depth (km) 0.1 0.0001 0.001 0.01 Mo (%) Maricunga belt (CL) Maricunga belt (CL) Maricunga belt (CL) FSE(PH) Bingham(US) Alumbrera(AR) Grasberg(ID) El Salvador(CL) Butte(US) (a) (b) (c) (d) Geological feature Microthermometry Depth based on Dominant Cu-sulfide Cpy +Bn Cpy 0 0.5 1.0 1.5 Pressure (kb) 0 0.5 1.0 1.5 Pressure (kb) 0 0.5 1.0 1.5 Pressure (kb) 0 0.5 1.0 1.5 Pressure (kb) Depth (km)
Fig. 1 Relationships between Cu/Au ratio (a), Au (b), Cu (c), and Mo (d) ore grades and depth of formation of porphyry-style deposits, derived from geological estimation on the left vertical axes. Fluid pressure from microthermometry on the right vertical axes corre-sponds to formation depth if lithostatic conditions and a rock density of 2.5 g/cm3are assumed. Formation pressure and estimated depth of
porphyry-style deposits decrease with decreasing Cu/Au ratio or total Au grade. Solid lines showing fitted trends, excluding the data from the Maricunga belt, for geological depth estimates (blue) and fluid inclusion microthermometry (red). Dotted line showing a molar Cu/ Au ratio of 4.0×10⁴ as defined in Kesler et al. (2002) to separate copper–gold deposits from copper ± molybdenum deposits
less than about 3 km (corresponding to a lithostatic fluid pressure of about 0.75 kb).
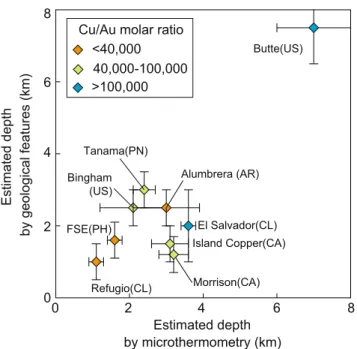
The relatively large scatter in depth estimates from geological features (Fig. 2) arises from difficulties in the reconstruction of overlying geology in environments with rapidly evolving topographic relief (e.g., Sillitoe and Hedenquist 2003). Nevertheless, Figs. 1a and 2 show a clear tendency for shallower depth estimates from geology, compared with those derived from fluid inclusion pressures. A small part of this discrepancy may be due to supra-lithostatic fluid pressure (~100 bar limited by rock strength; Kirby 1985) but the greater difference (approximately 1–
2 km) may reflect rapid erosion or gravitational collapse of the paleosurface during the Cu ± Mo ± Au mineralization process (Sillitoe 1994; also Agua Rica: Landtwing et al.
2002; Lihir: Carman 2003). The discrepancy is definitely not related to the transition from early lithostatic to later hydrostatic pressures, as observed in many deposits (e.g., for Bingham Canyon: Redmond et al.2004) and expected in an overall cooling and progressively brittle vein system (Fournier1999).
Interpretation and discussion
The Cu/Au ratio of porphyry-style ore deposits is likely to be controlled by a combination of magma source character-istics and the subsequent physical–chemical evolution of
the ore-forming hydrothermal fluids. The positive correla-tion of Cu/Au ratio with depth, confirming and further specifying previous observations (Sutherland Brown1976; Cox and Singer1988; Sillitoe1997), indicates that magma source is not the sole factor determining the bulk metal ratio of the deposits, even though gold and molybdenum availability in the source magma is an essential prerequisite. We propose that the density evolution of cooling magmatic– hydrothermal fluids holds the key to explaining the systematic variation of Au/Cu ratios of porphyry-style ore deposits with depth and pressure of ore formation. Fluid pressure controls the extent of fluid phase separation into brine and vapor, resulting in fractionation of ore-forming components, and fluid density together with temperature also affects the differential solubility and selective precip-itation of ore minerals.
Magma source control is emphasized by Sillitoe (1997) who suggested, on the basis of the occurrence of large Au-rich porphyry-style deposits containing over 200 t of Au in the circum-Pacific region, that Au-rich magmatic–hydro-thermal ore deposits are genetically related to the combined effects of (1) oxidized magmatism induced by postsubduc-tion partial melting of a stalled slab of oceanic lithosphere (Oyarzún et al. 2001) or the uppermost mantle wedge, which favors the development of (2) a high-K calc-alkaline to shoshonitic petrochemical affiliation. In addition, Sillitoe (1997) pointed out the empirical evidence (3) of relatively shallow depth of ore deposition, indicated by comagmatic extrusive and subvolcanic activity in gold-mineralized igneous centers. The suggestion of partial melting of an oxidized slab is debated in the broader context of geochemical evidence for an “adakite-like” signature of many porphyry–Cu–Au mineralizing magmas (e.g., Oyarzún et al. 2001; Reich et al. 2003). However, the typical high Sr/Y ratio commonly associated with ore-producing magmas can also be explained by amphibole-dominated and plagioclase-suppressed fractionation of normal subduction-zone magmas at high water fugacity in the upper mantle or lower crust (Kay and Mpodozis2002; Richards2003), which is favored by a compressional stress state of the converging lithospheric plates (Rohrlach and Loucks 2005; Sillitoe and Perelló 2005). K-rich calc-alkaline magmatism does not seem to be essential for the formation of Au-rich porphyry deposits, even though some giant Au–(Te)-rich epithermal deposits are clearly associat-ed with alkalic magmas (e.g., Cripple Creek: Lindgren and Ransome 1906; Porgera: Richards 1992). Among the Au-rich porphyry–copper deposits, only 45% are associated with high-K calc-alkaline to shoshonitic suites (Sillitoe
1997), and some, particularly Au-rich porphyry deposits, are associated with distinctly low-K but sodic magmas (e.g., Batu Hijau: Garwin 2002). The correlation between the bulk Au/Cu ratio of the Bajo de Alumbrera deposit with 0 2 4 6 8 0 2 4 6 Estimated depth by microthermometry (km) Estimated depth
by geological features (km) FSE(PH) Bingham (US) Alumbrera (AR) El Salvador(CL) Morrison(CA) Island Copper(CA) Tanama(PN) Butte(US) Refugio(CL) Cu/Au molar ratio
<40,000 40,000-100,000
>100,000
8
Fig. 2 Relationship between estimates of depth by geological features and the corresponding depth by microthermometry where both types of data are available (Table1). Butte deposit is one of the well-studied examples at the deep end of gold-poor Cu–Mo porphyry deposits, whereas the Maricunga porphyry–gold deposits represent the shallow copper-poor extreme of the spectrum
that of high-temperature hydrothermal fluids (Ulrich et al.
1999) and also with magmatic sulfide melt inclusions in associated fresh igneous rocks (Halter et al.2002) indicates that a magmatic source controls the proportions of available ore metals. Thus, the giant Cu–Mo deposit of El Teniente is Au-poor despite its relatively shallow emplacement (Fig. 6 in Klemm et al. 2007), probably because its primary magmatic–hydrothermal input fluid had an inherently lower Au/Cu ratio compared with the fluids at Bajo de la Alumbrera (L. Klemm, unpublished data). The same may apply to the demonstrably shallow but Au-free Yerington deposit (Proffett 1979; Dilles and Proffett 1995). Magma source is also likely to control the abundance of Mo in porphyry deposits, at least in the world’s primary molyb-denum province of the western USA (Carten et al.1988), as reflected by the poor correlation of Mo/Cu with depth of mineralization (Fig. 1c, d). However, magmatic source control does not explain the correlation of Au/Cu with depth and the empirical observation that deeply formed deposits are generally less gold-rich than shallow ones.
A crystal–chemical control has been suggested as the decisive factor for the formation of Au-rich porphyry copper deposits with high Au/Cu ratio, based on experiments showing a greater tendency for gold to be incorporated in bornite solid solution at high temperature (>600°C), in preference over chalcopyrite (Simon et al.2000), allowing the possibility of gold extraction from fluids that are undersaturated with the native metal (Kesler et al. 2002). Although the distribution of Au is commonly correlated with a bornite-dominant mineralogy within individual ore bodies (e.g., Bingham: Redmond et al. 2004), our compilation does not indicate a general correlation of the bulk Au/Cu ratio in porphyry deposits with the presence or the predominance of bornite over chalcopyrite (Fig.1). This observation implies that the bulk Au/Cu endowment of porphyry deposits does not result primarily from the selective precipitation of auriferous bornite. This conclu-sion is also supported by the observation that the temperature of Cu–Fe–sulfide (± gold) precipitation is much lower than the >600°C required for initial incorpo-ration of gold as a solid solution in bornite (Landtwing et al.2005; Klemm et al.2007).
Brine–vapor separation leads to preferential partitioning of Cu, Au, and S into the vapor phase, relative to chloride-complexed salt components like Na, K, and base metals partitioning into the hypersaline liquid (Ulrich et al.1999; Heinrich et al.1999; Pokrovski et al.2005,2008; Nagaseki and Hayashi 2008; Seo et al. 2009). Ulrich et al. (1999) reported that the Au/Cu ratio of many vapor inclusions trapped above 600°C at Grasberg is higher than the average Au/Cu ratio of the coexisting brines, which have a similar Au/Cu ratio to the bulk ore body. These observations might indicate that gold has a greater tendency than copper to
fractionate into a dense magmatic vapor rather than the coexisting brine (consistent with high Au solubility in S-rich low-salinity fluids; Loucks and Mavrogenes 1999), but published experimental data do not yet define the relative tendencies of Au and Cu partitioning during brine– vapor separation.
Density-dependent precipitation of Cu–Fe–sulfides and gold is proposed as the main explanation for the observed correlation between metal ratio and formation depth of porphyry deposits. Ore minerals in porphyry deposits dominantly precipitate at the lower end of the temperature range of stockwork vein formation, typically between ~450°C and ~ 320°C (Crerar and Barnes 1976; Bodnar and Beane1980; Hedenquist et al.1998; Hezarkhani et al.
1999; Redmond et al.2004; Landtwing et al.2005; Kojima
2005; Klemm et al. 2007). We suggest that the density of low-salinity magmatic fluids in this cooling interval is decisive for selective mineral precipitation and thereby controls the final Au/Cu ratio of a porphyry deposit. Pressure release at the lithostatic to hydrostatic transition promotes fluid phase separation into a minor quantity of brine and a vapor phase. This vapor predominates in total volume, fluid mass, and contained sulfur, copper, and gold (Henley and McNabb 1978; Landtwing et al. 2005;
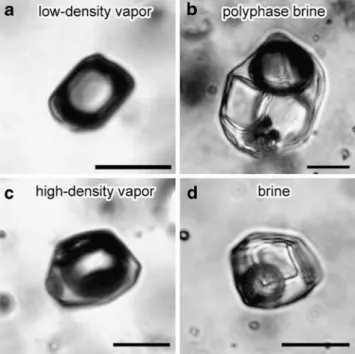
Fig. 3 Representative photomicrographs of fluid inclusions to illustrate that simple petrographic inspection alone allows distinction between low-density vapor inclusions associated with highly salt-packed brine inclusions characterizing shallow gold-rich porphyry Cu–Au ± Mo deposits (a and b Bajo de la Alumbrera), in contrast to high-density vapors associated with brine inclusions containing small salt crystals typical for deep high-pressure porphyry deposits, which are typically Cu ± Mo-rich but Au-poor (c and d Butte; brine and vapor assemblages postdating intermediate-density pre-ore fluids; Rusk et al.2008). Scale bars are 10 µm
Williams-Jones and Heinrich2005; Klemm et al.2007) but can have greatly variable density.
Low fluid pressure in shallow porphyry systems will lead to progressive expansion to a low-density vapor and the greatest predominance of vapor over brine. Recent experiments on metal transport by vapor show that decreasing density of a water-rich vapor leads to destabilization of all dissolved ore metal complexes, when the water fugacity becomes too low for maintain-ing the hydration sphere required for the formation of volatile metal complexes (Williams-Jones et al. 2002; Pokrovski et al.2005). Strong and rapid fluid decompres-sion occurring in a shallow porphyry system will, therefore, result in coprecipitation of both copper and gold (e.g., the Bingham Au–Cu ore body formed at <200 bar; Redmond et al.2004; Landtwing et al.2005). In the most extreme case, only gold may precipitate (± oxides ± halite) if the pressure is too low even for the stabilization of any Cu–sulfide minerals. This process is exemplified by the gold-only porphyry deposits of the Maricunga belt, which formed within less than 1 km from the surface, within volcanoes (Vila and Sillitoe 1991; Muntean and Einaudi2000)
If fluid pressure is higher in a relatively deep-seated porphyry deposit, phase separation is less extreme and a relatively dense vapor or a single-phase fluid of near-critical density will predominate. At high temperature, such a fluid is able to carry all metals in high concentrations. Cooling of this fluid at elevated pressure tends to further increase its density towards a liquid-like state (vapor to liquid contraction; Heinrich et al. 2004). Such fluids will readily precipitate Cu–Fe–sulfides and molybdenite upon cooling (Hezarkhani et al. 1999; Klemm et al. 2007), but they can retain a significant or even dominant proportion of their gold in solution. The fraction of gold remaining in solution depends on the fluid density as well as the concentration of sulfur, which acts as an essential complex-ing ligand for gold at lower temperature (Gammons and Williams-Jones 1997; Stefánsson and Seward 2004; Heinrich 2005). Deep-seated porphyry copper ± Mo deposits are, therefore, expected to be deficient in Au, relative to the Au/Cu ratio of their primary magmatic– hydrothermal input fluid. The fraction of gold that is lost from the environment of such a deep porphyry ore body is available for the formation of separate gold deposits at lower temperature, typically several kilometers higher up in the system. Epithermal gold deposits can form where the liquid derived from contracted vapor starts to boil again or where it mixes with shallow groundwater (e.g., Hedenquist et al.1998; Ronacher et al.2004; Pudack et al.2009). Carlin-type gold deposit may be formed where the gold-rich contracted vapor encounters reducing or Fe-rich sedimentary rocks (Kesler et al.2003; Heinrich2005; Su et al.2009).
For the exploration of a new porphyry system, where at an early stage only weathered or even transported vein quartz may be available for petrographic inspection, our results could be used for a first-order prediction about the likely Au/Cu ratio of a potential porphyry deposit. Low-density vapor inclusions (Fig.3a, almost“empty” looking) observed together with highly saline brine inclusions (Fig. 3b, “packed” with salt crystals; e.g., Grasberg or Alumbrera: Ulrich et al. 1999, 2001; Dizon: Imai, 2005) indicate low fluid pressure, characteristic of gold-rich porphyry Cu–Au ± Mo deposits. On the other hand, the presence of high-density vapor (Fig. 3c) coexisting with brine inclusions of moderate salinity (Fig. 3d) or the predominance of a single type of intermediate-density inclusions indicate high fluid pressure and would predict that an associated Cu ± Mo porphyry is likely to be gold-poor (e.g., Butte: Rusk et al. 2008). Gold-rich epithermal deposits may have formed in such a system, but they are likely to be eroded unless they were selectively protected by faulting and differential uplift. These qualitative explo-ration predictions can later be followed up by micro-thermometry and direct analysis of the Au/Cu ratio of the fluid inclusions by laser ablation inductively coupled plasma mass spectrometry.
Acknowledgments An earlier version of the manuscript was considerably improved by detailed comments and criticism by Jane Hammerstrom of the U.S. Geological Survey. John H. Dilles is particularly acknowledged for his detailed comments of the manu-script; his constructive criticism is greatly appreciated. AIST is thanked for funding the research of the first author at ETH Zurich. The authors also acknowledge the financial support from the Arai Science Technology Development Foundation and the Japan Mining Promotive Foundation. We are particularly grateful for the reviews by Richard Sillitoe and John Mavrogenes, which further helped to improve this manuscript.
References
Arancibia ON, Clark AH (1996) Early magnetite –amphibole–plagio-clase alteration–mineralization in the Island Copper porphyry copper–gold–molybdenum deposit, British Columbia. Econ Geol 91:402–438
Audétat A, Pettke T, Dolej D (2004) Magmatic anhydrite and calcite in the ore-forming quartz–monzonite magma at Santa Rita, New Mexico (USA): genetic constraints on porphyry–Cu mineraliza-tion. Lithos 72:147–161
Bauer HL Jr, Breitrick RA, Cooper JJ, Anderson JA (1966) Porphyry copper deposits in the Robinson mining district, Nevada. In: Titley SR, Hicks CL (eds) Geology of the porphyry copper deposits, southwestern North America. University of Arizona Press, Tucson, pp 233–244
Bodnar RJ, Beane RE (1980) Temporal and spatial variations in hydrothermal fluid characteristics during vein filling in preore cover overlying deeply buried porphyry copper-type mineraliza-tion at Red Mountain, Arizona. Econ Geol 75:876–893
Burnham CW (1979) Magma and hydrothermal fluids. In: Barnes HL (ed) Goechemistry of hydrothermal ore deposits, 2nd edn. Wiley, New York, pp 71–136
Camus F (2003) Geología de los sistemas porfíricos en los Andes de Chile. Servicio Nacional de Geologia y Mineria, Santiago, p 267
Carman GD (2003) Geology, mineralisation and hydrothermal evolution of the Ladolam gold deposit, Lihir Island, Papua New Guinea. Soc Econ Geol Spec Publ 10:247–284
Carten RB, Geraghty EP, Walker BM, Shannon JR (1988) Cyclic development of igneous features and their relationship to high-temperature hydrothermal features in the Henderson porphyry molybdenum deposit, Colorado. Econ Geol 83:266–296 Cox DP (1985) Geology of the Tanama and Helecho porphyry copper
deposits and their vicinity: professional paper no. 1327, US Geological Survey. Government Printing Office, Washington, p 59
Cox DP, Singer DA (1988) Distribution of gold in porphyry copper deposits, U.S. Geological Survey Open File Report 88-46 Crerar DA, Barnes HL (1976) Ore solution chemistry, part 5. Econ
Geol 71:772–794
Dilles JH, Proffett JM (1995) Metallogenesis of the Yerington batholith, Nevada. In: Pierce FW Bolm JG (eds) Porphyry copper deposits of the American Cordillera, Tucson. Arizona Geol Soc Digest 20:306–315
Driesner T, Geiger S (2007) Numerical simulations of multiphase fluid flow in hydrothermal systems. In: Liebscher A, Heinrich CA (eds) Fluid–fluid interactions. Rev Mineral Geochem 65:187–212 Driesner T, Heinrich CA (2007) The system H2O–NaCl. Part I: correlation formulae for phase relations in temperature–pressure– composition space from 0 to 1000°C, 0 to 5000 bar, and 0 to 1 XNaCl. Geochim Cosmochim Acta 71:4880–4901
Eastoe CJ (1978) A fluid inclusion study of the Panguna porphyry copper deposit Bougainville, Papua New Guinea. Econ Geol 73:721–748
Eastoe CJ (1982) Physics and chemistry of the hydrothermal system at the Panguna porphyry copper deposit, Bougainville, Papua New Guinea. Econ Geol 77:127–153
Fournier RO (1999) Hydrothermal processes related to movement of fluid from plastic into brittle rock in the magmatic–epithermal environment. Econ Geol 94:1193–1211
Gammons CH, Williams-Jones AE (1997) Chemical mobility of gold in the porphyry–epithermal environment. Econ Geol 92:45–59 Garwin S (2002) The geology of intrusion-related hydrothermal
systems near the Batu Hijau porphyry copper–gold deposit, Sumbawa, Indonesia. In: Goldfarb R, Nielsen R (eds) Global exploration 2002: integrated methods for discovery. Rev Econ Geol Spec Publ 9:333–366
González-Partida E, Levresse G (2003) Fluid inclusion evolution at the La Verde porphyry copper deposit, Michoacan, Mexico. J Geochem Explor 78–79:623–626
Gustafson LB, Hunt JP (1975) The porphyry copper deposit at El Salvador, Chile. Econ Geol 70:857–912
Halter WE, Pettke T, Heinrich CA (2002) The origin of Cu/Au ratios in porphyry-type ore deposits. Science 296:1844–1846 Hedenquist JW, Arribas A Jr, Reynolds TJ (1998) Evolution of an
intrusion-centered hydrothermal system: Far Southeast–Lepanto porphyry and epithermal Cu–Au deposits, Philippines. Econ Geol 93:373–404
Heinrich CA (2005) The physical and chemical evolution of low-salinity magmatic fluids at the porphyry to epithermal transition: a thermodynamic study. Miner Depos 39:864–889
Heinrich CA, Günther D, Audétat A, Ulrich T, Frischknecht R (1999) Metal fractionation between magmatic brine and vapor, determined by microanalysis of fluid inclusions. Geology 27:755–758
Heinrich CA, Driesner T, Stefánsson A, Seward TM (2004) Magmatic vapor contraction and the transport of gold from the porphyry environment to epithermal ore deposits. Geology 32:761–764
Heinrich CA, Halter WE, Landtwing MR, Pettke T (2005) The formation of economic porphyry copper(–gold) deposits: con-straints from microanalysis of fluid and melt inclusions. Geol Soc Lond Spec Publ 248:247–263
Henley RW, McNabb A (1978) Magmatic vapor plumes and groundwater interaction in porphyry copper emplacement. Econ Geol 73:1–20
Herrington RJ, First DM, Kozelj D (2003) Copper porphyry deposits in Hungary, Serbia, Macedonia, Romania and Bulgaria. In: Kelly JG, Andrew CJ, Ashton JH, Boland MB, Earls G, Fusciardi L, Stanley G (eds) Europe’s major base metal deposits. Irish Association for Economic Geology, Dublin, pp 303–321 Hezarkhani A, Williams-Jones AE, Gammons CH (1999) Factors
controlling copper solubility and chalcopyrite deposition in the Sungun Porphyry Copper Deposit, Iran. Miner Depos 34:770– 783
Imai A (2001) Generation and evolution of ore fluids for porphyry Cu–Au mineralization of the Santo Tomas II (Philex) deposit, Philippines. Resour Geol 51:71–96
Imai A (2005) Evolution of hydrothermal system at the Dizon porphyry Cu–Au deposit, Zambales, Philippines. Resour Geol 55:73–90
Kay SM, Mpodozis C (2002) Magmatism as a probe to the Neogene shallowing of the Nazca Plate beneath the modern Chilean flat-slab. J South Am Earth Sci 15:39–57
Kesler SE (1973) Copper, molybdenum and gold abundances in porphyry copper deposits. Econ Geol 68:106–112
Kesler SE, Chryssoulis SL, Simon G (2002) Gold in porphyry copper deposits: its abundance and fate. Ore Geol Rev 21:103–124 Kesler SE, Fortuna J, Ye ZJ, Alt JC, Core DP, Zohar P, Borhauer J,
Chryssoulis SL (2003) Evaluation of the role of sulfidation in deposition of gold, Screamer section of the Betze–Post Carlin-type deposit, Nevada. Econ Geol 98:1137–1157
Kirby SH (1985) Introduction and digest to the special issue on chemical effects of water on the deformation and strength of rocks. J Geophys Res 89:3991–3995
Kirkham RV, Sinclair WD (1995) Porphyry copper, gold, molybde-num, tungsten, tin, silver. In: Eckstrand OR, Sinclair WD, Thorpe RI (eds) Geology of Canadian mineral deposit types. Geological Survey of Canada, Geology of Canada 8:421–446
Klemm LM, Pettke T, Heinrich CA, Campos E (2007) Hydrothermal evolution of the El Teniente deposit, Chile: porphyry Cu–Mo ore deposition from low-salinity magmatic fluids. Econ Geol 102:1021–1045
Kojima S (2005) Copper minerals occurring in Chilean porphyry copper deposits and their formational environments. Shigen Chishitsu 55:77–85 (in Japanese with English abstract) Koukharsky M, Mirré JC (1976) Mi Vida prospect: a porphyry
copper-type deposit in northwestern Argentina. Econ Geol 71:849–863
Lang JR, Eastoe CJ (1988) Relationships between a porphyry Cu-Mo deposit, base and precious metal veins, and Laramide intrusions, Mineral Park, Arizona. Econ Geol 83:551–567
Lang JR, Stanley CR, Thompson JFH (1995) Porphyry copper–gold deposits related to alkalic igneous rocks in the Triassic–Jurassic arc terranes of British Columbia. In: Pierce FW Bolm JG (eds) Porphyry copper deposits of the American Cordillera, Tucson. Arizona Geol Soc Digest 20:219–236
Landtwing MR, Dillenbeck ED, Leake MH, Heinrich CA (2002) Evolution of the breccia-hosted porphyry Cu–Mo–Au deposit at Agua Rica, Argentina: progressive unroofing of a magmatic hydrothermal system. Econ Geol 97:1273–1292
Landtwing MR, Pettke T, Halter WE, Heinrich CA, Redmond PB, Einaudi MT, Kunze K (2005) Copper deposition during quartz dissolution by cooling magmatic–hydrothermal fluids: the Bing-ham porphyry. Earth Planet Sci Lett 235:229–243
Lindgren W, Ransome FL (1906) Geology and gold deposits of the Cripple Creek District, Colorado. Professional paper no. 54. US Geological Survey. Government Printing Office, Washington, p 516
Loucks RR, Mavrogenes JA (1999) Gold solubility in supercritical hydrothermal brines measured in synthetic fluid inclusions. Science 284:2159–2163
MacDonald GD, Arnold LC (1994) Geological and geochemical zoning of the Grasberg Igneous Complex, Irian Jaya, Indonesia. J Geochem Explor 50:143–178
Masterman GJ, Cooke DR, Berry RF, Walshe JL, Lee AW, Clark AH (2005) Fluid chemistry, structural setting, and emplacement history of the Rosario Cu–Mo porphyry and Cu–Ag–Au epithermal veins, Collahuasi District, Northern Chile. Econ Geol 100:835–862
Muntean JL, Einaudi MT (2000) Porphyry gold deposits of the Refugio district, Maricunga belt, northern Chile. Econ Geol 95:1445–1473
Nagaseki H, Hayashi K (2008) Experimental study of the behavior of copper and zinc in a boiling hydrothermal system. Geology 36:27–30
Ossandon GC, Freraut RC, Gustafson LB, Lindsay DD, Zentilli M (2001) Geology of the Chuquicamata Mine: a progress report. Econ Geol 96:249–270
Oyarzún R, Marquez A, Lillo J, Lopez I, Rivera S (2001) Giant versus small porphyry copper deposits of Cenozoic age in northern Chile: adakitic versus normal calc-alkaline magmatism. Mineral Depos 36:794–798
Padilla-Garza RA, Titley SR, Eastoe CJ (2004) Hypogene evolution of the Escondida porphyry copper deposit, Chile. Soc Econ Geol Spec Publ 11:141–165
Perello J, Cox D, Garamjav D, Sanjdorj S, Diakov S, Schissel D, Munhbat T-O, Oyun G (2001) Oyu Tolgoi, Mongolia: Silurian– Devonian porphyry Cu–Au–(Mo) and high-sulfidation Cu min-eralization with a Cretaceous chalcocite blanket. Econ Geol 96:1407–1428
Pokrovski GS, Roux J, Harrichoury J-C (2005) Fluid density control on vapor–liquid partitioning of metals in hydrothermal systems. Geology 33:657–660
Pokrovski GS, Anastassia Yu, Borisova AY, Harrichoury J-C (2008) The effect of sulfur on vapor–liquid fractionation of metals in hydrothermal systems. Earth Planet Sci Lett 266:345–362 Proffett JM (1979) Ore deposits of the western United States: a
summary: Nevada Bureau of Mines and Geology Report 33, IAGOD 5th Quadrennial Symposium Proceedings 11:13–32 Pudack C, Halter WE, Heinrich CA, Pettke T (2009) Evolution of
magmatic vapor to gold-rich epithermal liquid: the porphyry to epithermal transition at Nevados de Famatina, Northwest Argentina. Econ Geol 104:449–477
von Quadt A, Peytcheva I, Fanger L, Heinrich CA (2005) The Elatsite porphyry Cu–Au deposit, Bulgaria. Ore Geol Rev 27:128–129
Recharsky VI (1980) Geochemistry of copper–molybdenum deposits of the Lesser Caucasus. In: Janković S, Sillitoe RH (eds) European copper deposits: Proceedings of the International Symposium held at Bor, Yugoslavia, Sept. 1979, Belgrade, Department of Economic Geology, Faculty of Mining and Geology, Belgrade University, pp 104–108
Redmond PB, Einaudi MT, Inan EE, Landtwing MR, Heinrich CA (2004) Copper deposition by fluid cooling in intrusion-centered systems: new insights from the Bingham porphyry ore deposit, Utah. Geology 32:217–220
Reich M, Parada MA, Palacios C, Dietrich A, Schultz F, Lehmann B (2003) Adakite-like signature of Late Miocene intrusions at the Los Pelambres giant porphyry copper deposit in the Andes of central Chile: metallogenic implications. Miner Depos 38:876– 885
Richards JP (1992) Magmatic–epithermal transitions in alkalic systems: Porgera gold deposit, Papua New Guinea. Geology 20:547–550
Richards JP (2003) Tectono-magmatic precursors for porphyry Cu– (Mo–Au) deposit formation. Econ Geol 98:1515–1533 Roedder E (1981) Natural occurrence and significance of fluids
indicating high pressure and temperature. Phys Chem Earth 13:9–39
Rohrlach BD, Loucks RR (2005) Multi-million-year cyclic ramp-up of volatiles in a lower crustal magma reservoir trapped below the Tampakan Cu–Au deposit by Mio-Pliocene crustal compression in the Southern Philippines. In: Porter TM (ed) Super porphyry copper and gold deposits, a global perspectives 2. PGC, Linden Park, pp 369–407
Ronacher E, Richards JP, Reed MH, Bray CJ, Spooner ETC, Adams PD (2004) Characteristics and evolution of the hydrothermal fluid in the north zone high-grade area, Porgera gold deposit, Papua New Guinea. Econ Geol 99:843–867
Rui Z, Zhang L, Wu CY, Wang L, Su X (2005) Dexing porphyry copper deposits in Jiangxi, China. In: Porter TM (ed) Super porphyry copper and gold deposits, a global perspectives 2. PGC, Linden Park, pp 409–422
Rusk BG, Reed MH, Dilles JH (2008) Fluid inclusion evidence for magmatic-hydrothermal fluid evolution in the porphyry copper– molybdenum deposit at Butte, Montana. Econ Geol 103:307–334 Schroeter TG (1995) Porphyry deposits of the Northwester Cordillera of North America, vol 46. Canadian Institute of Mining, Metallurgy and Petroleum, Montreal
Seo JH, Guillong M, Heinrich CA (2009) The role of sulfur in the formation of magmatic–hydrothermal copper–gold deposits. Earth Planet Sci Lett 282:323–328
Sillitoe RH (1979) Some thoughts on gold-rich porphyry copper deposits. Miner Depos 14:161–174
Sillitoe RH (1982) Unconventional metals in porphyry deposits. Society of Mining Engineers of AIME Preprint 82-63, pp 13 Sillitoe RH (1994) Erosion and collapse of volcanos: causes of
telescoping in intrusion-centered ore deposits. Geology 22:945– 948
Sillitoe RH (1997) Characteristics and controls of the largest porphyry copper–gold and epithermal gold deposits in the circum-Pacific region. Aust J Earth Sci 44:373–388
Sillitoe RH, Gappe IM Jr (1984) Philippine porphyry copper deposits: geologic setting and characteristics. Committee for Co-ordination of Joint Prospecting for Mineral Resources in Asian Offshore Areas (CCOP), CCOP Technical Publication 14, p 89
Sillitoe RH, Hedenquist JW (2003) Linkages between volcanotectonic settings, ore–fluid compositions, and epithermal precious metal deposits. Soc Econ Geol Spec Publ 10:315–343
Sillitoe RH, Perelló J (2005) Andean copper province: tectonomag-matic settings, deposit types, metallogeny, exploration, and discovery. Society of Economic Geologists, Economic Geology 100th Anniversary Volume, pp 845–890
Simon AC, Pettke T, Candela PA, Piccoli PM, Heinrich CA (2005) Gold partitioning in melt–vapor–brine systems. Geochim Cos-mochim Acta 69:3321–3335
Simon AC, Pettke T, Candela PA, Piccoli PM, Heinrich CA (2007) The partitioning behavior of As and Au in S-free and S-bearing magmatic assemblages. Geochim Cosmochim Acta 71:1764– 1782
Simon G, Kesler SE, Essene EJ, Chryssoulis SL (2000) Gold in porphyry copper deposits: experimental determination of the
distribution of gold in the Cu–Fe–S system at 400° to 700°C. Econ Geol 95:259–270
Sinclair AJ, Drummond AD, Cater NC, Dawson KM (1982) A preliminary analysis of gold and silver grades of porphyry-type deposits in western Canada. In: Levinson AA (ed) Precious metals in the Northern Cordillera. Association of Exploration Geochemists, Rexdale, pp 157–172
Singer DA, Berger VI, Moring BC (2005) Porphyry copper deposits of the world: database, map, and grade and tonnage models. U.S. Geological Survey Open File Report 2005-1060
Stefánsson A, Seward TM (2004) Gold (I) complexing in aqueous sulphide solutions to 500°C at 500 bar. Geochim Cosmochim Acta 68:4121–4143
Su W, Heinrich CA, Pettke T, Zhang X, Hu R, Xia B (2009) Sediment-hosted gold deposits in Guizhou, China: products of wall–rock sulfidation by deep crustal fluids. Econ Geol 104:73– 93
Sutherland Brown A (1976) Porphyry deposits of the Canadian Cordillera of North America, vol 15. Canadian Institute of Mining, Metallurgy and Petroleum, Montreal, p 510
Takenouchi S, Imai H (1976) Fluid inclusion study of the Santo Tomas II porphyry copper deposit. Philippines. Abstracts of
papers of the Fifth International Symposium on Fluid Inclusion Research, Sydney, Australia, Aug. 1976. Fluid Inclusion Re-search: Proceedings of COFFI 8:180–181
Ulrich T, Günther D, Heinrich CA (1999) Gold concentrations of magmatic brines and the metal budget of porphyry copper deposits. Nature 399:676–679
Ulrich T, Günther D, Heinrich CA (2001) The evolution of a porphyry Cu–Au deposit, based on LA-ICP-MS analysis of fluid inclu-sions: Bajo de la Alumbrera, Argentina. Econ Geol 96:1743– 1774
Vila T, Sillitoe RH (1991) Gold rich porphyry systems in the Maricunga belt, northern Chile. Econ Geol 86:1238–1260 Williams-Jones AE, Migdisov AA, Archibald SM, Xiao Z (2002)
Vapor transport of ore metals. In: Hellmann R, Wood SA (ed) Water–rock interactions, ore deposits, and environmental geo-chemistry. Geochem Soc Spec Publ 7:279–305
Williams-Jones AE, Heinrich CA (2005) Vapor transport of metals and the formation of magmatic–hydrothermal ore deposits. Econ Geol 100:1287–1312
Zvezdov VS, Migachev IF, Girfanov MM (1993) Porphyry copper deposits of the CIS and the models of their formation. Ore Geol Rev 7:511–549