LCA Methodology
Ecometrics
LCA Methodology: Ecometrics
EcoDesign and LCA
Survey of Current Uses of Environmental Attributes in Product and Process Development
David Hunkeler, Evdokia Vanakari
Corresponding address: Prof. David Hunkeler, Swiss Federal Institute of Technology, EPFL-Ecublens, CH-1015 Lausanne, Switzerland; e-maih [email protected]
DOh http://dx.doi.orcj/10.1065/Ical 99912.010
Abstract. A survey of designers was carried out to determine to what extent environmental information was being used in the development of products and processes. Twenty-seven designers in five industry categories (process, manufacturing, electronics, construction and automobile) reported mean product design times varying generally from twelve to thirty months. "Ecodesign" gen- erally focused on the manufacturing, use and disposal stages of the product life cycle with material selection, emissions, energy, and recyclability for the principal environmental information employed. Approximately one half of the designers also reported the use of a typical life cycle impact parameter in their product development, with another one-third utilizing stressors includ- ing groundwater pollution, ozone depletion and global warm- ing. A full 85% of the designers considered environmental pa- rameters in their work generally as the result of a corporate policy with larger firms able to influence designers to a greater extent. The willingness to combine technical and economic pa- rameters with environmental attributes was greater for non-du- rable products and designs involving less than two years. Spe- cific preferences of designers within certain product and process groups are discussed. Designers considered electronic tools, with written documentation, as the most appropriate means to im- plement Ecodesign. A strong minority of the design have been limited to less than two days for the consideration of environ- mental information, implying the need to integrate life cycle assessment with validated ecometrics, if significant advances are to be made toward sustainable development.
Keywords: Design for environment; ecodesign; ecometrics; ecoindicators; impact assessment; life cycle management; prod- uct development; process development
Introduction
The application of life cycle assessment (LCA) and related concepts such as waste minimization, pollution prevention, and design for environment has increased in industry over the past five years [1-3]. Specifically, the representation of various corporate functions, such as the accounting, legal and design departments, has supplemented the traditional involvement of the environmental, health and safety (EH&S) divisions [4]. Over one-third of top managers have also re- ported the inclusion in life cycle teams as being up signifi- cantly from similar surveys performed in the mid 1990s. Furthermore, a number of business units which are directly
linked to an enterprise's direct cost, such as production and sales, have expressed a need for life cycle information in order to respond to questions and product requests through- out the supply chain. This has been observed in Europe, North America as well as in Japan [5]. As far as the authors are aware, none of these surveys have focused explicitly on designers. The present study was oriented at the design-LCA interface with the specific objective of ascertaining what type of environmental information designers of various products were using or required in different industry sectors. A sec- ond general objective was the determination of the time avail- able for EcoDesign as a function of various product and market attributes and the form designers preferred the envi- ronmental information. The survey can be provided upon request from the author 1.
1 Methodology
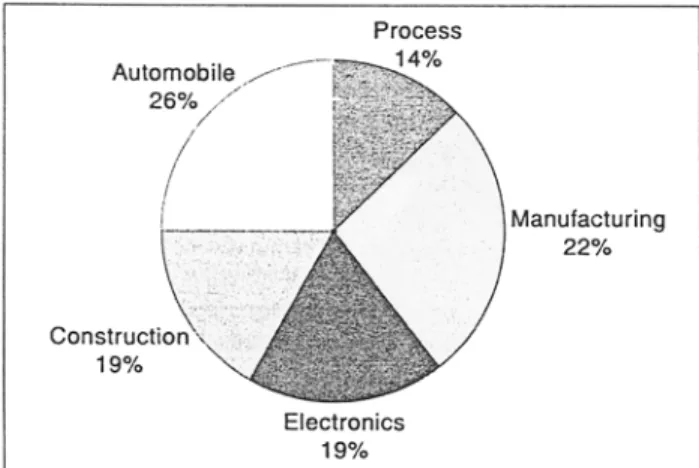
Eighty-rive surveys were mailed to product and process de- signers between June 1998 and March 1999. Responses were categorized into the following industrial sectors, with the number of replies indicated in parenthesis: process (4), manu- facturing (6), electrical (5), construction (5) and automotive (7). Prior to mailing, telephone contact with the firm was established to identify full-time designers in all cases. A con- fidential survey was then mailed, either in English or French, directly to the designer. The respondents from Europe, North America and Japan were given their choice of language. The authenticity of the translation was verified independently. A total of twenty-seven completed questionnaires were re- turned. Two other designers provided general corporate in- formation, but did not complete the questionnaire. These were systematically excluded from the analysis. In two other situations, the questionnaire had be passed to an EH&S of- ricer. These completed responses were also excluded from the statistical tabulation. The authors attribute the unusu- ally high response rate (32%) as being due to the telephone pre-contact. Reminders were also mailed to designers after three months. Fig. 1 illustrates the distribution of responses according to the rive industry categories. Table 1 lists the specific products designed by the respondents. With the ex- ception of the oil and food/drug sectors, replies were ob- tained from designers in all categories initially planned. Ta- 1 e-maih david.hunkeler@ epfl.ch
ble 1 illustrates that the designers come from a wide variety of industries with products including high technology, multicomponent systems (jet engines, automotive) as well as typical process industries such as chemical, pharmaceutical and water treatment. Component manufacturers were also sampled including designers of semi-conductors and fuel cells. Manufactured items such as air conditioners, mobile telephones and elevators also constituted a focus of the survey. The de- signers of durable goods including homes, office, R&D facili- ties, as well as raw material-based products including plastics, metal formed objects and solder, were also represented. The overall objective of a broad-based survey was achieved with a relatively equal distribution between sectors. This has permit- ted the discussion of designer preferences and needs accord- ing to industrial sector as well as product attributes, as will be demonstrated in the following sections.
Fig. 1 : Responses from various industrial sectors Table 1: Products designed by survey respondents
dian is likely to be a more representative meter for this sta- tistic. Typically, process and manufacturing based designs required twelve months, though the range was rather exten- sive (3-60 months). In the electronics industry, design times were the shortest, as would be expected with a lower vari- ance reported. Construction and automobiles required de- sign cycles between two and three years with a maximum of four years reported by three designers. The design pressures on the automotive industry are evident in the ratio of the product lifetime to the design cycle, with a typical value of 5 indicating a high turnover due to a combination of techno- logical advances, particularly in mechanical and aerodynamic areas, environmental restrictions and customer preference. As would be expected, manufactured products had long lifetimes while design traditions in the building industry changed less rapidly due to the extreme durability, particularly in Europe. Over half of the designers (52%) reported that the primary user of their design was another firm, with 41% of these de- signers focusing on a product which will be sold directly to the public. The later principally included home and simple products such as batteries. Designers working within their supply chain were virtually exclusively dedicated to multi-com- ponent, mechano-electrical products such as automobiles, jet engines and electronics. Several designers were engaged in more than one type of activity. Interestingly, only 22% reported that they were dedicated to strictly internal products, an indica- tion that outsourcing and focusing on core competencies are strongly routed in the large firms completing this survey. Prior to discussing the results, the authors wish to state that one in- herent bias in the interpretation of this, and all surveys, is that the sample respondents are assumed to be representative. Given that there was no obvious distortion in responses from a given sector, the authors find this approximation reasonable.
Process industries Manufacturing industry Electronic goods Construction Automobile
Industries Industry Chemical plants Pharmaceutics Solder paste Waste treatment Air conditioners Aircraft engines Batteries Elevators Extruders Fuel cells Cables Mobile phones Semiconductors Telecom devices Homes Office buildings R&D Labs Theaters Automobiles Metal parts Plastic parts 2 Survey Results 2.1 General information
Table 2 summarizes the mean and median design times for the various sectors, along with the ratio of the product life- time to the length of the design cycle. Due to isolated indi- vidual product designs, which skewed the average, the me-
2.2 Stressors applicable to design
Fig. 2 (---) p. 147) summarizes the responses to a question which elucidated the extent to which various environmental stressors were considered in product design. Four catego- ries of parameters are evident. A full 93% of the designers reported the consideration of material selection in product
Table 2: Design time and its relationship to product duration for the various sectors analyzed
Industrial sector Median design Mean design time Ratio of product duration to
time (months) design time:
(months) low-high (median)
Process 12 22 3-35 (10) Manufacturing 12 26 Electronics 12 15 3-20 (7) Construction 24 29 33-67 (50) Automobile 30 35 3-7 (5)
146
Int. J. LCA 5 (3) 2000LCA Methodology
Ecometrics
or process development followed by 63% of the respond- ents who used energy as a design constraint. A series of vari- ables including the recycled material ratio, temperature, as well as atmospheric, solid waste and liquid discharges dur- ing production, were important to approximately one-half of the designers. The pressure during manufacturing and use was considered by a strong minority of respondents (30%), predominantly due to worker safety concerns in manufacturing and, to a lesser extent, transport.
Material Selection (93%) Energy Use (63%) Recycled Material Ratio (56%)
Temperature (56%) Atmospheric Emissions (52%) Solid Waste (48%) Liquid Discharges (44%) Utility Use (44%) Pressure (30%)
Fig. 2: Designer utilization of various environmental stressors in prod-
uct and process development
The material selection is clearly important in all five sectors. However, the other LeA-related parameters demonstrated a strong product-specificity. For example, energy use was most important in the manufacturing and construction in- dustry, with the recycle ratio and process temperature being dominated by responses from producers of manufactured products. Process discharges were important in all sectors, but supplemental comments appended by designers the pri- mary design variables in products were not indicated under any situations. Automobile developers considered the larg- est number of variables in product development with more than half of all respondents reporting that they made use of every listed parameter other than temperature and pressure. When asked to list environmental variables considered in the design other than those to which they were prompted, respond- ents indicated that economics, product performance, durabil- ity and waste minimization were crucial. Other attributes noted
included product-based variables such as weight and shelf life. The energy efficiency in the use phase as well as process indi- cators including m a n u f a c t u r i n g time, noise and waste recyclability were reported as well. The potential for biologi- cal treatment was also mentioned by one designer.
2.3 Restrictions considered in design
Designers volunteered that internal black or gray lists were the most common restrictions to product and process devel- opment. Cost and legislation were also frequently reported, particularly in the process industry. Product and process characteristics such as the use of toxic materials, heavy met- als, hazardous substances, corrosive chemicals and VOCs were also common. External customer based factors, as well as aspects related to product durability and quality, were reported by approximately 10% of the respondents. End of life issues including recyclability, degradation products and landfill volume were also reported to be used in the design of automobiles and electronics.
2.4 Availability and applicability of environmental information
Table 3 summarizes the designers' access to product based life cycle information as well as their consideration of it in development. The percentages do not in all cases amount to a sum of 100 as some questionnaires were returned incom- plete 2. The composition and number of components in the product were utilized by virtually all designers as an input variable with only approximately 10% of the designers re- porting a lack of information in this regard. Product dura- bility was also important for 92% of the respondents, 76% of w h o m had access to such information. The principal needs for information layed in access to end-of-life parameters such as recyclability, reusability, toxicity, as well as in process
2 This is true in general for the results since some respondents left selected
questions blank or chose more than one alternative.
Table 3: Availability and applicability of material, product and package related data toward product design
Product Percentage of designers Percentage of designers Percentage of designers Percentage of designers who characteristic having access to noting applicability but noting a lack of did not understand the
information lacking access to applicability question
informaton Product composition 81 11 4 4 Components used 81 11 4 4 Product durability 71 15 4 4 Toxicity 52 26 11 4 Transportation distance 52 11 26 4 Recyclability 41 41 11 4 Reusability 41 26 22 4 Radiation or 41 11 37 4 hazardous property of material Material intensity 37 15 19 26 Biodegradability 26 22 37 11 --Radiation or hazardous 26 22 33 15 property of waste
waste characteristics. Interestingly, while 37% of the design- ers found MIPS important, predominantly for products with heavy use-phase burdens such as automobiles, 41% found it either unnecessary or were unfamiliar with the concept. The main variables which were deemed unimportant were the hazardous property information and biodegradability, with only process designers routinely noting their inclusion as parameters. The lack of widescale applicability is prob- ably due to a lack of information exchange between engi- neering and EHS departments. Transportation distance was a variable used strongly by over half of the designers, prin- cipally in the automobile and manufacturing sectors, though 26% of the respondents did not consider it. Recyclability was most strongly considered by designers of high visibility consumer products such as electronics. However, despite its importance, many involved in new product development lacked access to this information.
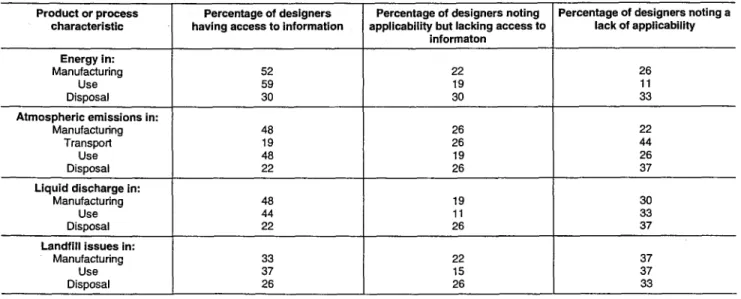
Table 4 categorizes the use of energy and emissions-related issues in product and process development. Energy as well as discharges in the manufacturing and use stages are con- sidered by approximately one-half of the designers. How- ever, only 19% of the designers reported with a slightly higher number utilizing disposal (25%) with regard to transporta- tion. Automobile designers most frequently reported utiliz- ing non-manufacturing life cycle stages in product develop- ment. A full one-third of the designers found atmospheric, liquid discharge and solid waste issues to be inapplicable, with another quarter not having access to such information, not even in the manufacturing stage (-~ Table 5). This has to be viewed as a somewhat alarming statistic and should concern those in the LCA area who realize that the ability for environmental improvement requires consideration early in the product life cycle. One can, however, view the results of this question quite positively since 50% of the designers either claimed at least one green variable to us or were frus- trated by not having access to sufficient information. Table 6 (--~ p. 149) summarizes the use of environmental and social impacts, which are traditionally components of LCAs, in product and process design. Clearly, while approxi-
Table 4: Availability and applicability of energy and emission-related data
Table 5: Applicability of energy and emission data as a function of life
cycle stage
Life cycle stage Percentage of designers
considering an energy or emission-based stressor Manufacturing 46 Transportation 19 Use 47 Disposal 25
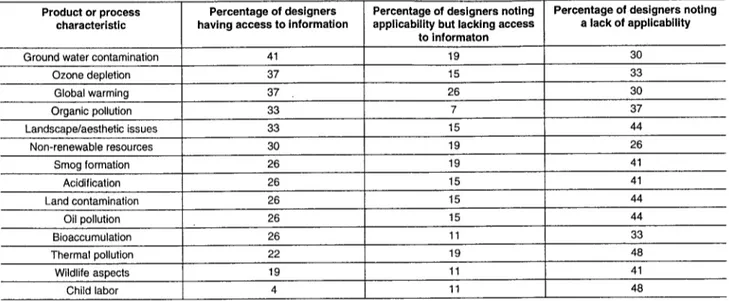
mately one-half of the impact categories are not extensively considered by designers, groundwater contamination (41%), ozone depletion (37%), global warming (37%), organic pollution (33%) and landscape related issues (33%) are rela- tively popular, indicating a much larger awareness of LCA issues than was reported only three years ago [4,5]. These results are likely to be valid since 85% of the designers re- sponded that they would be interested in further utilizing environmental parameters in the product and process devel- opment. Considering that the responses were anonymous, this is a rather large value. Furthermore, 67% of the design- ers reported that their firms had expressed interests in "look- ing green". The latter statistic is higher than has been re- ported in previous surveys of global enterprises [1-4]. Therefore, one-third to one-half of the designers who do not believe that impact assessment can be a meaningful com- ponent of their product or process development are likely to object to the length of time required for an LCA and the lack of rapid ecometrics for product assessment [6].
2.5 Motivation for Considering Environmental Parameters
Table 7 (---~ p. 149) summarizes the main reasons given by designers to consider environmental information in their de- sign. The overwhelming motivation for environmental param- eter adoption as part of the design process is the presence of a corporate policy (81%). A series of secondary factors, cited by approximately one half of the designers included the pres- ence of a corporate EMS, LCA implementation within the
toward product design
Product or process characteristic Energy in: Manufacturing Use Disposal
Atmospheric emissions in:
Manufacturing Transport
Use Disposal
Liquid discharge in:
Manufacturing Use Disposal
Landfill issues in:
Manufacturing Use Disposal
Percentage of designers having access to information
52 59 30 48 19 48 22 48 44 22
Percentage of designers noting applicability but lacking access to
informaton 22 19 30 26 26 19 26 19 11 26 33 37 26 22 15 26
Percentage of designers noting a lack of applicability 26 11 33 22 44 26 37 30 33 37 37 37 33
148
Int. J. LCA 5 (3) 2000LCA Methodology
Ecometrics
Table 6: Availability and applicability of traditional life cycle impact categories. Toward product and process design
Product or process Percentage of designers Percentage of designers noting Percentage of designers noting characteristic having access to information applicability but lacking access a lack of applicability
to informaton
Ground water contamination 41 19 30
Ozone depletion 37 15 33 Global warming 37 26 30 Organic pollution 33 7 37 Landscape/aesthetic issues 33 15 44 Non-renewable resources 30 19 26 Smog formation 26 19 41 Acidification 26 15 41 Land contamination 26 15 44 Oil pollution 26 15 44 Bioaccumulation 26 11 33 Thermal pollution 22 19 48 Wildlife aspects 19 11 41 Child labor 4 11 48
Table 7: Designers' reasons for incorporating environmental param-
eters in design
Reason for incorporation Percentage of designers responding positively
Firm has an environmental policy 81
Firm has an EMS 48
Firm uses LCA 48
Customer pressure 48
Marketing 48
Comparison within product group 48 Current or pending legislation 44 Community group pressure 22
NGO pressure 15
Supply chain pressure 15
firm, current and pending legislation, requirements from within the product group, as well as marketing and customer pressure. The breadth of issues considered by designers is certainly impres- sive and indicates that design is integrated across corporate func- tions, including legal and sales, to a much larger extent than was observed in the early 1990s [1].
2.6 Time spent using environmental information
Table 8 summarizes the time that product and process de- velopers had at their disposition to consider environmental information during the design cycle. The responses were di- vided into three categories. Thirty-one percent of the de- signers do not know the length of time the environmental information would remain acceptable for their use, indicat- ing a lack of experience. These principally included those developing products with short life cycles in highly com- petitive multinational industries such as electronics. Twenty- nine percent of the designers, principally from sectors with longer development cycles such as the automobile industry, noted that they would spend as long as needed with envi- ronmental information. Certainly, the development of LCA policies throughout their supply chain, such as Volvo's, as well
as the creation of corporate and industry-wide LCA related teams, some of which are developing a software, has had an impact on how designers think. A statistic which is quite im- portant to the issue of sustainable development is the 33% of designers who would use environmental information in their design if it was available in a rapidly deployable form requir- ing less than two days. Therefore, the DFE teams advocated by Graedel [7], as well as life cycle validated ecometrics [8], are likely to be required if environmental burdens are to be reduced by design stage modifications.
Table 8: Time designers have available to incorporate environmental
information
Time Percent of designers
responding < 1 day 7 1-2 days 26 > 2 days 7 As long as needed 29 Uncertain 31 2.7 F o r m a t for e n v i r o n m e n t a l i n f o r m a t i o n
Table 9 categorizes designer preference for environmental information. Electronic databases and integrated software are preferred by over half of the designers. However, 37% of the respondents also wanted a hardcopy document, a trend that many multinationals with a diverse product line have already followed.
Table 9: Designer format preference for environmental information
Format for Percent of Precent of
environmental designers preferring designers preferring
information a hardcopy an electronic form
Document 37 24
Data base 3 59
Table or graph 14 37
3 Discussion and Statistical Interpretation
Prior to the mailing of the survey, six hypotheses were made. The null hypotheses are summarized below:
1. There is no dependence between the industrial sector and an interest to take environmental parameters into ac- count.
2. There is no dependence between product lifetime and design time.
3. There is no dependence between industrial sector and design time.
4. There is no dependence between design time and an in- terest to take environmental parameters into account. 5. There is no dependence between product lifetime and
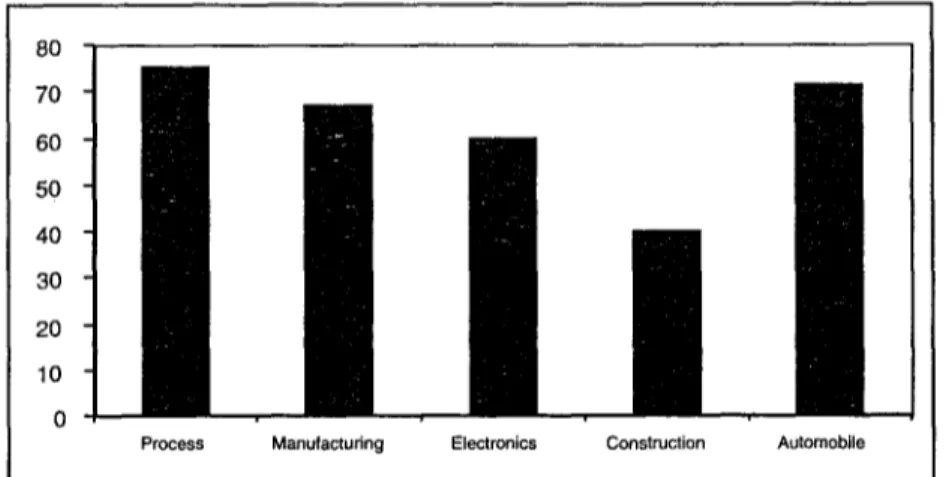
interest to take environmental parameters into account 6. There isno dependence between the size of the firm and interest to take environmental parameters into account Fig. 3 summarizes the firms response in regard to interest considering environmental information in design as a func- tion of the industrial sector. As with all the hypotheses, the limited number of responses did not permit the rejection of the null hypothesis at a 5% significance level (& = 0.05). The only noticeable trend in Fig. 3 is that architects con- sider life cycle environmental information less frequently, with all manufacturing sectors expressing a similar interest (60-75 %). Architects, however, did report the use of life cycle thinking during urban planning projects.
by the manufacturing and electronics industry and the du- rable products and facilities developed for the automobile, process and construction industries. The design threshold appears to be two years, below which 89% of non-durable products can be developed in contrast to only 50% of dura- bles (results not significant). When this is combined with the fourth hypothesis (-~
Fig. 4c)
it is obvious that sectors producing durable goods are less likely to consider environ- mental attributes in their design, perhaps due to a slower(a)
(b)
Design Time (y) Product Life (y) < 2 > 2
> 20 4 3
Design Time (y)
Sector < 2 > 2
Non-Durables I 8 I 1 I
Durables 6 6
Take Environment Into Account?
Design Time (y) Yes No
> 2 3 4
(c)
Fig. 4: Data of cross-tabulation correlating (a): product lifetime and design cycle time, (b): industrial sector and design time, and (c) de- sign time and willingness to consider environmental information
80 70 60 50 40 30 20 10 0
Process Manufacturing Electronics Construction Automobile
Fig. 3: Designer's willingness to consider environmental parameters as a function of industrial sector Fig. 4 (a-c) present %2 data for the design time as a function
of product lifetime, industrial sector, and willingness to con- sider environmental parameters in product or process de- velopment. From Fig. 4a, a slight, non-significant, positive correlation exists between product and design time. Approxi- mately one-half of the designers complete the design within two years with a product or process lifetime of less than twenty years. However, approximately one-third of the de- signers are involved in processes requiring more than two years, with these principally being architects and those de- veloping automobiles.
It is not surprising that, as shown in Fig. 4b, there are differ- ences in design time between non-durable goods supplied
turnover in the production. The consumers "visibility" of durable products and facilities also tends to be much lower than highly packaged manufactured or electronic products. Therefore, 85 % of the designers working with a cycle shorter than two years consider environmental attributes in their development compared to only 43 % of designers requiring longer than two years (results not significant). The latter virtually consists of architects, process development engi- neers and automobile designers alone.
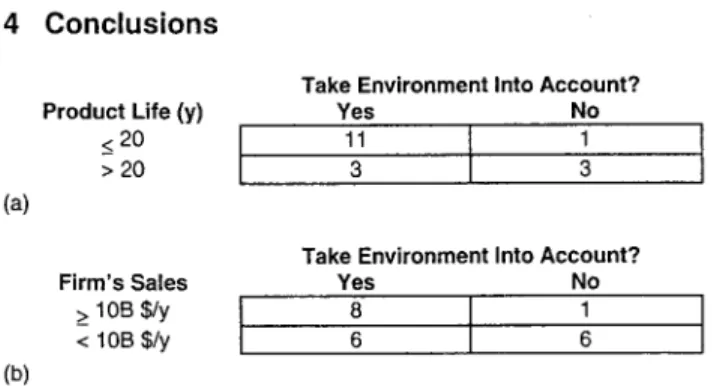
Fig. 5 (a) illustrates that 92% of the designers working on products or processes with economic lifetimes of less than 20 years consider environmental parameters in their devel- opment compared with 50% of those designing durable
LCA Methodology
Ecometrics
goods (results not significant). Similarly, Fig. 5 (b) illustrates that 67% of the designers working for larger firms (sales of over $US 10 billion per annum) considered the environment in product or process development compared with 50% in smaller firms (results not significant).
4 Conclusions
(a)
Product Life (y)
_< 20 > 20
Firm's Sales
> 10B $/y < 10B $/y
Take Environment Into Account?
Yes No
11
I
1
3 3
Take Environment Into Account?
Yes No
8 1
6 6
(b)
Fig. 5: Data cross-tabulation correlating (a): product lifetime and will-
ingness to consider environmental information and (b): firm size and willingness to consider environmental information Evidence of the utilization of life cycle thinking as a minor component of the design process of high tech products was evident across industrial sectors. Ecodesign variables gener- ally focussed on the production (MIPS, emissions), use (en- ergy) or disposal (recyclability) stages of the life cycle with transport and extraction generally ignored. Approximately fifty percent of the designers utilized at least one life cycle impact category in product or process development, although stressors were only considered by approximately one-third of the designers. However, a further 20% reported that they would use additional life cycle impact and stressor informa- tion if it were available. The interest to carry out life-cycle based ecodesign was greater for non-durable products or processes having a design time of less than two years. De-
signers working for larger firms also had access to more environmental information with a preference to electronic data supplemented by printed resources.
A c k n o w l e d g e m e n t s . All those completing the survey are grate- fully acknowledged. This work would have been impossible with- out your generosity. One of the authors (DH) would also like to express his thanks to EPFL-based colleagues, in particular Jean- Marie Plancherel, Sebastian Oesch and Damien Tappy, who con- tributed to the selection of respondents for the survey.
References
[1] SULLIVAN, M.S.; EHRENFELD, J.R. (1993): Reducing Life Cycle Environmental Impacts: An Industry Survey of Emerging Tools and Programs. Total Quality Env. Mgt. Winter 1992/93, 143 [2] GLORIA, T.; SAAD, T.; BREVILLE, M.; O'CONNELL, M. (1995): Life
Cycle Assessment: A Survey of Current Implementation. Total Quality Env. Mgt. Spring 1995
[3] VXGON, B.W.; JENSEN, A.A. (1995): Life Cycle Assessment: Data Quality and Databases Practitioner Survey. J. Cleaner Produc- tion 3, 135
[4] HUANG, E.; HUNKELER, D. (1996): An Executive Survey of For- tune 500 Companies as to their Current Practices on Life Cycle Concepts. Total Quality Env. Mgt. Winter 1995/96,36 [5] HUNKELER, D.; HUANG, E. (1996): LCA in Japan: An Overview
of Current Practices and Trends Relative to the USA. Environ- mental Quality Management, Autumn 1996, 86
[6] HUNKELER, D. (1999): Ecometrics for Life Cycle Management: A Conflict Between Sustainable Development and Family Val- ues? Int. J. LCA 4 (5) 291-198
[7] GRAEDEL, T. (1998): Streamlined Life Cycle Assessment. Prentice Hall, Englewood Cliffs, NJ
[8] BISWAS, G.; CLIFT, R.; EHRENFELD, J.; FORSTER, R.; JOLLIET, O.; KNEOPFEL, I.; LUTERBACHER, U.; RUSSELL, D.; HUNKELER, D. (1998): Ecometrics: Identification, Categorization and Life Cycle Vali- dation. Int. J. LCA 3 (4) 184
Received: June 10th, 1999
Accepted: November 29th, 1999
Online Publication: December 2Otb, 1999
ISLCA Corner
]
Ref.: Neefinfoline 05/2000
Dear NEEF Affiliates,
Please note the following activities of the NEEF:
1) REGIONAL CENTRES: NEEF is planning to open several Centers in each state/region of the country. A couple of such Centres have been initiated recently. The Centre at Jabalpur, Madhya Pradesh is fully operational and is being coordinated by Dr. Sushma Rajput, Dy. Director, NEEF. We welcome Dr. Rajput to the NEEF family and wish a fruitful, mutual association. Other Centres are being planned in Karnataka, Rajasthan, Assam, Manipur, J&K and many other states. All affiliates of NEEF are encouraged to let us know if they themselves or any individual/organisation they know is inter- ested in running such a Centre in any part of India.
2) ECOBRAIN Developed: It is the Environmental Information System developed by the NEEE Designed to provide A to Z information on Ecology, Environment and Development Issues, ECOBRAIN is the first Environment Portal in the country. All affiliates are requested to go through our website: "http://www.neefin.org" for more informa- tion on ECOBRAIN. Now onwards, you are also requested to let us know if you would like to add any information to ECOBRAIN. 3) ADMISSIONS for July 2000: Admissions for Certificate Course,
PG Course, Advance Training Courses, and Ph.D. Programme are
open for July 2000 semester. We would like to remind all that any student recommended by our affiliates is entitled for a 10% dis- count on all fees.
4) EFFORTS for ONLINE Publications: We are trying to make all of the NEEF's publications "Online". Those affiliates having access to Internet can attain these publications at a very highly subsided rate compared to buying hard copies of these publications.
Comments and suggestions from one and all are welcome. With warm regards,
Yours sincerely,
Rakesh Kumar, Manager, NEEF
For further information, please contact: National Ecology and Environment Foundation Post Box No 9020, Mumbai-400063 (iNDIA) T/F: (91-22) 8423844/8405653 Website: http://www.neefin.org E-mails: 1 ) [email protected]; 2) [email protected] 3) islca@ neefin.org;