DEFORESTATION: POLICIES TOWARD A MORE SUSTAINABLE TROPICAL TIMBER INDUSTRY
by
JENNIFER LYNN GRIFFITH
B.S. in Engineering - Environmental, University of Vermont (1984)
Submitted to the
Department of Civil and Environmental Engineering in Partial Fulfillment of the
Requirements for the Degrees of: Master of Science in Technology and Policy
and
Master of Science in Civil and Environmental Engineering at the
MASSACHUSETTS INSTITUTE OF TECHNOLOGY
June, 1993
@
Massachusetts Institute of Technology, 1993 All Rights Reserved1-1%/ 1-7 // /
Signature of Author
technology and Po( Program Mhy 10, 1993 Certified by
Accepted by
Accepted by
Fred Mo enzadeh Professor of Civil and Environmental Engineering
(h
/Thesis SupervisorRichard de Neufville Chairman, Technology and Policy Program Eduardo Kausel Chairman, Departmental Committee on Graduate Studies
DEFORESTATION: POLICIES TOWARD A MORE SUSTAINABLE TROPICAL TIMBER INDUSTRY
by
Jennifer Lynn Griffith
Submitted to the Department of Civil and Environmental Engineering on May 11, 1993 in partial fulfillment of the requirements for the Degrees of:
Master of Science in Civil and Environmental Engineering Master of Science in Technology and Policy
ABSTRACT
Deforestation stands at the heart of the global environmental debate and serves as an example of the complex issues involved. Tropical moist forests are almost exclusively located in developing countries, raising all the issues of the North v South, rich v poor debate. In addition, the tropical moist forests maintain tremendous quantities of biological diversity and are the target of efforts of species and ecosystem protection. The burning of the forest contributes significant quantities of carbon to the atmosphere adding to the debate on the greenhouse effect and global warming. Finally, tropical wood products are traded internationally highlighting the links between trade and the environment. It is within the context of all these issues that the subject of deforestation is discussed and the question of what are the most appropriate policies to implement is addressed in this thesis.
The direct causes of deforestation are outlined: population growth and poverty, market failures and international trade. The thesis then focuses in on the deforestation caused by the international trade of wood products and examines the various options available to both the exporting and importing countries. For exporting countries, these options include: altering or eliminating various subsidies, improving the terms of logging concessions, raising the forest fees to capture the economic rent as well as incorporate the environmental and social costs, establishment of extractive reserves and nature parks, improvement of technology and the strengthening of institutions. For the importing countries options include: import tariffs, quotas, restrictions and bans, labeling of wood products, reducing demand and financing efforts in exporting countries.
After examination of the issues, it is concluded that there is no quick and easy solution to this complex problem. However, there are several options that appear promising, such as: raising forest fees and improving forest management for exporting countries, and elimination of protective tariffs, development of a credible labeling scheme, technology transfer, and debt-forgiveness for importing countries. To be the most effective, coordinated action between importing and exporting nations is required. In several cases, if one acts without the other, the effect on the forest may be to increase deforestation. The most important factor is whether there is the political will to alter the status quo. Thesis Supervisor: Professor Fred Moavenzadeh
ACKNOWLEDGEMENTS
I would like to thank my thesis supervisor, Professor Fred Moavenzadeh, for his extreme patience and continuous support during my struggle to get a grip on this enormous issue. I would also like to express my appreciation to all of my friends for their understanding and support, despite the fact that I largely ignored many of them this year. I am grateful for all those involved with the Technology and Policy Program, their varying points of view have taught me much. I would like to specifically acknowledge Chris Thomas and Keith Eubanks. Without their unending friendship, support, and insightful advice, I may never have finished this thesis, at least not on time! I would especially like to thank Keith for being so supportive as I concentrated on my needs these last few months.
Finally, I would like to dedicate my thesis to the memory of my mother. I miss her everyday. Without her inspiration, I may never have gained the confidence in myself to be at a place like MIT.
CONTENTS Page ABSTRACT ACKNOWLEDGEMENTS CONTENTS FIGURES TABLES FORWARD 1.0 INTRODUCTION 1.1 Types of F 1.1.1 Tr( 1.1.2 Tr( 1.1.3 Te 1.2 Forest Prc 1.2.1 Bic 1.2.2 Gl 1.2.3 Su 1.2.4 Lo 1.2.5 Pr I. II. 1.2.6 Pr 1.2.7 Va 1.3 History an 1.3.1 Afr 1.3.2 As 1.3.3 Eu 1.3.4 Lal Forest )pical Dry opical Moist mperate )visions )logical Diversity obal Ecosystem
stain Human Populations
cal Ecosystem
oduction of Wood Fuel
Commercial
)duction of Non-Wood Products lue of the Forest
d Current Scope of Deforestation
ica ia
rope and North America
tin America and the Caribbean 2.0 CAUSES OF DEFORESTATION
2.1 Population Growth and Poverty 2.1.1 Fuel
2.1.2 Agricultural Conversion 2.2 Market Failures
2.2.1 Property Rights 2.2.2 Discount Rates
I. Characteristics of the Forest
II. Logging in the Forest
16 17 17 18 18 19 20 21 21 23 23 23 24 24 25 26 27 27 28
2.2.3 Subsidy of the Timber Industry
2.2.4 System of National Accounts
2.3 Relationship Between Trade and Deforestation 2.3.1 Dependence of Developing Countries 2.3.2 Demand in Industrialize Countries 2.3.3 Terms of Trade
2.4 International Trade in Forest Products 2.4.1 Logs
2.4.2 Sawnwood
2.4.3 Plywoods and Veneer Sheets
I. Plywood II. Veneer Sheets 2.4.4 Summary
3.0 EXPORTING COUNTRY POLICIES TO IMPACT DEFORESTATION CAUSED BY THE INTERNATIONAL TRADE OF WOOD PRODUCTS 3.1 Subsidies
3.1.1 Low Fees
I. Inflation Impacts
II. Collection Rates (A) Measurement (B) Under-Invoicing (C) Illegal Logging 3.1.2 Road Building
3.1.3 Log Processing Industry I. Export Bans II. Export Quotas
II. Differential Export Tax Structure IV. Financial Incentives
3.2 Logging Concession Terms 3.2.1 Size
3.2.2 Time-Frame
I. Renewable Concessions II. Privatization
3.2.3 Allocation Method 3.3 Basis of Forest Fees
3.3.1 Stumpage Fee I. Per Tree
II. Volume Based IIl. Differentiation 3.3.2 Standing Volume 3.3.3 Area Based
3.3.4 Processed Product Fee 3.3.5 Export Tax
3.4 Incorporate Environmental and Social Costs 3.4.1 Reforestation Deposit MW
Paae
45 46 48 49 50 51 52 54 55 57 57 58 59 69 69 69 70 71 71 72 73 74 75 76 76 77 78 78 78 79 79 80 81 82 82 83 83 84 85 86 86 87 87 883.4.2 Production Tax 3.4.3 Minimum Forest Fee 3.5 Extractive Reserves
3.6 Nature Reserves/Parks 3.7 Technology
3.7.1 Tree Growth
I. Plantations
II. Secondary Growth Management
Ill. Regeneration of Degraded Areas 3.7.2 Harvesting, Transporting and Handling
I. Clear-Cutting
II. Harvesting in Narrow Bands
III. Transport of Logs IV. Directional Felling
V. Improved Storage and Handling VI. Use of More Species
VII. Use of Preservatives 3.7.3 Processing Techniques 3.8 Strengthen Institutions
3.8.1 Increase Skills 3.8.2 Improve Planning
3.8.3 Increase Monitoring and Enforcement 3.8.4 Improve Equipment
3.8.5 Increase Cooperation 3.8.6 Improve Education of Public
4.0 IMPORTING COUNTRY POLICIES TO IMPACT DEFORESTATION
CAUSED BY THE INTERNATIONAL TRADE OF WOOD PRODUCTS 4.1 Import Tariffs
4.1.1 Eliminate Protective Tariffs 4.1.2 Raising Tariffs
4.2 Import Quotas
4.3 Labeling of Wood Products 4.4 Import Restrictions
4.5 Import Bans
4.5.1 Species-Specific
4.5.2 All Tropical Hardwood Products 4.5.3 Tropical Logs
4.6 Reduce Demand
4.6.1 Reduce Unnecessary Uses 4.6.2 Substitute Materials
4.7 Role of International Community in National Efforts 4.7.1 Strengthen Institutions
4.7.2 Technology Transfer 4.7.3 Debt-for-Nature Swaps
4.7.4 Alter Development Assistance
Page 88 89 89 92 94 94 95 96 97 98 98 99 99 100 100 100 101 102 103 103 104 105 105 106 106 107 107 108 108 110 111 112 113 113 114 115 115 116 116 117 118 119 120 122
Page
4.7.5 Alter Calculation of National Accounts 123
4.7.6 Payments for Not Cutting the Forest 125
5.0 CONCLUSIONS AND RECOMMENDATIONS 129
5.1 Exporting Nation Actions 129
5.1.1 Correct Market Distortions 130
I. Raise Timber Harvest Fees 130
II. Subsidies 132
5.1.2 Improve Forest Management 134
5.1.3 Political Stability 137
5.2 Importing Country Policies 138
5.2.1 Elimination of Protective Tariffs 138
5.2.2 Credible Labelling Scheme 139
5.2.3 Use of New Species 140
5.2.4 Promote Markets for Extracted Products 141
5.2.5 Reduce One-Time Uses 142
5.2.6 Alteration of the SNA 142
5.2.7 Technology Transfer 143
5.2.8 Debt Forgiveness and Aid 144
NOTES 146
FIGURES
Page
1.1 Distribution of Forest Types 30
1.2 Distribution of Open and Closed Forests 30
1.3 Locations of Tropical Moist Forests 31
1.4 Biological Diversity Hotspots 32
1.5 Rates of Deforestation/Afforestation 32
2.1 Causes of Deforestation 60
2.2 International Trade: Tropical Non-coniferous Logs 61
2.3 International Trade: Tropical Non-coniferous Sawnwood 62
TABLES
Page
1.1 Total Closed Forest Area and Deforestation Rates for Tropic Countries 33
2.1 Developing Countries that Depend on the Timber Trade 64
2.2 Protective Tariff Rates in Industrialized Countries 66
2.3 Top Exporters and Importers of Tropical Non-coniferous 67 Logs, Sawnwood and Plywood, 1990
FORWARD
The global discussion of environmental issues first attracted widespread attention in 1972 with the United Nations Conference on the Human Environment held in Stockholm, Sweden. When the ten year anniversary of this summit passed, little action had been taken to improve the human environment; in fact, in many places it had gotten much worse. The World Commission on Environment and Development was created by the
United Nations in 1983 to formulate "a global agenda for change." The publication of their
book, Our Common Future, in 1987, was a watershed event in the global environmental arena and the term "sustainable development" was coined. The idea that economic development was necessary, but must be pursued in a manner that is sustainable over the long-term, attracted attention around the globe. Sustainability was equated with the wise use of the environment such that its capacity to support the future needs of the population was not undermined. Global environmental issues and economic development issues were raised to the forefront in 1992 with the United Nations Conference on Environment and Development (UNCED) held in Rio de Janeiro, Brazil.
Our Common Future placed the degradation of the environment throughout the developing world in a context larger than mere population expansion or national government policies.
Over the past few decades, life-threatening environmental concerns have surfaced in the developing world. Countrysides are coming under pressure from increasing numbers of farmers and the landless. Cities are filling with people, cars, and factories. Yet at the same time these developing countries must operate in a world in which the resources gap between most developing and industrial nations is widening, in which the industrial world dominates in the rule-making of some key
international bodies, and in which the industrial world has already used much of the planet's ecological capital. This inequality is the planet's main 'environmental' problem; it is also its main 'development' problem (World Commission on Environment and Development).
The governments of many industrialized nations are not willing to accept this statement, instead pointing the finger of blame at the developing nations themselves; looking merely at population data and technical and economic backwardness. Industrialized countries
enjoy a high standard of living, based upon the consumption of large quantities of resources per capita, and many are not interested in altering their behavior in any fundamental way. For example, look at the debate on global warming that centers on the burning of fossil fuels. The United States, the largest consumer, would have no part in the global climate change treaty brought forth at UNCED that would have set limits on the release on carbon dioxide to the atmosphere.
The industrialized nations, most geographically located in the north, and therefore referred to as "the North", want to import raw materials from the rest of the world to support their high standard of living. This trade pattern was established during the period when many developing nations, most located south of the industrialized nations, and therefore referred to as "the South", were colonies of the North, but it continues to this day. For example, more than 98% of the total export of Bolivia, Ethiopia, Ghana, and Nigeria are primary products, compared with 24% of U.S. exports and only 2% of Japan's (French, 1993). Nations relying on the export of raw materials would like to improve the standard of living of their citizens, however there is scarce capital to allow them to do so. Raw materials are almost always commodity goods that compete on price. Therefore, there is little profit to be made for investment in economic development, especially since the world price of
most commodity items has decreased in real terms over the past two decades. In their attempts to industrialize, many nations of the South borrowed heavily from the North during the 1970's. Many of these projects did not accomplish their objectives; however in order to service the debt, increasing pressure is placed on the environment as it is their main resource from which to draw.
The South, therefore, often blames the North for global environmental issues and its economic plight, wanting the North to decrease its consumption and to alter the terms of trade so it is more equitable. In the context of environmental issues, the North is demanding that the South decrease their exploitation of their natural resources. However, the South counters that the North grew rich by exploiting their resources, as well as those of the South, so why shouldn't they be able to do the same? They see the environmental debate as an attempt by the North to keep the South poor for their continued economic exploitation. The following quote sums up the plight of the South today:
Most of these countries face enormous economic pressures, both international and domestic, to overexploit their environmental resource base... Their roots extend also to a global economic system that takes more out of a poor continent than it puts in. Debts that they cannot pay force... nations relying on commodity sales to overuse their fragile soils... Trade barriers in the wealthy nations... make it hard... to sell their goods for reasonable returns... Aid from donor nations has not only been inadequate in scale, but too often has reflected the priorities of the nations giving the aid, rather than the needs of the recipients... natural resources are now being used not for development but to meet financial obligations to creditors abroad. It requires relatively poor countries simultaneously to accept growing poverty while exporting growing amounts of scarce resources (World Commission on Environment and Development).
There has been an increasing awareness of the inter-linkage between environmental problems in the developing world and the trade policies and consumption of resources in the industrialized world. Unfortunately, many industrialized nations have a vested interest in maintaining the status quo. Therefore, they are concentrating their efforts on such popular global environmental issues as ozone depletion, biodiversity loss, and global warming, rather than the fundamental underlying causes of these problems. However, when one delves into these issues, it is impossible to ignore the linkage between what is
happening at the local level in a developing country and the larger global context that the industrialized world dominates.
Deforestation stands at the heart of the global environmental debate and serves as an example of the complex issues involved. Tropical moist forests are almost exclusively located in developing countries, raising all the issues of the North v South, rich v poor debate. In addition, the tropical moist forests are the home of tremendous quantities of biological diversity and is the target of efforts of species and ecosystem protection. The
burning of the forest contributes significant quantities of carbon to the atmosphere adding to the debate on the greenhouse effect and global warming. Finally, tropical wood products are traded internationally which raises the issues of trade and the environment. It is within the context of all these issues that the subject of deforestation is discussed and the question of what are the most appropriate policies to implement is addressed in this thesis.
1.0 INTRODUCTION
It was estimated by the Food and Agriculture Organization of the United Nations (FAO) in their 1990 assessment of forest resources that the world lost 15.4 million hectares of tropical forests each year from 1980 to 1990. This is a 35% increase above the 11.4
million hectares per year rate estimated in their 1980 forest assessment. During the 1980's, there was increasing attention paid by the international environmental movement to the rapidly increasing rates of deforestation occurring in tropical moist forests around the world. Response by international community at the government level has been largely centered on The Tropical Forest Action Plan (TFAP) developed jointly by the FAO, the United Nations Development Programme (UNDP), the World Bank and the World Resources Institute (WRI) in 1985 and the International Tropical Timber Organization (ITTO) founded by the United Nations in 1987 based upon the International Tropical Timber Agreement (ITTA) of 1983. In addition, numerous non-governmental organizations throughout the world have become involved in the issues ranging from the Rainforest Action Network and the Rainforest Alliance to Friends of the Earth, the World Wildlife
Federation (WWF) and the World Conservation Union (IUCN).
Large areas of tropical moist forests are disturbed for three primary reasons: to provide agricultural land, to supply the timber market and to provide fuel. There is substantial disagreement over the relative contributions of each, however there is no doubt that the largest is the conversion to agricultural land (which includes pasture in this report unless stated separately). The World Bank estimates that roughly 60% is due to agricultural conversion, 20% from timber logging and 20% more gradually by spreading urbanization, the gathering of fuelwood and the construction of roads and dams (World Bank, 1991a). Others cite 64% for agriculture, 18% for logging, 10% for fuelwood and 8% for cattle ranching (Low). Finally, those in the tropical timber business site figures as low as 14%
for logging (Tropical Forest Foundation).
Most deforestation of tropical moist forests is caused by conversion to agricultural land. However, the conversion to agricultural land has its roots in the distribution of land, wealth and power in and among nations. Those are difficult issues to deal with and governments
tend to lack the political will to substantially alter the status quo. Therefore, many groups throughout the industrialized world are focusing in on the more tangible cause of deforestation, logging. It is also something that, as importers, industrialized countries have the power to impact directly. Some environmental organizations have even called for importing nations to ban the import of logs and wood products that were harvested from tropical moist forests.
This thesis focuses on the deforestation caused to provide timber for trade in the market, and more specifically, trade in the world market. National and international actions to make the forest products industry a more sustainable sector and alleviate deforestation problems are presented and evaluated. Finally, the purpose of this thesis is to recommend the most effective policies to be implemented at the national and international levels that would reduce pressure on the tropical forests.
The thesis begins with a description of the various types of forests, the reasons that tropical moist forests are important, and the locations of significant deforestation. Chapter Two outlines the various causes of deforestation and then focuses in on the international trade in tropical timber. Chapter Three presents the policy options available to timber exporting countries and evaluates their potential effectiveness. Chapter Four examines the various policy options available to timber importing countries. Finally, Chapter Five draws conclusions and makes recommendations of the most promising policies to alleviate the deforestation caused by the intemational trade of wood products.
1.1 Types of Forests
Forests cover approximately 3.6 billion hectares, or 28% of the total land area in the world (World Bank, 1991a). It is estimated that in pre-agricultural times, the forested area was 5 billion hectares (WRI, 1990). In addition, today there are approximately 1.7 billion hectares of other wooded area, forest fallows and shrublands, bringing the total to 53 billion hectares of forests and woodlands. Forests and woodlands are generally classified into one of three categories; tropical dry, tropical moist, and temperate. The distribution of these forest types by continent and their total hectares are illustrated on Figure 1.1.
Forests are also classified as open or closed, which refers to the forest canopy. Open forests are those in which tree crowns cover at least 10% of the land and grasslands are continuous. Open forests cover approximately 700 million hectares. Closed forests are those with at least 20% covered by tree crowns and discontinuous grass cover. Closed forests cover 2.9 billion hectares. The distribution of forest between open and closed over the continents is illustrated on Figure 1.2.
Forests can also be classified as coniferous or non-coniferous (broadleaf). This refers to the predominant tree type in the forest. Coniferous trees, generally known as softwoods, are typically fast growing, taking 20 to 30 years to reach marketable size. Examples of conifers are pine, fir and spruce. Approximately 35% of forest worldwide are coniferous. The majority of forests therefore are non-coniferous. Non-coniferous trees are generally known as hardwoods and are typically slow growing, taking 60 years or more to reach good size. Examples of non-coniferous trees are oak, maple, and the dipterocarps of Asia.
1.1.1 Tropical Dry
There are approximately 1.6 billion hectares of tropical dry forests and they are largely characterized as open and non-coniferous with the vegetation consisting mainly of forest fallows and shrublands (World Bank, 1991a). Approximately 75% are located in Africa. The primary use of tropical dry forests are for grazing of livestock and gathering of fuelwood by local populations. Loss of tropical dry forests results in conversion to grasslands or more extremely, desertification.
1.1.2 Tropical Moist
Tropical moist forests are perhaps better known today as the "rainforest". Tropical moist forests are closed canopy forests that receive over 100 millimeters of rain each month for two out of three years with mean temperature of at least 24 C (Low). This temperature and precipitation allows a tremendous growth of vegetation that contains and supports over half of the world's biological diversity. Almost two-thirds of the 1.5 billion hectares of tropical moist forests are located in Latin America, with the other one-third split between
western Africa and eastern Asia (World Bank, 1991a). The locations of tropical moist forests are shown on Figure 1.3. Brazil, Indonesia, and Zaire together contain almost 50% of all remaining rainforests.
Approximately 900 million hectares of the tropical moist forests are considered to be primary forests (virgin), 300 million hectares are secondary forests (disturbed) impacted by human activities such as logging and the remaining 300 million hectares are forest fallow woodlands (World Bank, 1992a). Tropical moist forests are predominately non-coniferous. The soils under the forest tend to be of poor quality and inhibit the ability of the forest to regenerate to its former level of diversity after it is disturbed.
1.1.3 Temperate
The majority of the 2.2 billion hectares of temperate forests and woodlands are located in North America and Europe, including the former Soviet Union. The remaining one-tenth of temperate forests are located in China, southern portions of Latin America and non-european mediterranean areas (World Bank, 1991a). 1.6 billion hectares of temperate forests are considered closed forests. Over 85% of the world's coniferous forests are located in temperate forests (World Bank, 1991a).
Temperate forests have been heavily exploited by man over history and currently supply 85% of the world's non-fuel wood demand (World Bank, 1991 a). Due to their basic nature and also the high level of historical interference, temperate forests do not contain biological diversity at levels comparable with the tropical moist forests. The soils under temperate forests are such that, if they are not washed away through erosion,
regeneration is possible.
1.2 Forest Provisions
Forests provide numerous services to both human activity and the local and global ecosystems. The international community has been concerned primarily with the issues of biological diversity and the forests' role in the global ecosystem. At a more local level,
the forest serves numerous roles, including sustaining human populations, maintaining the local ecosystem, and the production of wood and non-wood products. These services are discussed in the following sections.
1.2.1 Biological Diversity
Forests, particularly tropical moist forests, contain a tremendous number and variety of plant and animal species in their ecosystems. It is estimated that at least half of the world's species live in the tropical moist forests that cover only 7% of the earth's land area.
Biological diversity is typically discussed at three levels: genetic, species and ecosystem. Genetic diversity considers the variety of genetic material available in the individuals of a species. Genetic diversity ensures that there will be "survival of the fittest" and adaption to changes in the surroundings (provided the changes are not too rapid). Species diversity refers to the total number of different species of living organisms. Species diversity provides the "robustness" to adapt to changes in the ecosystem. Finally, ecosystem diversity refers to different types of ecosystems in terms of habitat, interdependence of living organisms within the community, and function of the ecosystem within the larger global context. Ecosystem diversity is what makes the earth function and therefore provides for the survival of humans.
It is difficult to put an economic value on biodiversity or to predict the consequences of the extinction of a species or the alteration or elimination of an ecosystem. Once a species is extinct, it cannot be revived. This irreversibility has been a powerful element in the arguments over the values of biodiversity and of the forests that contain it. Any adaptions that species might have made or caused in another species will not occur and that whole evolution path is eliminated. The undiscovered benefits of that species to humans may have been enormous, but will never be discovered. The link that species may have been in the ecosystem web may not be able to be replaced and the ecosystem is altered. The loss of biodiversity can have far-reaching effects and impact the survival of humans on this planet.
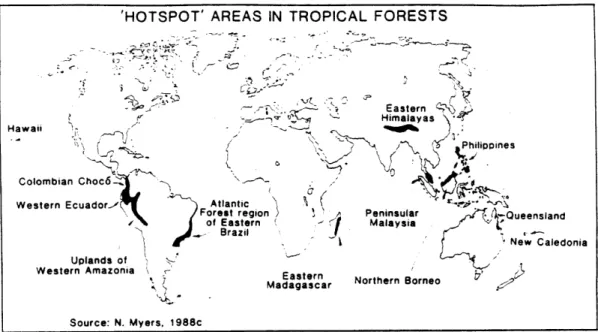
In many cases, deforestation does not directly eliminate the plant and animal species, rather it rapidly alters the habitat in ways that cause the extinction of the species. Twelve "hot-spot" tropical forests throughout the world have been identified and are shown on Figure 1.4 (McNeely et al). Of the 12 areas, two are in the industrialized world; Hawaii in the United States and Queensland in Australia, and the remaining ten are in the developing world; Colombia, Ecuador, Peru, Brazil, Madagascar, Malaysia, Philippines, New Caledonia and the eastern Himalayan region. The ten developing region forests covered only 3.5% of the remaining tropical forest area in 1988 but contained at least 27% of the world's higher level plant species, and over 13% of the world's plants are found only in these forests (McNeely, et al). In these 10 biological diversity hotspots, the total forested area has been reduced from an estimated original extent of 220 million hectares
to approximately 29 million hectares by 1988, a loss of over 85% (McNeely et al). 1.2.2 Global Ecosystem
Deforestation is the second largest contributor of greenhouse gases to the atmosphere, behind combustion of fossil fuels. Fossil fuels account for approximately 4.9 to 5.9 billion tons of carbon per year and deforestation approximately 0.6 to 2.6 billion tons per year (Doos) The burning of forests for conversion to agriculture rapidly releases large quantities of carbon dioxide from the estimated 125 tons of carbon per hectare stored in the vegetation (World Bank, 1991a). Logging also results in the release of greenhouse gases. After the marketable trees are removed, the ground vegetation and the damaged trees dry out and decay releasing methane, another greenhouse gas. 25-50% of the trees in a logged area are killed indirectly during the harvesting of the few commercial trees present (Whitmore and Sayer).
It is also believed that extensive areas of tropical moist forests influence global weather patterns. Therefore, there is concem that the removal of large areas of tropical forest cover may ultimately alter global weather patterns. When the forest cover is removed, soil moisture and therefore the ability to absorb heat are reduced. More solar heat is reflected back into space which, over large enough areas, can lead to changes in the global circulation patterns.
Sustain Human Populations
Forests provide the habitat and way of life for numerous communities throughout the world. It is estimated that approximately 500 million peoples live in or near forests and directly depend upon them for their lives (World Bank, 1991a). Forests provide food, fuel, building material and medicines for the direct consumption of the local population. The forest also provides perfumes, dyes, material for handcrafts and foodstuffs for trade. Many indigenous communities have managed the forest for agricultural production without damaging the ecosystem by using small, widely spaced cleared plots and long fallow periods or even a thinning of the forest with crops interspersed with the trees. The ability of these communities to sustain themselves is diminished as their immediate habitat is destroyed and areas of forest to relocate into are reduced.
In many governments, ownership of the land is tied to "improving" the land (e.g. conversion to agriculture). Indigenous peoples do not have legal title to their land and there is little they can do to stop the destruction of their culture and the natural resources they depend upon. This has lead to sometimes violent confrontations, particularly in Brazil, Indonesia and Malaysia (Gradwohl and Greenberg).
1.2.4 Local Ecosystem
On the local level, forests provide important hydrologic and watershed protection functions. Forests hold the water close to the earth's surface and slowly release it to the groundwater, the surface waters, and the air through transpiration. Forests are a vital link in the hydrologic cycle that determines the regional climate. Interfering with the cycle by removing trees can significantly reduce area rainfalls. It is estimated that up to 50% of the rainfall in the Amazon region is due to the moisture released through vegetation transpiration. In Indonesia, it was determined that the temperature range in the forest was between 23 and 26 C, however after logging temperatures of 40 C were common (Hurst).
Removal of trees and vegetative cover not only disrupts the nutrient cycle but also leads to increased soil erosion by wind and water. Wind and water erosion physically remove
the thin layer of nutrient rich topsoil, thereby rendering the land infertile. Wind and water erosion are estimated to have caused 28% and 56% of world soil degradation, respectively (WRI, 1992). It is further estimated that approximately 30% of the world's
areas of degraded soils, or 579 million hectares, is directly caused by deforestation for
-agricultural and urban use conversion, and commercial logging. When looked at on a regional basis, soil degradation caused by deforestation is estimated at 38% in Europe, 4% in North America, 14% in Africa, 22% in Central America, 12% in Oceania (Australia, New Zealand and the South Pacific Islands), 40% in Asia and 41% in South America (WRI, 1992).
The other major causes of soil degradation are: overgrazing, 35% of world problem (with 49% in Africa and 80% in Oceania), improper agricultural activities, 28% of world problem (with 57% in North America), over-exploitation for fuelwood, 7% of world soil degraded area (with 13% in Africa), and finally, industrial pollution accounts for approximately 1% of the worldwide situation (and 9% of the European problem).
In addition to removing productive soils making agricultural production difficult, water erosion also causes the sedimentation of water supply reservoirs and irrigation projects. In a study of irrigation projects in Indonesia, it was determined that not properly safeguarding the watershed areas could cause a 30-40% reduction in the efficiency of the irrigation system (McNeely et al). In India, is was estimated that the clearing of the forests in the 1960's and 70's has caused $36 billion in damages from soil loss, nutrient loss, flooding and sedimentation of reservoirs. The expected life of the Hirakud reservoir was reduced from 110 to 35 years due to the deforestation in its watershed. On a better note, the World Bank has funded the establishment of the Dumoga Bone National Park in Indonesia to protect the watershed of a large hydroelectric dam downstream and ensure that project's success.
Deforestation also reduces the capacity of the soil to hold water thereby increasing surface water run-off (and erosion) which in turn increases the frequency and severity of floods. In Kenya, studies have shown that when trees were removed from a valley to establish a tea plantation (trees were left on the steep slopes and along the river), there was a fourfold increase in the peak flow levels during storms (OTA, 1984). In the reverse,
when the steep hillsides were reforested in Chandigah India, the peak storm flow was reduced by 73% and the total storm flow was reduced by 28% (OTA, 1984).
1.2.5 Production of Wood
Worldwide, nearly 3.4 billion cubic meters of wood are consumed each year (World Bank, 1991a). Of this approximately 50% is used in developing countries for fuel and building material. The other 50% is used in the industrialized countries for commercial uses such as, construction, paper-making, and furniture.
I. Fuel
Wood is the fourth largest source of fuel in the world, surpassed only by oil, coal and natural gas. Over 3 billion of the world's population utilize wood as their main source of household energy. Worldwide, approximately 80% of wood production in developing countries is for use as fuel. Gathering of fuelwood is a main source of deforestation in the tropical dry forests of Africa where 80% of that collected is used for domestic purposes,
heating and cooking.
As trees become more scarce or access to them is restricted, those gathering fuelwood for the household, typically women, have to spend a greater portion of their time to obtain the same quantity of wood. This decreases time available for other required productive activities and leisure. Therefore, households see the need for additional workers and have more children fueling the viscous cycles of population growth, poverty and degradation of the environment.
II. Commercial
Approximately 80% of commercial wood is produced in industrialized countries from temperate forests where harvesting and replanting are managed. Virtually all of the 15% of commercial hardwoods coming from tropical moist forests is harvested in an unsustainable manner. In a tropical forest, it can take 150 years for a large tree species to grow to maturity and up to 400 years for a cleared area to develop a forest comparable
am
to the one destroyed (Hurst). With such long regeneration periods, there is little incentive for a logging company to slow their extraction rates or to replant after harvesting even if they were to own the forest.
so
1.2.7 Production of Non-Wood Products
am
Forests also provide numerous non-wood products used directly by indigenous peoples and cultivated for both domestic and international markets. For example, in Ghana and Cameroon, approximately three-quarters of all meat consumed is wild "bush meat".
MM
International trade exists in items such as, spices, gum, nuts, latex, rattan, house plants, medicinal ingredients, and extracted oils. In 1980, approximately 25% of prescription drugs in the United States, worth $8 billion, were derived from tropical plants (OTA, 1992). World trade in essential oils and spices is worth over $1 billion (OTA, 1984). In addition, the United States relies on cross-breeding with wild species to maintain disease and insect resistance in agricultural crops. A wild melon from India was used to give California's melon crop resistance to powdery mildew (OTA, 1984) and peanut resistance to leafspot was found in the Amazon region (Gradwohl and Greenberg).
1.2.8 Value of the Forest
The previous sections describe the roles of the forest, but how is their existence valued? Forests can be valued both economically and ethically. The economic values revolve around "use" values; the market value of forest products (productive use) and the estimated market value of products that are not traded in the marketplace (consumptive use). In addition, attempts are made to assess the indirect economic values of the forest ecosystem functions, such as flood prevention (non-consumptive use).
On the ethical basis, forests can be valued for their "option" value and their "existence" value. The option value involves knowing that the option exists in the future to visit the forest, to study the ecosystem of the forest, to find and develop the medicine that may
cure cancer (if one exists in the forest). Existence value is finding value or comfort in simply knowing that the forest exists in the world. The ethical argument also includes the
assertion that all living organisms/ecosystems have a right to exist and humans have no right to destroy organisms/ecosystems in pursuit of human gains. Coupled with this is the belief that the extinction of each species lessens the fullness of life for everyone.
There is much conflict between nations and even between individuals within nations on how to value the forest. Some see the only value of the forest as economic. If more money can be made in the market by maintaining the forest, then keep it; otherwise, cut it down. Option and existence values regarding the tropical forests are higher and more prevalent among the industrialized countries and the wealthy within them. Option value is hard to appreciate when your family is starving and your time horizon extends only to the next day or week or season, and existence value can be inconceivable. Nations with masses of hungry landless citizens may only consider the economic values of production uses when making decisions. No effort is spent trying to assess the consumptive and non-consumptive economic values and the concepts of option and existence values are totally ignored. In fact, poor countries often resent the insistence of industrialized countries that there are these option and existence values, and see them only as a means to keep them poor. After all, industrialized countries got wealthy by using their natural resources without regard to option and existence values.
1.3 History and Current Scope of Deforestation
Deforestation has historically been largely confined to the temperate forests of Europe and North America, however since the second world war, deforestation of the tropical forests has increased dramatically. Currently, deforestation outside the tropical areas is relatively low, and temperate forests in North America and Western Europe may have actually increased by approximately 5% during the 1980's (FAO, 1993b). However, temperate deforestation may become a problem in the former communist countries of Europe in their search for sources of foreign currency and throughout the temperate forests due to increased acidification of soils due to industrial pollution.
Currently, tropical deforestation is approximately 15.4 million hectares per year, compared to an estimate of 11.5 million hectares made by the FAO in the early 1980's.
Deforestation in FAO terms, applies to changes in the use of the forest such that less than 10% is now covered by the tree crown, such as after conversion to agriculture. Degradation refers to changes in the tree cover such that there is more than 10% covered by the tree crown, but the original function(s) of the forest are impaired. Degradation, such as that associated with selective logging, is not included in the deforestation estimates provided by the FAO. Each year, approximately 5 million hectares are degraded by logging (Whitmore and Sayer). However, it should be noted that constructing roads into an area to log it, opens up the area to settlement and the conversion to agriculture. Therefore, logging may not be a direct cause of deforestation, however it often precedes and facilitates it.
Figure 1.5 shows the relative deforestation/afforestation rates in each major land area differentiated by the type of forests lost and gained. Table 1.1 shows the tropical moist forest resources by country with the average annual deforested area. It should be noted that there is considerable uncertainty regarding the available data on deforestation. Most of the data was estimated several years ago. Unfortunately, the 1990 FAO tropical forest assessment data are not yet available on a detailed country by country basis, only the summary information has been published to date (FAO, 1993b&c).
1.3.1 Africa
Africa had 528 million hectares of tropical forest in 1990, covering 24% of the land area (FAO, 1993c). Africa's tropical forest loss from 1981 to 1990 was 0.7% of total tropical forests per year, or 4.1 million hectares each year (FAO, 1993a). West Africa, holder of significant areas of tropical moist forest, had the highest regional deforestation rate in
Africa at 1.0% per year. The two african regions of Central and Southern Africa had their deforestation rates increase in the 1980's by over 50% from 1970's levels (WRI, 1992). The two nations with the highest deforestation rates during the 1980's, in terms of percent of remaining forest, were the West African nations of Nigeria and Cote d'lvoire. Nigeria's forests have become so depleted that the country is now a net importer of wood (Gradwohl and Greenberg).
1.3.2
Asia and the Pacific islands had 311 million hectares of tropical forest in 1990, 35% of land area (FAO, 1993c). On a continental basis, Asia has the highest tropical deforestation rate in the world at 1.2% per year during the 1980's, or 3.9 million hectares M- lost per year (FAO, 1993a). The regions of continental Southeast Asia were deforested at 1.6% and the islands of Southeast Asia at 1.2%, representing over 50% increase over
1- the 1970's rate (WRI, 1992).
- In the Philippines, 57% of the land was forested in the 1940's. By 1990 that was reduced
to only 22%. Most of this occurred during the 1960's and 1970's when up to 300,000
- hectares were cut each year, largely to supply the export market. By the 1980's
deforestation was so widespread that the rate was reduced to approximately 100,000 hectares/year. Thailand was once over 50% covered by tropical moist forests; now forests cover less than 25% of the land. In 1961, Thailand had over 273 million hectare of forest, by 1985 only 115 million hectares remained (Hurst). Thailand was once a major exporter of wood, particularly teak, however they now have to import wood to supply their furniture production and housing needs.
Approximately 10% of tropical moist forests are in Indonesia. During the 1970's, Indonesia's forests were harvested at a rate of 300,000 hectares per year. This increased to approximately 600,000 hectares/year during the 1980's and is estimated to be over
1,000,000 hectares/year in 1991. Two states in Malaysia, Sarawak and Sabah on the island of Borneo, supply approximately two-thirds of the world's tropical hardwoods. From 1983 to 1990, an average of 220,000 hectares was logged each year on Sarawak, 2.3% of the forested area each year, to produce 11.8 million cubic meters of logs annually (Reinhardt). This was an approximately 180% increase above the 1977 level.
1.3.3 Europe and North America
Most commercial wood is produced and utilized in the economies of Europe and North America. Due to the comparatively long history of settlement and industrialization, the forests of these continents have been virtually fully exploited. Forests, other than those
set aside in parks or wilderness areas, are generally managed for the production of wood. This production is basically sustainable, however much of the land is clear-cut and replanted as a mono-culture. Mono-culture stresses the growth of one species and therefore does not present stimulating habitat for biological diversity. North America is a major exporter of raw logs, particularly to Japan and China. The export peaked in 1989 and in 1990 was 994 million cubic meters.
Even though the actual area under forest cover may have increased in recent time, that does not mean that the developed countries do not have any points of conflict regarding the issue of deforestation. For example, there are some areas of primary forest left in the United States and Canada, particularly in the states of Alaska, Oregon and Washington and the province of British Columbia. The controversy surrounding attempts to continue logging those areas is intense. In addition, for years environmental groups have opposed clear-cut harvesting methods, below-cost timber sales by the US government to private interests, and the subsidizing of the timber industry by building of access roads (often times the cost of road construction exceeded the revenue generated by the timber sale). 1.3.4 Latin America and the Caribbean
This region has the largest extent of forest cover with 918 million hectares in 1990, covering 56% of the land area (FAO, 1993b). This represents over 50% of world forested area with Brazil holding over one-quarter of world forests on its own. The amount of land deforested each year in Latin America is approximately 7.4 million hectares per year, or 0.8% of total forests (FAO, 1993c). This represents an approximately 50% rate increase over the 1970's. The Amazon region of Brazil accounts for approximately 2.2 million hectares of deforestation on its own each year. Central America and Mexico lose approximately 1.5% of tropical forests each year. Again, this is an approximately 50% increase over the rates in 1970's (WRI, 1992).
In 1970, Costa Rica was over 50% forested, however government policies combined with the North American demand for inexpensive beef created the incentive to clear forests for
cleared and during the 1980's, Costa Rica's deforestation rate was one of the highest in the world, only exceeded by the West African nations of Nigeria and Cote d'lvoire.
Africa
Asia and Pacific Latin America North America Europe U.S.S.R. 0 200 400 600 800 1000 1200 1400 Millions of hectares
Tropical moist E Tropical dry • Temperate
forest forest forest
Figure 1.1 Distribution of Forest Types Source: World Bank, 1991a
Africa
Asia and Pacific Latin America North America Europe U.S.SR. 0 200 400 600 800 1000 1200 1, Millions of hectares
Closed forest 0 Open forest and other wooded area
Figure 1.2 Distribution of Open and Closed Forests Source: World Bank, 1991a
~'~///////lli ~ I I 4M 100 I"
· ii~i~
i
700'M I
I
Figure 1.3 Locations of Tropical Moist Forests Source: Rainforest Action Network 31
'HOTSPOT' AREAS IN TROPICAL FORESTS -J7 Hawaii Colombian Choc6- . Western Ecuador,' i• " Eastern Himalayas Atlantic Forest region of Eastern r lzaIB C/ Uplands of Western Amazonia i Ma Eastern dagascar Source: N. Myers, 1988c
Figure 1.4 Biological Diversity Hotspots Source: McNeely, et al
Africa (0.6%) Asia and Pacific (0.8%) Latin America (1.3%) North America (0.1%) Europe (n.a.) 1J.S.S.R. (n.a.) -20 -10 0 10 20 Millions of hectares
Closed forest EE Open forest e Plantation
n.a. Not applicable.
Note: Numbers in parentheses as a percentage of total forest area.
Sources: World Resources Institute 1990; Food and Agriculture Organization 1985 and
1988.
Figure 1.5 Rates of Deforestation/Afforestation Source: World Bank, 1991a
O c3· t ;· t,· Cyz'
I
wow om mo NAM NVA AN WMA
Table 1.1 Total Closed Forest Area and Deforestation Rates for Tropic Countries
Source: Whitmore and Sayer
Closed Forest Average Annual
in 1980 Deforestation
Country (000 ha) in 1980s (000 ha)
AFRICA
Angola 2,900 44
Benin 47 1
Cameroon 16,500 100
Central African Republic 3,590 5
Congo 21,340 22 Equatorial Guinea 1,295 3 Gabon 20,500 15 Ghana 1,718 22 Guinea 2,050 36 Guinea Bissau 660 1 7 Ivory Coast 4,458 250 Kenya 1,105 19 Liberia 2,000 46 Madagascar 10,300 150 Nigeria 5,950 350 Reunion 82 NA Senegal 220 NA Sierra Leone 740 6 Tanzania 1,440 10 Togo 304 2 Uganda 765 10 Zaire 105,750 400 TOTAL AFRICA 203,714 1,508
ASIA AND PACIFIC
Australia 600 NA Bangladesh 927 8 Brunei 323 5 Burma (Myanmar) 31,941 677 Fiji 811 2 Hawaii 445 NA India 36,540 1,000 Indonesia 113,895 1,000 Kampuchea 7,548 25 Laos 8,410 100 Malaysia 20,966 310
Closed Forest Average Annual
in 1980 Deforestation
Country (000 ha) in 1980s (000 ha)
New Caledonia 484 NA
Papua New Guinea 34,230 22
Philippines 9,510 143 Solomon Islands 2,423 1 Sri Lanka 1,659 58 Thailand 9,235 158 Vanuatu 236 4 Vietnam 8,770 200 TOTAL ASIA 288,953 3,713 LATIN AMERICA Belize 1,354 9 Bolivia 44,010 87 Brazil 357,480 2,666 Colombia 46,400 600 Costa Rica 1,638 124 Cuba 1,455 2 Dominican Republic 629 4 Ecuador 14,250 340 El Salvador 141 5 French Guiana 7,832 1 Guatemala 4,442 90 Guyana 18,475 2 Honduras 3,797 90 Jamaica 67 2 Mexico 46,250 700 Nicaragua 4,496 121 Panama 4,165 36 Peru 69,680 270 Puerto Rico 246 NA Surinam 14,873 3
Trinidad and Tobago 208 1
Venezuela 31,870 125
TOTAL LATIN AMERICA 673,758 5,278
WORLD TOTAL 1,166,425 10,499
Table 1.1 continued Total Closed Forest Area and Deforestation Rates for Tropic Countries
2.0 CAUSES OF DEFORESTATION
"The only thing we can state with some confidence is that there are many factors behind tropical deforestation and that they are linked together as various causal chains and mechanisms (Doos)".
The International Institute of Applied Systems Analysis (IIASA) illustrates the causes of deforestation in the vicious cycle shown in Figure 2.1 (Doos). The World Bank (1991a) states that the principle causes of deforestation are: increasing population and the need for agricultural land, land ownership patterns that force landless persons into forest areas, commercial agriculture operations, and commercial logging (largely because it opens up previously inaccessible areas for cultivation and fuelwood harvesting). Along these lines, N- the World Bank, the United Nations Development Programme and the World Resources Institute stated in their 1985 Tropical Forests: A Call for Action that "it is the rural poor m- themselves who are the primary agents of destruction as they clear forests for agricultural
land, fuelwood, and other necessities."
Many criticize this over-simplifying view saying "To blame colonizing peasants for uprooting tribal people and burning the rain forest is tantamount to blaming soldiers for causing war (Hurst)". Some developing countries and environmental groups identify the interconnected underlying causes of deforestation as: the debt crisis, the international terms of trade, ill-planned development projects and the distribution of land ownership (Hurst). The FAO states that "At the root of the problem is the weakness of the national economy in most tropical countries combined with the scarcity of capital to invest in development (FAO, 1993a)."
2.1 Population Growth and Poverty
"Poverty underlies all these causes. The destruction of forests is a symptom of the development path chosen by poor nations as they strive, by whatever means, to improve the living standards of their populations (Hurst)."
As the population grows, they require both food and fuel. This leads to increased pressures on the forests to be used for fuel and to be cleared for agriculture. In many countries, governments had programs meant to deal with the poverty and landlessness problem that purposely settled people in the primary forest. The largest of these are in Indonesia and Brazil. In Indonesia, a nation of over 13,000 islands, approximately 60% of the population lives on the Island of Java, only 7% of the land area. To relieve the pressure on Java, the government induced millions of people to move to the less populated islands, offering free cleared land, housing, seeds, fertilizer and infrastructure. These settlements were often established in the tropical forests, causing significant deforestation, estimated at over 48 million hectares (Gradwohl and Greenberg). The soils under the forest are of poor quality and are severely compacted during clearance. This infertility forces the migrants to clear new areas in an attempt to survive or move into the slums of the population centers. This massive movement of people and the destruction of the forest has encountered resistance from the indigenous peoples who have been severely repressed by the Indonesian military.
In Brazil, the ill-fated program, to be discussed further in Section 2.1.2, was established to avoid dealing with the underlying cause of poverty and landlessness, the concentration of ownership of the fertile lands among a small wealthy elite; 4.5% of landowners control over 80% of Brazil's productive agricultural lands.
2.1.1 Fuel
Fuel accounts for the largest use of wood production in the world. Even in the United States, over one-fifth of all timber production was used as fuelwood or charcoal, amounting to 116.3 million cubic meters of wood in 1989 (FAO, 1991). Most of this wood is the tree wastes consumed in pulp mills to fuel the production process. In tropical countries, fuelwood production accounts for a substantial percentage of all wood production. In Indonesia and Papua New Guinea, 46 and 62% of energy demand was met with wood in 1989, respectively, accounting for 136.1 and 5.5 million cubic meters of wood, respectively or 77 and 67% of total wood production, respectively (FAO, 1991). In Brazil, 40% of the fuel used in the steel industry is charcoal (OTA, 1984).
In the dry forests of Africa, production of fuelwood is a leading cause of deforestation. For example, in 1989, in the nations of Ethiopia and Tanzania, wood satisfied over 91 and 92% of energy demand, respectively, and accounted for 96 and 94% of all wood production, respectively, amounting to 37.9 and 31.1 million cubic meters of wood,
respectively (FAO, 1991).
It is not the use of wood for fuel that has caused deforestation, per se, but rather the commercialization of the fuelwood collection. Obviously, industrial use of wood for fuel creates a concentrated demand for fuel that requires a logging operation to generate the supply. However, even household use can cause deforestation when the households are concentrated in towns and cities. In less populated areas, women and children gather small branches and basically leave the trees intact. However, as the demand increases, market oriented practices take over, and it becomes more efficient to cut the entire tree for larger scale fuelwood or charcoal production. The demand is often met by the poor gathering fuelwood from within an ever increasing radius. In the Sahel region of Africa, wood is transported over 100 kilometers to some population centers (OTA, 1984). If transportation costs become too great, the more fortunate in the population centers will switch to available substitute fuels, and the poor do without. The poor will also substitute dried animal dung for wood. This deprives the soils of nutrient replenishment, leads to declines in soil fertility and contributes to the perpetuation of hunger and poverty.
Throughout the world, wood is burned by the poor in open fires or in inefficient stoves that deliver only 5-15% of the heat energy to the food being cooked (OTA, 1984). Charcoal has approximately three times the energy content of wood. However, the conversion of wood to charcoal is a very inefficient process in most of the world. Traditional earthen pit or mound systems require 10 tons of air-dried wood to produce one ton of charcoal (OTA, 1984). There is great potential for increasing the efficiency of the charcoal conversion and the cooking processes thereby reducing the quantity of wood needed to perform the same work, substantially reducing the pressure on the forest.
Substituting dried wood for the typically moister wood can lower wood use as moist wood contains half the heat potential of dried wood. The efficiency of cook-stoves can be increased from 5-15% to 20-30% by providing better draft and more complete combustion
and by concentrating the heat produced to the surface being heated. Ceramic lining of stoves can act as insulation, reducing heat loss. In several projects, inexpensive stoves have substantially cut fuelwood demand. For example, in Guatemala, a $5 stove molded from mud and sand and fitted with a metal damper and pipe cut the fuelwood requirement by 50% (OTA, 1984).
Charcoal use is becoming more popular in urban areas. Because of the inefficiency of the conversion process, this trend increases demands on forests. It is estimated that a
50% gain in conversion efficiency can be obtained simply by using dried wood of relatively uniform size, packed tightly, covered with enough earth to prevent complete combustion, and the careful spacing of air vents (OTA, 1984). By inserting a metal liner between the wood and the earthen cover, dirt can be kept out of the wood, raising the efficiency by
20-30% in some kilns (OTA, 1984). Efficiency can also be substantially increased through the use of permanently placed brick, metal or concrete kilns or portable steel kilns. These later options are capital intensive, and thus widespread use will be doubtful without substantial government or international assistance. If the kilns are not mobile, the forest in the vicinity of the kiln will be exhausted over time unless the area is managed and
replanting is undertaken.
Kerosine, electricity, and natural gas are traditional substitutions for wood in cooking and heating. There are also non-traditional substitutions such as solar, wind and small-scale hydropower. However, it is doubtful that users will substitute these more expensive options while there is still a supply of free wood available. Governments attempt to encourage the shift in demand by subsidizing the traditional substitute fuels to make them attractive. However, with the fiscal problems of most less developed countries, it is doubtful that these subsidies can or should continue.
Another approach to reducing the demand on natural forests is to plant trees expressly for the purpose of fuelwood production. In areas that are not supplying large concentrated population centers, trees can be planted along roadways and around the edges of fields. A community woodlot could be planted and maintained by larger settlements. Privately owned plantations of fast growing trees could be promoted for commercial charcoal production.
2.1.2 Agricultural Conversion
There are great pressures, from both population and also foreign currency needs, to clear the forest and establish agriculture and pasture. Shifting cultivation (or slash and burn agriculture) at the subsistence level has been practiced in tropical forests for centuries. Because populations were small, as was the size of their plots, and the fallow periods
were long, this practice did little to disrupt the forest. During the 1970's and 1980's, as
the established agricultural areas became mechanized, their ownership increasingly concentrated, and their production moved towards the export market, the majority of the population was landless. Large numbers of these peasants were then forced into the marginal areas, the tropical forests, and in the cases of Brazil and Indonesia, they are aided by government settlement plans. It is this increased concentration of population in the forest that has caused the destruction of the forest ecosystem.
In Brazil, most of the deforestation is due to conversion to agriculture and pasture. The areas to be settled are sometimes quickly commercially logged before the land clearing is done or settlers save aside valuable trees during clearing; however most of the trees are simply destroyed during the burning. It was estimated that $100 to $250 million worth of marketable trees were burned by the conversion to pasture alone (WRI, 1990). Through legislation in the mid-1960's, the government initiated a settlement plan aimed at gaining political control over the region. The government began extensive road-building and other infrastructure projects and created financial incentives for business to locate in the Amazon. Within a 47,000 square kilometer area (about the size of Switzerland) serviced by the first highway, the Belem-Brasilia Highway, the area of cleared land expanded from 300 square kilometers in 1972 to over 8,200 square kilometers in 1985 (Mahar). The population in the area of the highway also increased dramatically, from approximately 100,000 in the 1960's to over 2 million by the 1980's (Mahar).
In the state of Rhondonia, made accessible by the construction of highway BR-364, a settler could obtain title to a 100 hectare plot of forested land for a nominal price. Through another process, a settler could obtain title to an area three times the size of the area cleared, up to 270 hectares - providing substantial incentive to clear as much land as possible, regardless of need (Mahar). Some of these cleared lands have fertile soils;