The Design and Control of a Thermal Management System for a
Photovoltaic Reverse Osmosis System
by Leah C. Kelley
Bachelor of Engineering, Mechanical Engineering The City College of New York, 2009
Submitted to the Department of Mechanical Engineering in Partial Fulfillment of the Requirements for the Degree of
Master of Science in Mechanical Engineering at the
Massachusetts Institute of Technology June 2011 MASSACHUSETTS INSTITUTE
I
OF TECHNOLOGYJUL29 201
L1BRARES
ARCHNES
0 2011 Massachusetts Institute of Technology All rights reserved
Signature of Author: ...
Department of Mechanical Engineering April 27, 2011
C ertified by: ...
Steven Dubowsky Profess of Mechanical Engineering
T4 elsoupervjdpr
A ccep ted by : ...
David E. Hardt Chairman, Department Committee on Graduate Theses
The Design and Control of a Thermal Management System for a
Photovoltaic Reverse Osmosis System
by Leah C. Kelley
Submitted to the Department of Mechanical Engineering on April 27, 2011 in Partial Fulfillment of the Requirements for the Degree of Master of Science in
Mechanical Engineering
ABSTRACT
Reverse osmosis (RO) is a well-known process for desalinating seawater and brackish groundwater. Desalination is energy-intensive, so using photovoltaic (PV) panels to power the process is an attractive environmentally friendly concept, especially for community-scale systems. Increasing the system efficiency will lower the total cost of water produced, making the systems more economically competitive for a greater number of geographic locations.
The thermal behaviors of PV panels and RO systems are complementary and can be exploited to improve photovoltaic reverse osmosis (PVRO) system efficiency. For a given level of solar radiation, a PV panel produces more electrical power at lower panel temperatures. For a given applied pressure, the flow of clean water across an RO membrane increases with
increasing temperature. By using the RO feed water to cool the PV panels and warming the water in the process, more electrical power can be produced and higher flow rates of clean water across the RO membrane can be achieved, increasing total daily water production. The ability to cool the PV panels permits the use of low-cost, flat-plate concentrating mirrors, which further increase electrical power and clean water production.
This thesis develops a thermal management system to improve the performance of a small-scale PVRO. Preliminary case studies show that the thermal exploitation concept is feasible and that a 50% increase in the total daily clean water production of a PVRO system is achievable, with an active thermal controller. A thermal controller is proposed that optimizes the PVRO system performance by minimizing the temperature of the solar panel and maximizing the temperature of the RO feed water. The control system uses a solar panel-mounted heat
exchanger, circulator pump and servo valves to maximize water production while operating within the temperature limits of both the solar panel and the reverse osmosis membrane.
Preliminary controller simulations show that it can successfully manage the temperatures of both the solar panel and RO feed water. The thermal management concept was experimentally
validated on a small-scale, 300 L/day PVRO system. A 57% increase in clean water production was achieved using thermal management and solar concentrating mirrors, which agrees well with simulated performance predictions.
Thesis Supervisor: Steven Dubowsky Title: Professor of Mechanical Engineering
ACKNOWLEDGEMENTS
I thank my advisor, Steven Dubowsky, for his guidance, support, advice and patience over the past two years. I especially thank Amy Bilton, for her friendship, her technical help and advice ranging from developing the Matlab and Simulink code for solar radiation simulations to the design and construction of the MIT Demonstration PVRO Unit, her willingness to listen to ideas and her boundless generosity. I also thank the other members of the Field and Space Robotics Lab for their help with the construction of the MIT Demonstration PVRO System, and especially Roman Geykhman for his assistance with circuit design. I thank Francesco Mazzini for his help with debugging the Simulink models, and for his friendship and encouragement.
I thank the MIT Department of Mechanical Engineering, A. Neil Pappalardo, and Dorothy Lemelson for their generous financial support. I also thank the King Fahd University of
Petroleum and Minerals in Dhahran, Saudi Arabia, for funding the research reported in this thesis through the Center for Clean Water and Clean Energy at MIT and KFUPM.
CONTENTS
ABSTRACT... ... 3 A CK N O W LEDG EM EN TS ... 5 C O N TEN TS ... 7 FIGU RES ... 9 TA BLES... 11 IN TR O D U C TIO N ... 13 1.1 M OTIVATION ... 131.2 BASIC SOLAR POW ERED REVERSE O SM OSIS... 15
1.3 THESIS OBJECTIVE: PVRO PERFORMANCE IMPROVEMENT USING THERMAL M ANAGEMENT ... 18
1.4 THESIS ORGANIZATION ... 18
LITER A TU RE REV IEW ... 20
2.1 PHOTOVOLTAICS... 20
2.2 REVERSE O SM OSIS... 21
2.3 PHOTOVOLTAIC-POWERED REVERSE OSMOSIS... 22
2.4 COOLING PV PANELS... 24
2.5 H EATING R O W ATER... 25
2.6 COMBINING PV COOLING AND WATER HEATING ... 25
TECHNICAL DISCUSSION AND ANALYSIS ... 27
3.1 FUNDAM ENTALS ... 27
3.1.1 Therm al Characteristics ... 27
3.1.2 Therm al M anagem ent Concept... 28
3.2 H EAT TRANSFER ANALYSIS... 29
3.2.1 Assumptions ... 30
3.2.2 P V Panel H eat Transfer... 32
3.2.3 Supplem ental Area H eat Transfer ... 35
3.2.4 H eat Transferred to the RO Feed W ater... 36
3.2.5 Heat Transfer from the RO Pressure Vessel to the Ambient Surroundings... 37
3.3 CASE STUDY ... 39
3.3.1 Assumptions ... 39
3.3.1 A M odeling of RO System ... 40
3.3.1 .B Power Required for Circulating Water through the Heat Exchanger... 41
3.3. .C Concentrated Sunlight... 42
3.3.2.A Solar Panel ... 42
3.3.2.B PV RO System Param eters... 43
3.3.2.C H eat Transfer Properties... 43
3.3.3 Case Study Results ... 44
C O N TR O LLER DESIG N ... 46
4.1 FORM ULATION OF THE CONTROL PROBLEM ... 46
4.1.1 System Constraints... 47
4.1.2 Control Problem Statem ent... 48
4.2 CONTROLLABLE SYSTEM CONFIGURATION ... 49
4.2.1 Basic Operation ... 50 4.2.2 System Equations ... 51 4.3 CONTROLLER D ESIGN ... 54 4.3.1 Control Regim e 1 ... 56 4.3.2 Control Regim e 2 ... 56 4.4 CONTROLLER SIMULATIONS ... 58 4.4.1 Assumptions ... 58 4.4.2 Cases... 59
4.4.3 Sim ulation Results... 63
4.4.3.A Reference Case - Baseline Case ... 63
4.4.3.B Regime 1 Simulations - Cloud Cover Vanishes ... 65
4.4.3.C Regim e 2 Sim ulation - W arm Source W ater ... 68
4.4.3.D Controller Sim ulation Sum m ary... 71
EXPERIMENTAL VALIDATION... 72
5.1 EXPERIMENTAL SYSTEM CONFIGURATION... 72
5.2 SIMULATIONS OF THE EXPERIMENTAL SYSTEM ... 75
5.3 EXPERIMENTAL RESULTS... 78
SU M M A RY A N D N CLU IO N ... 82
6.1 CONcLU
s
... ... . ... ... 826.2 A REAS FOR FUTURE W ORK... 84
R EFER EN CES ... 86
FIGURES
Figure 1.1: Areas with good solar resources, from [3]... 14
Figure 1.2: Geographic areas where PVRO is economically feasible [4]. ... 15
Figure 1.3: Schematic of a basic PVRO system ... 16
Figure 2.1: Schematic illustrating the production of electricity in a solar panel, from [8]. Used w ith perm ission ... 2 1 Figure 3.1: Effect of increasing temperature on solar panel power. Figure by A. Bilton, based on [24], used w ith perm ission... 27
Figure 3.2: Effect of temperature on specific energy required for desalination as a function of pressure. Water quality increases with increasing pressure. Figure by A. Bilton, used w ith perm ission ... 28
Figure 3.3: Schematic representation of a PVRO system with concentrating mirrors, cooled by incom ing RO feed w ater... 29
Figure 3.4: Schematic of a PVRO system considered for heat transfer analysis... 30
Figure 3.5: Assumed flow pathway through the heat exchanger... 31
Figure 3.6: Conceptual drawing of solar panel with integrated supplemental heating area... 31
Figure 3.7: Illustration of incident radiation and heat transfer between the solar panel, heat exchanger, incoming seawater, ambient air and sky... 32
Figure 4.1: Schematic representation of a controllable small-scale PVRO system showing flow pathways and available actuators. Controller and signals are not shown... 50
Figure 4.2: Schematic of the thermal management system showing the controller and the sensor measurements used to determine the positions of Controllable Valves 1 and 2... 51
Figure 4.3: Block diagram showing controller operation under regime 1, in which the RO boost pump pressure is below 0 gauge pressure and is starved for water. ... 56
Figure 4.4: Block diagram showing controller operation under regime 2, in which the pressure is above 0 gauge pressure. Both valves operate based on temperature feedback... 57
Figure 4.5: Flow rates through the heat exchanger, RO system and bypass valves when the system responds to constant input power, incident heat and source water temperature... 63
Figure 4.6: Pressure at the RO pump inlet, left, and temperatures of the solar panel, RO feed water and incoming source water, right, for the simulated system response to constant heat, power and water tem perature ... 64
Figure 4.7: Simulated flow rates when bypass Valve 1 responds to pressure measurement feedback, using the simplified heat transfer model (left) and the full nonlinear heat transfer m odel (right) ... 65
Figure 4.8: Simulated pressure at the RO boost pump inlet when bypass Valve 1 responds to pressure measurement feedback, using the full nonlinear heat transfer model. ... 66
Figure 4.9: Simulated temperatures when bypass Valve 1 responds to pressure measurement
feedback, using the full nonlinear heat transfer model... 67
Figure 4.10: Simulated flow rates when bypass Valves 1 and 2 are controlled by temperature feedback, using the full nonlinear heat transfer model... 68
Figure 4.11: Simulated pressures at the RO boost inlet when bypass Valves 1 and 2 are controlled by temperature feedback, using the full nonlinear heat transfer model... 69
Figure 4.12: Simulated temperatures when bypass Valves 1 and 2 are controlled by temperature feedback, using the full nonlinear heat transfer model... 70
Figure 5.1: MIT Demonstration PVRO system... 72
Figure 5.2: The RO unit (right) and custom electronics (left). Photos by Amy Bilton... 73
Figure 5.3: Heat exchanger mounted on the solar panel... 74
Figure 5.4: Schematic representation of the experimental system ... 75
Figure 5.5: Electrical power produced by the solar panel during experiments with and without therm al m anagem ent... 78
Figure 5.6: Solar panel cell temperature during experiments with and without thermal m anagem ent ... 79
Figure 5.7: Water temperatures during experiments with and without thermal management... 80
TABLES
Table 3.1: Solar Panel Param eters ... 42
Table 3.2: Nominal System Parameters... 43
Table 3.3: H eat Transfer Param eters... 44
Table 3.4: Nominal System Performance for July in Cyprus ... 44
Table 4.1: System Parameters for Controller Simulations... 60
Table 4.2: Inputs for Controller Simulations using Simplified Heat Transfer Equations... 61
Table 4.3: Initial Conditions for Controller Simulations using Simplified Heat Transfer E qu ation s... 6 1 Table 4.4: Inputs for Controller Simulations using Full Nonlinear Heat Transfer Equations... 62
Table 4.5: Initial Conditions for Controller Simulations using Full Nonlinear Heat Transfer E qu ation s... 62
Table 5.1: Simulation Results for a Small-Scale PV/RO System... 77
CHAPTER
1
INTRODUCTION
1.1
Motivation
Access to clean water is a major problem. Over 880 million people currently lack access to clean water [1]. Many of these people live in small, remote communities near coasts, or are inland near sources of brackish ground water. In such areas, desalination can be used to provide fresh water from local saline sources. Due to its scalability, reverse osmosis is the most practical desalination technique for small communities [2].
Reverse osmosis is energy-intensive, requiring approximately 4 kWh of energy per cubic meter of clean water [2]. Conventionally, small, off-grid reverse osmosis processes are powered by diesel generators. However, many water-scarce areas, such as the Southwestern United States, much of Australia, the Middle East, North Africa and India (see Figure 1.1) have good solar resources [3]. In these areas, solar panels can also be used to power small-scale reverse osmosis systems.
Insolation
Annual Averaged from Jul 1983 - Jun 2005
-120 -0 0 60 120 180
0.0 1.0 2.0 3.0 4.0 5.0 6.0 7.0 8.0 >8.50
Region cveroge= 3.9475 (kM/na2/dy) NASA/SSE 14 Jul 2009
Figure 1.1: Areas with good solar resources, from [3].
Photovoltaic reverse osmosis (PVRO) is only practical if it is economically competitive with conventional, diesel-powered reverse osmosis systems. In areas with good solar resources, PVRO is currently economically feasible when compared to conventional diesel systems [4], as shown in Figure 1.2. With a 25% improvement of system efficiency, PVRO becomes
economically feasible for a greater geographic area.
Improvements in total system efficiency can be accomplished through many different methods including developing new system components, and actively controlling the way in which the components operate and interact. Here, the focus is on improving system performance through actively controlling a system composed of commercially available components.
BIWA. -AorLegend
Original Economical Area Economical Area with 25% Increase in System Efficiency
Figure 1.2: Geographic areas where PVRO is economically feasible [4].
1.2 Basic Solar Powered Reverse Osmosis
In a basic PVRO system, as shown in Figure 1.3, a solar panel converts solar radiation to electricity. The electricity is sent to the control electronics, where it is converted into the proper voltage and current to drive the pump. The pump increases the pressure of the saline source water so that it is greater than its osmotic pressure, and drives it into the pressure vessel housing the reverse osmosis (RO) membrane. The RO membrane is a selectively permeable polymer which allows transmission of water, but not salt. When the saline water is at pressure higher than its osmotic pressure, clean water flows across the RO membrane and a concentrated brine solution remains. As the difference between the saline water pressure and the osmotic pressure increases, the flow rate of clean water across the RO membrane increases. The fresh water and brine streams exit the pressure vessel in separate streams. The brine exiting the pressure vessel is still at high pressure, so an energy recovery device, such as turbine, can be used to extract energy from it. The extracted energy is sent to the control electronics, where it is converted along with the electricity generated by the solar panel to the proper voltage and current to drive the pump.
-- - --- Electrical Power Process Water Solar Panel - 1Membrane Clean Pump Water I Control
Intake etro ---- Energy
Electronics Recovery
Device Brine
Figure 1.3: Schematic of a basic PVRO system
Batteries are often included in PVRO systems to provide energy storage. When batteries are used in such systems, extra electricity produced by the solar panel is stored in batteries to be used when sufficient power is not available. Since sunlight is an intermittent energy source, the use of batteries enables the system to run at night or during cloudy periods. Also, using batteries permits the pump motor to always operate at its design point. However, batteries are expensive
and require replacement several times over a PVRO system's lifetime. They also introduce the following energy conversion losses into the system: the energy loss when the electrical power from the solar panel is converted into chemical energy that is stored in the battery, and the energy loss when the chemical energy in the battery is converted into electrical energy to drive the pump.
PVRO systems can be designed to operate without batteries eliminating the energy conversion losses. In this case, the system must be designed to accommodate the variation in solar radiation incident on the solar panel over the course of the day due to the earth's rotation, over the course of the seasons, and by amount of cloud cover. A solar tracking mechanism can be used to minimize the variation in the amount of incident solar radiation caused by the earth's
rotation, but cannot compensate for variations caused by passing clouds. Control electronics are required to compensate for these variations. The control electronics accommodate power
fluctuations due to cloud passes by changing the operating voltage of the pump. As the operating voltage of the pump decreases, the pressure of the feed water decreases and consequently the flow rate of fresh water across the membrane decreases.
The amount of electrical power produced by the solar panel and the flow rate of clean water across the RO membrane both vary with temperature. For a given level of solar radiation, the amount of electrical power produced by a solar panel increases as the temperature decreases. For a given water pressure, the flow of clean water across a reverse osmosis membrane increases with increasing temperature. These behaviors are complementary and can be exploited by using the incoming reverse osmosis feed water to cool the solar panel, warming the feed water in the process. This notion has been considered, but never investigated [5, 6]. The ability to cool the
solar panels also permits the use of flat-plate mirrors for concentrating the solar radiation,
increasing the amount of sunlight incident on the solar panel and thereby increasing the electrical power produced.
It is possible to design a thermal management system with no embedded controller, and simply flow all of the reverse osmosis feed water through a heat exchanger mounted on the back of the solar panel. Such a design will cool the PV panels and warm the RO feed water.
However, there are system constraints in the form of temperature limits on the solar panel and the reverse osmosis membrane. If the solar panel gets too hot, it produces very little electricity. The polymer RO membrane will start to break down at temperatures above 450C [7]. Any
thermal control system must be operated in such a way that does not violate these constraints. Therefore, an embedded thermal controller is needed.
1.3
Thesis Objective: PVRO Performance Improvement Using
Thermal Management
This thesis develops a thermal management system to improve the performance of a small-scale PVRO. Preliminary case studies, presented in Chapter 3, show that the thermal management concept is feasible and that a 50% increase in the total daily clean water production of a PVRO system is achievable, with an active thermal controller. A controller is proposed that optimizes the system performance by managing the temperatures of the solar panel and reverse osmosis feed water. The control system uses a solar panel-mounted heat exchanger, circulator pump and servo valves to maximize water production while operating within the temperature limits of both the solar panel and the reverse osmosis membrane. Preliminary controller simulations show that it can successfully manage the temperatures of both the solar panel and RO feed water. The thermal management concept and its control were experimentally studied on
a small-scale, 300 L/day PVRO system.
1.4 Thesis Organization
This thesis is organized as follows. This chapter provides motivation for the work, provides a high-level overview of PVRO, and states the objective of this work: improving the performance of a PVRO system by controlling the temperatures of the solar panel and reverse osmosis feed water. Chapter 2 is a literature review of current work on photovoltaics, reverse osmosis, photovoltaic-powered reverse osmosis, cooling of photovoltaic panels, and heating of reverse osmosis feed water. Chapter 3 presents the fundamental thermal characteristics of solar panels and reverse osmosis membranes, a detailed heat transfer analysis of the solar panel and feed water, and preliminary case studies used to determine the feasibility of the concept. Chapter 4 presents the thermal control system and controller design, and includes simulations of the
controller performance. Chapter 5 presents experimental validation of the thermal management concept. Chapter 6 summarizes the work and presents recommendations for future work.
CHAPTER
2
LITERATURE REVIEW
This chapter addresses the current state of the art in photovoltaics, reverse osmosis, photovoltaic-powered reverse osmosis, cooling of solar panels, and heating of RO feed water.
2.1
Photovoltaics
Solar panels convert solar energy to electrical energy. Incident sunlight hits the solar panel upper surface, penetrating the antireflection coating and the emitter. When it reaches the base, the incident photons are absorbed and excite electrons within the base, forming electron-hole pairs. When the PV panel powers an electrical load, the electrons from the emitter flow through the load and recombine with the holes at the rear contact. However, not all of the re-combinations of the electron-hole pairs occur between electrons that have passed through the external load and newly formed holes; some recombination takes place within the base. As the temperature increases, the recombination rate between electrons in the base with the newly formed holes increases, and so less current flows through the load and less power is produced. This is illustrated in Figure 2.1.
antireflection coating
fron contact ernitter
a al
rear contact
Figure 2.1: Schematic illustrating the production of electricity in a solar panel, from [8]. Used with permission.
Researchers and manufacturers are continually trying to increase the electrical conversion efficiency of both solar cells and solar panels. The maximum electrical conversion efficiencies of individual solar cells tested under one sun are 25% for monocrystalline silicon and 27.6% for gallium arsenide [9]. The most efficient commercially available large crystalline solar panel is manufactured by Sun Power Corporation, and has an efficiency of 21.4% [9]. These efficiencies are measured under standard conditions: 1,000 W/m2 incident solar radiation and 25*C.
When concentrated sunlight is used, the highest reported and verified energy conversion efficiency of any photovoltaic cell is 42.3%, when subjected to 406 suns. This cell is a multi-junction cell consisting of a low bandgap indium-gallium-arsenide layer and high bandgap
indium-gallium-phosphate layer sandwiching a gallium arsenide wafer [9].
2.2
Reverse Osmosis
Commercially available reverse osmosis membranes typically consist of a thin aromatic-polyamide membrane mounted on a support layer of porous polysulfone [10]. The aromatic-polyamide is
highly permeable to water but not to salt, so the membranes are able to achieve high salt
rejection. However, chlorine and other sanitizing chemicals can cause the polyamide to break down [10], so such chemicals must be removed from the feed water before desalination. Thus, the membranes are prone to bio-fouling as well as salt depositions, and require periodic cleaning. As the membranes become fouled, the flow rate of fresh water across the membrane decreases,
and higher pressures are needed to achieve the same flow rates as in a clean membrane. Much work is being done at the component level to improve membrane performance. Current research focuses on membrane redesign to reduce bio-fouling by depositing zwitterionic-based coatings onto reverse osmosis membranes [11]. Other research focuses on increasing the
chlorine tolerance of reverse osmosis membranes by creating multilayer semi-permeable membranes from high molecular weight polyethersulfone ionomers [10], and by creating
ultra-thin polyamide membranes capable of achieving both high flow rates and high salt rejection [12]. In addition to improving the RO membranes at the component level, work is being done to improve the performance of RO systems using control techniques. In most cases, the work focuses on controlling an RO system at its optimum design point, and maintaining sufficient quality of fresh water, since the systems under consideration are conventionally powered
systems, and can be operated at constant power, unlike a solar powered reverse osmosis system. Many control techniques, including PID control, Dynamic Matrix Control, fuzzy logic and fault-tolerant control, have been applied to RO systems in simulation and experimentally [13-15]. Recent work focuses on applying Model Predictive Control to reverse osmosis systems [13, 16].
2.3
Photovoltaic-Powered Reverse Osmosis
Small scale photovoltaic powered reverse osmosis systems for both brackish water and sea water have been developed and constructed, and are commercially available [5, 17-20]. Typically, the brackish water PVRO systems do not use batteries for energy storage, while most
sea water PVRO systems incorporate batteries, though there are exceptions [21]. Systems without batteries tend to produce water of fluctuating quality. As the level of incident solar radiation drops, the power supplied to the RO unit drops, causing the flow rate of water across the membrane to drop. However, the salt passage across the membrane, though very low, continues at the same rate, thus increasing the salt concentration of the fresh water. Although suggestions of ways to maintain water quality have been presented, such as by diverting product water with unacceptable levels of salt concentration into a separate stream and by operating the system only when sunny [21].
Research on applying control methods to PVRO systems to improve performance has been conducted. One approach focuses on maximizing the power produced by the solar panel by using a maximum power point tracking algorithm [22]. Other researchers have experimentally determined the best operating point of a specific experimental PVRO system for a given power input, and have implemented a controller that selects the system operating point based on the measured power coming from the PV array [20]. However, none of the research has focused on actively controlling the temperatures of the PV panel and RO feed water to improve system performance.
One barrier to wide implementation of small-scale PVRO systems is their cost. Reverse osmosis is an energy intensive process, especially when desalinating sea water, so large
photovoltaic arrays are required [21]. A recent feasibility study determined that for many remote, off-gird areas, PVRO is economically competitive with diesel powered systems [23]. However, the majority of the system lifetime costs of PVRO systems are their capital costs, while the largest lifetime cost of diesel-powered RO systems are their fuel costs. A large portion of the capital costs of PVRO systems are the costs of the solar panels and the associated
electronics. Improving the conversion efficiencies of the solar panels will reduce such costs, since fewer efficient solar panels are required to provide the same amount of electrical power to a PVRO system. Also, reducing the total cost of PVRO systems makes them economically feasible for more regions.
2.4
Cooling PV Panels
For a given level of solar insolation, a solar panel produces more electrical power when its temperature is low [24]. Many methods of cooling solar panels, including air cooling, water cooling and cooling using liquid metals, have been investigated, implemented and patented [25-33].
Air cooling methods include both active and passive convection cooling. An example of an active air cooled system is one in which the solar panel is mounted on a heat exchanger duct [26]. Passive air cooled systems for rooftop photovoltaics [25] and for home air heating [27] have also been designed. A mono-crystalline solar cell array that incorporates passive convection cooling and solar concentrators has been developed [34].
Cooling using water and liquid metals has been studied. Forced convection cooling methods using liquid water on both the upper and lower solar panel surfaces have been proposed. A water cooling system for PV panels in which water is siphoned through flat-plate heat
exchangers mounted on the backs of the panels has been demonstrated [32]. Forced convective cooling by spraying and by trickling thin films of water on the upper surfaces of PV panels has also been tested, showing increases in electrical output [29-31]. Finally, a liquid indium gallium alloy has been proposed as a coolant for concentrated solar cells [33]. This cooling method has been proposed for cooling concentrated solar cells in a large-scale PVRO plant in Saudi Arabia.
Modifications to increase solar cell cooling have also been proposed. A novel approach to cell module construction uses a textured glass top surface layer, an EVA support layer
embedded with aluminum particles, and a lower layer of aluminum fins [35]. The textured glass increases the top surface convection area by 30%. The aluminum-embedded EVA layer has an increased thermal conductivity of 0.7 W/m-0C. In laboratory tests, this novel design
demonstrated an 8% increase in electrical power when compared with conventional designs, and had a 1 00C lower cell temperature.
2.5
Heating RO Water
The decrease in specific energy required for reverse osmosis desalination with increasing RO feed water temperature has been documented [36], and systems that take advantage of this behavior have been developed. Desalination plants that use the waste heat from power plants to preheat the feed water have been patented [37, 38]. Diesel-powered RO desalination plants that use the waste heat from the diesel generators have also been patented [39, 40]. A small-scale, 3,000 L/day hybrid PV-battery RO desalination plant that uses a solar/thermal process for preheating the RO feed water has been developed [41]. However, this system does not use the RO feed water to cool the photovoltaic panels.
2.6
Combining PV Cooling and Water Heating
Solar panel cooling combined with water heating has been studied and implemented, although not specifically in the context of increasing the fresh water production of a PVRO system. The literature focuses on cooling the solar panels and heating water or air for
domestic/industrial heating and hot water [27, 42, 43], and flat plate heat exchangers for cooling PV panels while heating domestic hot water are commercially available [44]. Using RO feed
water to cool the photovoltaic panels driving a PVRO system to increase water production has been suggested in the literature, but not physically implemented [5]. A two-circuit heat exchange system for cooling PV panels and heating water used for general desalination, not specific to RO, has been patented, though this system does not include active control or optimization of the solar panel and feed water temperatures [6].
This thesis demonstrates that using the RO feed water to cool the PV panels of a PVRO system can greatly increase the total daily fresh water production. Preliminary calculations of potential increases in total daily water production of a thermally managed PVRO system show that practical implementation of this concept is worth pursuing. A controller design for
optimization of the solar panel and feed water temperatures is presented, and its behavior is simulated. Increases in water production are demonstrated experimentally, validating the concept.
CHAPTER
3
TECHNICAL DISCUSSION AND ANALYSIS
3.1 Fundamentals
3.1.1 Thermal Characteristics
For a given level of incident solar radiation, a PV panel produces more electrical power if the solar cell temperature is lower. This effect is shown in Figure 3.1, which is based on the two-diode model found in [24]. Therefore, cooling the solar panel will increase the amount of
electricity produced. 120 - Cell Temp 250C 100 - 'Cell Temp 450C "'"" Cell Temp 650C 80 ( 60 Increasing 40. temperature 20 0 5 10 15 20 Voltage (V)
Figure 3.1: Effect of increasing temperature on solar panel power. Figure by A. Bilton, based on [24], used with permission.
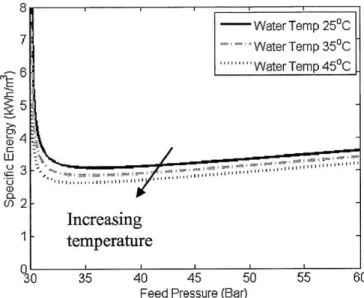
RO membranes have the opposite thermal characteristic. Figure 3.2 shows the effect of increasing the feed water temperature on the energy required for the RO to produce a given
amount of fresh water for a given pump pressure. As the temperature of the feed water
increases, the amount of energy required to desalinate water decreases [36]. This occurs since the membrane becomes more permeable as the water temperature increases. Thus, warming the reverse osmosis feed water will increase flow of clean water across the membrane, as long as its temperature remains below the maximum operating temperature specified by the manufacturer,
typically around 450C [45]. Above this temperature, the polymer reverse osmosis membrane will start to break down.
8--Water Temp 250C 7 Water Temp 350C -6 Water Temp 450C -Increasing 1 temperature -30 35 40 45 50 55 60
Feed Pressure (Bar)
Figure 3.2: Effect of temperature on specific energy required for desalination as a function of pressure. Water quality increases with increasing pressure. Figure by A. Bilton, used with permission.
3.1.2 Thermal Management Concept
The thermal characteristics of the PV panel and RO membrane are complementary, and can be exploited. This can be done by using a heat exchanger to cool the PV panel and warm the incoming feed water. This causes additional electrical power to be produced by the solar panel and more fresh water to be produced by the RO. The ability to cool the PV panels also permits
the addition of simple, low-cost, concentrating mirrors, increasing the total amount of clean water produced without overheating the solar panel. An active control that manages these temperatures is required to maximize water production, while ensuring that the PV panel and the RO membrane do not overheat. This basic thermal management concept of using the RO feed water to cool the solar panel (with concentrating mirrors attached) by flowing it through a heat exchanger is shown schematically in Figure 3.3.
Concentrating Electrical Power
Mirrors Cool Water
Warm Water Solar Panel RO Membrane Clean Heat Water Exchanger Pump El ectronics Recovery Seawater Device Intake Brine
Figure 3.3: Schematic representation of a PVRO system with concentrating mirrors, cooled by incoming RO feed water
3.2
Heat Transfer Analysis
Preliminary estimations of the increase in clean water production that can be achieved using thermal management are needed to determine whether this concept is worth pursuing.
Simulations of PVRO system performance over a day can be used to make these estimations. Analytical models that describe the heat transfer processes within the solar panel and RO feed water are needed, if the system behavior over time is to be properly simulated. This section presents an analytical analysis of the heat transfer within a PVRO system.
3.2.1 Assumptions
In this analysis, it is assumed that a solar panel is used to provide electrical power directly to an RO boost pump, which pressurizes the water entering a pressure vessel containing an RO membrane. The panel is cooled both by free convection with the air, radiation with the sky and by forced convection with cool saline water to be desalinated. The feed water flows through a flat-plate heat exchanger mounted on the back of the solar panel, assumed to be metal
with a high thermal conductance. A schematic of this configuration is shown in Figure 3.4.
- Electrical Power Cool Water Warm Water Solar RO 1. PnelMembrane Clean Water EHeatge Pump Control Energy Electronics Recovery Device Intake Brine
Figure 3.4: Schematic of a PVRO system considered for heat transfer analysis
Water is assumed to enter the heat exchanger at one end and flow in parallel through the channels to the other, as shown in Figure 3.5. Although a temperature gradient over the surface of the solar panel is expected with this flow arrangement, it is expected to be negligible, so the solar panel temperature is assumed constant. Perfect contact between the solar panel and the heat exchanger is assumed. All other sides of the heat exchanger are assumed to be perfectly insulated.
inlet
-- channels
baffles
~ Flow paths
outlet
Figure 3.5: Assumed flow pathway through the heat exchanger
It is also assumed that it is possible to add a supplemental heating plate around the solar panel for additional water heating. The heating area is assumed to be black for high solar absorbency, and to have a high thermal conductivity, such as aluminum and other metals. Heat is transferred between the plate and ambient air by free convection, between the plate and feed water by forced convection and between the plate and sky by radiation. Figure 3.6 shows a conceptual drawing of an integrated solar panel with a supplemental heating plate.
Supplemental heating area Supplemental heating area + + +Solar panel _N Water channels Heat exchanger
Top view of integrated panel Side view of integrated panel
Figure 3.6: Conceptual drawing of solar panel with integrated supplemental heating area.
3.2.2 PV Panel Heat Transfer
Figure 3.7 depicts the PV panel heat transfer. The primary forms of heat transfer between the panel and its surroundings are radiation with the sun and sky, convection with the ambient air and, when the heat exchanger is used, conduction and convection with the seawater in the heat exchanger. Although there is radiation heat transfer between the ground and the panel, it is small compared to that exchanged with the sun and sky so it is neglected here.
QT14.
T T / /
Figure 3.7: Illustration of incident radiation and heat transfer between the solar panel, heat exchanger, incoming seawater, ambient air and sky.
A first-order linear model is used to describe the transient thermal behavior of the solar panel. In this model, the thermal capacitance of the solar panel is assumed to be constant, which is reasonable over the operating range investigated. All temperatures are assumed to be in Celsius, unless otherwise noted.
An energy balance on the solar panel yields:
dTv - t
Q
Qrad QonvQwtr
Cpane
"
= QM -Qo.
=Qol -Pe-,.-Q
-Q,
(1)
dt
where
Cpane is the thermal capacitance of the solar panel in J/0C,
T, is the panel temperature in *C,
Q,,
is the heat flux into the panel in W,Q
0, is the heat flux out of the panel in W,Q,
01 is the radiation from the sun in W,P,,,e is the electrical power out of the panel in W,
Qrad is the heat radiated from the solar panel to the sky in W,
Qc,,,
is the heat lost through convection with the ambient air in W, andQ,
is the heat transferred into the water in W.The solar radiation incident on the panel is found using:
QOI
=IA
(2)
where
I is the incident radiation from the sun in W/m2, and
A is the surface area of the energy-collecting region on the solar panel, assumed to be
2
the upper surface, in m.
It is assumed that the densities and thermal capacitances of the materials used in the solar panel do not change with temperature, so the thermal capacitance of the solar panel is considered to be a lumped parameter and is found using:
Cni = pmAtmCm (3)
where
pm is the density of the mth material in kg/m3,
t, is the thickness of the mth material in m, and
C,. is the specific heat of the mth material in J/kg/0C.
The electrical power produced by the solar panel is assumed to be linearly dependent on temperature (see Figure 3.1), and is found using:
P I, = r71A (1+ kA T) (4)
where
r7 is the efficiency of the solar panel
I is the amount of solar radiation incident on the panel surface, in W/m2 k is the temperature coefficient for change in power per degree C, and
AT is the difference between the panel temperature and the solar cell temperature at
standard test conditions (T,,d), and is defined as:
AT=T,, -Td (5)
The heat lost from the panel through radiation with the sky is found using:
QA = T,, -T, 4) (6)
where
e is the thermal emissivity of the solar panel
- is the Stephan-Boltzmann constant, 5.67 x 10⁻⁸ W/m2-K4
T, is the panel temperature in K, and
Ty is the sky temperature in K.
The heat loss through convection with the ambient air is found using Newton's law of cooling:
Q_
= ha, A (T,, - T.) (7)where
hair is the convection coefficient for the air in W/m2/OC, and
T.i, is the ambient air temperature.
The heat transferred from the solar panel to the water in the heat exchanger is found using:
Q.,,
= hWA(
T, - T.) (8)where
h, is the convection coefficient for the seawater in W/m2/oC, and
T, is the incoming water temperature in *C.
Assuming constant temperatures in the above equation provides an upper bound on the heat transferred to the water, since it ignores the temperature rise in the water as a function of channel position. This assumption is justified since the temperature rise in the water will be small, and the heat capacity of seawater is large. A more complete analysis requires that the panel and water temperatures vary over the length of the panel.
3.2.3 Supplemental Area Heat Transfer
As with the solar panel, a first-order model is used to describe the time-dependent behavior of the additional heat-transfer area used to warm the incoming seawater, by flowing it beneath the supplemental heating plate. An energy balance on the additional heating area yields:
dT
Cpate dt " Q, -Q., =Q. -Qrd -Qonv - Qwt (9)
where
Cpiate is the thermal capacitance of the supplemental heating plate in J/0C, and
Tp,,, is the temperature of the supplemental heating plate.
The thermal capacitance of the supplemental heating plate is:
CP,te = Pal ApatetplateCa
where
Pal is the density of the plate in kg/m3and
Ap,,,, is the surface area of the side of the plate facing the sun, assumed to be the upper
surface, in in,
tpl,,,e is the plate thickness in m, and
Cal is the specific heat of the plate in J/kg/0C.
The terms
Qo,
, Q,,dQc,,,
and Qw,, for the additional heating plate are defined as inEquations (2), (6), (7) and (8), respectively, with T,,,, substituted for T, and Ap,, substituted
for A. In Equation (6), pa,,,, the emissivity of the plate, is substituted for e .
3.2.4 Heat Transferred to the RO Feed Water
A first-order approximation is used to determine the temperature of the water entering the RO system after flowing across the solar panels and supplemental heating area. Incoming water temperature is estimated using:
(11)
T,,r = T ,, + """ "
mhc,
where
Twtr is the temperature of the incoming seawater in 'C,
T ,, is the temperature of the water as it flows into the heat exchanger in 'C,
Chapter 3. Technical Discussion and Analysis 36
Qw,,,,
is the heat transferred into the water from the PV panels, W,Qw,,,,, is the heat transferred into the water from the supplemental heating area, W,
th is the mass flow rate of the incoming seawater, kg/s, and c, is the specific heat of seawater, J/kg-*C.
The mass flow rate of the seawater is found using:
rM = pwq, (12)
where
p, is the density of seawater, assumed to be constant in the temperature ranges in this analysis, which are assumed small, and
q, is the volumetric flow rate of the incoming seawater in m3/s.
3.2.5 Heat Transfer from the RO Pressure Vessel to the Ambient
Surroundings
In this analysis, the thermal capacitance of the RO pressure vessel, the RO membrane, and water being desalinated are ignored for simplicity. It is assumed that the heat transfer process between the water flowing through the pressure vessel and the air surrounding the pressure vessel can be approximated using internal forced convection through a circular channel with a constant wall temperature. Although there are additional heat transfer processes
occurring, including temperature changes within the spiral-wound membrane and radiation with the atmosphere, they are neglected for the following reasons. Since the water flowing through the membrane completely surrounds it, the temperature difference between the incoming water and membrane is assumed to be small. Furthermore, the bulk movement of the water through the pressure vessel is in the axial direction, due to the recovery ratio of clean water to feed water
being approximately 0.09, based on [46]. The thermal resistance of the fiberglass pressure vessel is assumed to be high, so conduction along the pressure vessel in the axial direction is assumed to be negligible, and hence the temperature gradient of the fiberglass wall in the axial direction is
assumed to mimic the temperature gradient within the flowing water. Finally, radiation is neglected since it is assumed heat transfer by convection dominates.
The equation for internal forced convection through a circular channel with constant wall temperature is [47]:
Ti, -TwRO,out ai ~ wRO,in)eu1hc (3
where
Tw,RO,out is the temperature of the water exiting the pressure vessel ('C),
U is the overall heat transfer coefficient that includes the convection coefficient and the
thermal resistance of the fiberglass housing (W/m2
),
A, is the surface area of the pressure vessel (M2),
rh is the mass flow rate of the incoming seawater, kg/s, and
c, is the specific heat of the water (J-kg/*C), assumed to be constant.
There is a temperature differential between the inlet and outlet of the pressure vessel, that is assumed to be small. To determine the average flow of fresh water across the membrane and into the fresh water stream, it is assumed that the average temperature can be used:
T - w,RO,in w,RO,out
RO,avg - 2 (14)
3.3
Case Study
A case study estimates the increase in clean water production that can be achieved by adding thermal management to a small-scale PVRO system. Here, the performance of a nominal PVRO system that produces 10,000 liters of fresh water per day is modeled in Simulink, using the equations presented in the previous section, as well as some additional equations for the RO system, which follow. Results show that significant performance improvements can be achieved when thermal management and concentrating mirrors are incorporated into a PVRO system.
3.3.1 Assumptions
In this case study, a nominal system providing 10,000 liters of clean water per day is assumed to be installed in Limassol, Cyprus. The system is located sufficiently close to the water source so that the power required to transport water from the source to the desalination unit is negligible. The system is assumed to have a recovery ratio, the ratio of clean water produced to incoming seawater, of 30%, based on several systems found in [48]. It is assumed that the system operates over the course of a typical July day in Cyprus, with a clear sky and no wind.
Dynamic models of the nominal system are created in Simulink for the following configurations: traditional operation (i.e. no cooling or heating), operation with panel cooling, operation with both panel cooling and water heating, operation with panel cooling and water heating using 50% additional area, and operation with panel cooling, water heating, and solar concentrating mirrors providing 50% additional incident sunlight. The behavior of the system in each configuration is simulated using ambient temperature data from July 15, 2009, in Limassol, Cyprus [49].
Incident solar radiation for a typical summer day in Cyprus is generated using MATLAB code provided by Amy Bilton, based on [50]. The code simulates solar radiation on an
arbitrarily inclined solar panel as a function of geographic location, date, sky clarity and panel tilt angle from the horizontal. In all models, the solar panel tilt angle is assumed to be 8 degrees
above the horizontal, which is the optimum tilt angle for summer operation in Limassol [51]. For simplicity, the thermal capacity of the water within the RO pressure vessel was ignored, and the temperature of the water within the RO units was assumed to be the same as the water exiting the heat exchanger. A 10,000 Liter/day RO system can be configured in several ways, with RO membranes and pressure vessels arranged in a combination of series and parallel configurations, and the heat transfer within the vessel will vary depending on the arrangement. Since the purpose of this simulation was to estimate performance improvement to determine whether or not the concept was worth pursuing, this simplification was deemed acceptable, and Equations (13) and (14) are not used here.
In addition to the heat transfer equations presented above, models are needed to
determine the flow rate of feed water entering the RO unit, the electrical power used by the RO unit and the amount of electrical power required to circulate the feed water through the heat exchangers. The models for the RO system that follow are based on empirical data rather than being derived from first principles, and are only used for this case study.
3.3.1.A Modeling of RO System
The flow rate of incoming seawater is assumed to be a function of the electrical power and incoming water temperature. For simplicity, the flow rate at 25*C (standard testing conditions for RO membranes), gw25-c , is assumed to have the following behavior:
qW@2s-c= a.PO + C (15)
where PRO is the electrical power into the RO unit and a , b and c are coefficients determined from curve-fitting an experimental data set. The power going into the RO unit is found using:
PRO elec Pcool (1
where P,,, is the electrical power required to pump cooling water across the solar panels and across any supplemental heating area, and Pe, is the electrical power produced by the solar panels, as defined previously.
Once the flow rate at 25'C is calculated, the flow rate at other temperatures, q., is found using a temperature correction factor, T,7 :
q, = @ (17)
Tom
The temperature correction factor is found using:
=10-6)T +(1.091x 10⁻²)T,
- 0.2627T,, + 3.625
(18)where T,,,. is the average temperature of the water in the RO pressure vessel in *C. This equation was found by curve-fitting temperature correction factors from RO membrane manufacturer data [45].
The clean water produced, qc,, is found using:
qcl = rq, (19)
where r is the recovery ratio.
3.3.1 .B Power Required for Circulating Water through the Heat Exchanger
The power required for pumping water across the solar panels and any supplemental heating area is estimated as follows:
PO01 =7 (nA+A,) (20)
where
Y is the amount of power in Watts required to pump the water across one square meter of panel,
n is the number of solar panels, and
A, is the total supplemental heating area in M2.
3.3.1.C Concentrated Sunlight
For system configurations that include concentrating mirrors, the total amount of incident sunlight on the panel was approximated as follows:
I. = (1+p)I (21)
where p is the percentage of sunlight reflected by the concentrating mirrors (see Figure 3.3). Here, a case in which the mirrors reflect 50% of the incident sunlight is considered.
3.3.2 Simulation Parameters
3.3.2.A Solar PanelIt is assumed that any new system will use the most cost effective solar panels, which are likely the most efficient commercially available panels. In this case study, it is assumed that the solar panel array consists of Sun Power Corporation 230-Watt solar panels. Panel parameters are listed in Table 3.1, and include the heat capacitances and temperature coefficients used for
electrical power calculations. Parameters were taken from the manufacturer data sheet [52], and specific heats were found in [53].
Table 3.1: Solar Panel Parameters Power Rating (W) 230
77, 17.9%
k (dimensionless) -0.0038
Cpanei (J/oC) 7119.7
(M2) 1.2401
3.3.2.B PVRO System Parameters
System parameters are listed in Table 3.2, and include the number of solar panels, recovery ratio, and parameters for Equation (15), flow rate calculation.
Table 3.2: Nominal System Parameters
Number of Panels 33
Recovery Ratio (r) 0.3
a 0.04928
b 0.4355
c -0.7671
3.3.2.C Heat Transfer Properties
Heat transfer parameters, are listed in Table 3.3. The typical seawater temperature during the summer in the Mediterranean Sea is 25*C [54], so it is assumed that the seawater flowing
into the system is at 25'C. Under clear sky conditions, the sky temperature is assumed to be -5*C (268 K) [55]. The convection coefficient, ha,, for heat transfer between the panel and still air, and between the plate and still air, is assumed to be 10 W/m2/*C [56]. The convection coefficient between the water and inner heat exchanger surface, hwtr is assumed to be 23 W/m2
/*C, which is based on experimental data collected using SunDrum Solar's SDM 100 thermal collector. The supplemental heating area is assumed to be made of thin sheets of aluminum (approximately 1 mm thick) coated with Thurmalox* Selective Black Solar Collector Coating [57]. Material data was found in [58-60].
Table 3.3: Heat Transfer Parameters Tsky(K) 268 hair (W/m2/oC) 10 hwtr (W/m2/OC) 23 6 0.95 piate 0.52 Tstd (0 C) 25 Twin (*C)
25
psw (kg/m3) 1023.34 c (J/kg/OC) 3993 tplate (M) 0.008 Pal (kg/m3) 2700 Cal (J/kg/0C) 930.6 y(W/m2) 1.53.3.3 Case Study Results
The results of the simulations of the nominal system performance are shown in Table 3.4. Note that the percent increases in the right-most columns are in reference to the baseline case -the case in which -the panels are not cooled, and no solar concentrating mirrors are used.
Table 3.4: Nominal System Performance for July in Cyprus
Configuration TPrmax TROmax Clean Water % Increase in
(OC) (0C) Produced (L/day) Water Produced
No Cooling 57 25 14,946 N/A Cooling 40 25 15,347 2.7% Cooling + Heating 40 28 16,700 11.7% Cooling + Heating + 50% 40 30 17,707 18.5% Supplemental Heating Cooling + Heating + 48 29 22,415 50.0% Concentrating at 50%
The simulations show a 2.7% increase in water production when the panels are cooled, and substantial increases in water production when the incoming water is heated. The results suggest that water production increases by 3% per degree Celsius it is heated. This agrees well with the membrane permeability temperature dependence published by RO membrane
manufacturers [7, 45].
As expected, the greatest increases in water production occur when concentrating mirrors are used. Although the panel temperature increases as the amount of incident sunlight increases, more than enough additional electrical power is produced to offset the loss in conversion
efficiency. Since the RO feed water is used to cool the panels subjected to concentrated sunlight, the panel temperature remains below the baseline case, where the panel is not cooled nor
subjected to concentrated sunlight. Also, approximately the same amount of additional heating of the RO feed water occurs when the sunlight is concentrated at 50 % as when the 50%
supplemental heating area is used. Concentrating sunlight on a panel cooled by the RO feed water clearly provides the most dramatic improvement in water production.
CHAPTER
4
CONTROLLER DESIGN
The analysis and case study presented in Chapter 3 assume that all the RO feed water flows through the heat exchanger. Although this arrangement will cool the solar panels and warm the RO feed water, the temperatures of the solar panel and RO feed water cannot be
directly controlled. The flow rate through the heat exchanger is the same as that through the RO system, and is dictated by the operating point of the RO pump. It also disregards operating constraints that are present in a real system. For example, it is possible to reach an operating point in which the RO feed water becomes too hot when using concentrating mirrors under summer operation in the assumed configuration, which is undesirable. Therefore, a controllable system is needed.
This chapter formally states the control problem as a constrained multiple input, multiple output problem. It also presents a controllable PVRO system design, the system equations, the controller design and simulation of its performance.
4.1
Formulation of the Control Problem
The desired controller will maximize the clean water produced by a PVRO system by actively managing the temperatures of the photovoltaic panel and the RO feed water in response to changes in the incoming solar radiation, ambient air temperature and source water
temperature. It will also ensure that the operating constraints are not violated. These constraints
include limits on the maximum solar panel temperature, maximum RO feed water temperature, maximum heat exchanger inlet pressure and minimum RO boost pump pressure.
4.1.1 System Constraints
The power produced by a solar panel for a given level of solar radiation increases as its cell temperature decreases. If the cell temperature becomes too high, the solar cell becomes very inefficient. Also, the encapsulating polymer, typically EVA, used in solar panels will start to soften at high temperatures making the panel susceptible to delamination [61]. For these reasons, the manufacturers typically list the maximum operating temperature of a solar panel
around 80*C.
A reverse osmosis membrane is typically composed of a thin polyamide film layer mounted on a porous polysulphone support backing [10]. The maximum service temperature for
an RO membrane is typically 45*C [7, 45], as above this temperature the membrane will break down.
The heat exchanger mounted on the back of the solar panel is assumed to consist of two flat plates riveted together and sealed with an adhesive, which forms thin flow channels. High water pressure at the heat exchanger inlet will cause the sealant to fail. Therefore, the water pressure at the heat exchanger inlet must remain below the maximum operating pressure of the
heat exchanger.
The RO boost pumps are positive displacement pumps that have a maximum suction head. If the boost pumps are starved for water, cavitation may occur. Also, a negative gauge pressure at the RO boost pump inlet means the maximum pressure at the boost pump outlet will not be as high as it could be for a given applied power, so the flow rate of clean water across the
RO membrane will be reduced. Therefore, the pressure at the boost pump inlet must not fall below 0 gauge pressure.
4.1.2 Control Problem Statement
The control problem is formally stated as follows. The objective is to maximize the clean water flow across the RO membrane:
maximize (q ) (22)
This can be achieved by minimizing the solar panel temperature and maximizing the RO feed water temperature:
minimize(T,) (23)
maximize
(T
(24)subject to the following typical constraints:
- The solar panel temperature must remain below its maximum operating temperature:
T, <800C
- The feed water temperature must remain below its maximum operating temperature, leaving room for potential overshoot:
TRO <40C
(25)
(26) - The pressure at the heat exchanger inlet must remain below its maximum operating
pressure:
i, f PCm
- The RO boost pumps must not be starved for water:
PRO
Chapter 4. Controller Design 48
(27)
![Figure 1.1: Areas with good solar resources, from [3].](https://thumb-eu.123doks.com/thumbv2/123doknet/14678317.558614/14.918.169.718.113.525/figure-areas-good-solar-resources.webp)
![Figure 1.2: Geographic areas where PVRO is economically feasible [4].](https://thumb-eu.123doks.com/thumbv2/123doknet/14678317.558614/15.918.102.839.103.404/figure-geographic-areas-pvro-economically-feasible.webp)

![Figure 2.1: Schematic illustrating the production of electricity in a solar panel, from [8]](https://thumb-eu.123doks.com/thumbv2/123doknet/14678317.558614/21.918.270.636.110.386/figure-schematic-illustrating-production-electricity-solar-panel.webp)
![Figure 3.1: Effect of increasing temperature on solar panel power. Figure by A. Bilton, based on [24], used with permission.](https://thumb-eu.123doks.com/thumbv2/123doknet/14678317.558614/27.918.269.619.604.882/figure-effect-increasing-temperature-solar-figure-bilton-permission.webp)