HAL Id: inserm-00677158
https://www.hal.inserm.fr/inserm-00677158
Submitted on 3 Aug 2012
HAL is a multi-disciplinary open access
archive for the deposit and dissemination of sci-entific research documents, whether they are pub-lished or not. The documents may come from teaching and research institutions in France or abroad, or from public or private research centers.
L’archive ouverte pluridisciplinaire HAL, est destinée au dépôt et à la diffusion de documents scientifiques de niveau recherche, publiés ou non, émanant des établissements d’enseignement et de recherche français ou étrangers, des laboratoires publics ou privés.
social causation or health-related selection? Evidence
from the Whitehall II Cohort Study, 1991-2004.
Marko Elovainio, Jane Ferrie, Archana Singh-Manoux, Martin Shipley, G
David Batty, Jenny Head, Mark Hamer, Markus Jokela, Marianna Virtanen,
Eric Brunner, et al.
To cite this version:
Marko Elovainio, Jane Ferrie, Archana Singh-Manoux, Martin Shipley, G David Batty, et al.. Socioe-conomic differences in cardiometabolic factors: social causation or health-related selection? Evidence from the Whitehall II Cohort Study, 1991-2004.: Social Causation or Health Selection. American Jour-nal of Epidemiology, Oxford University Press (OUP), 2011, 174 (7), pp.779-89. �10.1093/aje/kwr149�. �inserm-00677158�
February 20, 2010
AJE-01190-2010.R2
Running title: Social Causation or Health Selection
Socioeconomic Differences in Cardiometabolic Factors: Social
Causation or Health-related Selection? Evidence from the Whitehall II
Cohort Study, 1991-2004
Marko Elovainio, Jane E. Ferrie, Archana Singh-Manoux, Martin Shipley, G. David Batty, Jenny Head, Mark Hamer, Markus Jokela, Marianna Virtanen, Eric Brunner, Michael G. Marmot, Mika Kivimäki
Author affiliations: Department of Epidemiology and Public Health, UCL Medical School, London, England, UK (Marko Elovainio, Jane Ferrie, Archana Singh-Manoux, Martin Shipley, G. David Batty, Jenny Head, Mark Hamer, Markus Jokela, Mariana Virtanen, Eric Brunner, Michael Marmot, Mika Kivimäki); National Institute for Health and Welfare, Helsinki, Finland (Marko Elovainio); INSERM U1018, Hôpital Paul Brousse, Villejuif Cedex, France (Archana Singh-Manoux); Department of Behavioral Sciences, University of Helsinki, Finland (Markus Jokela); Finnish Institute of Occupational health, Helsinki, Finland (Marianna Virtanen).
Correspondence to: Marko Elovainio, National Institute for Health and Welfare, Helsinki, P.O.
Box 30, Finland (email: marko.elovainio@thl.fi)
Word count Abstract: 199 Main text: 3498 References: 55 Tables: 3 (+1 box) Figures: 0
ABSTRACT
In this study, the health-related selection hypothesis (health predicts social mobility) and the social causation hypothesis (socioeconomic status influences health) were tested in relation to cardiometabolic factors. We screened 8,312 men and women 3 times over 10 years between 1991 and 2004 for waist circumference, body mass index, systolic and diastolic blood pressure, fasting glucose, fasting insulin, serum lipids, C-reactive protein, and interleukin-6, identified participants with the metabolic syndrome and measured childhood health retrospectively. Health-related selection was examined in two ways, (1)
childhood health problems as predictors of adult occupational position, (2) adult cardiometabolic factors as predictors of subsequent promotion at work. Social causation was assessed using adult occupational position as a predictor of subsequent change in cardiometabolic factors. Hospitalization during childhood and lower birth weight were associated with lower occupational position (both p<0.002). Cardiometabolic factors in adulthood did not consistently predict promotion. In contrast, lower adult occupational position predicted adverse changes in several cardiometabolic factors (waist circumference, body mass index, fasting glucose, and fasting insulin) and an increased risk of new-onset metabolic syndrome (all p<0.008). These findings suggest that health-related selection operates at younger ages and that social causation contributes to socioeconomic differences in cardiometabolic health in midlife.
Key words: Socioeconomic status, health selection, longitudinal, cardiometabolic, public health.
Abbreviations: ATPIII, Adult Treatment Panel III; BMI, body mass index; CHD, coronary heart disease; CI,
Confidence Interval; CRP, C-reactive protein; CS, Clerical and Support staff; EO, Executive Officer; IL-6, interleukin-6; HEO, Higher Executive Officer; HDL, high density lipoprotein; LDL, low density lipoprotein SEO, Senior Executive Officer; SES, socioeconomic status; UG, Unified Grade.
A graded association between socioeconomic status (SES), diabetes and coronary heart disease (CHD) incidence, with higher cardiometabolic risk in socially disadvantaged groups, has been shown repeatedly (1-7). These associations are often interpreted to indicate that SES affects health, either directly or indirectly (the social causation hypothesis). Low SES is associated with low income, poor career prospects, and greater risk of unemployment. All these determine the ability to consume goods and services, for example, high quality food or health care, which in turn affect health (8, 9). Income differences, even if income is above the poverty line, may also lead to differential access to social participation and social capital, which are related to health inequalities (10-13). Low SES is also associated with higher exposure to occupational health hazards, both physical and psychosocial, potentially contributing to health problems (14-18). Furthermore, differences in social values and behavioral preferences between SES groups may create variations in health (19).
The relationship between SES and health is not necessarily unidirectional as health can function as a selective mechanism in relation to SES (20, 21). It has been suggested that childhood health is linked to educational achievements and labor market prospects and thus to adult SES, which might account for the socioeconomic differences in health in adulthood (the health selection
hypothesis)(22-25). Particularly severe and limiting health problems during adulthood may increase the risk of an income shortfall and poor career prospects. Although the strength of these associations is likely to be dependent on the health problem in question and the local social policy context, it has been argued that persons with severe chronic illness tend to be poorer because their illness
endangers their economic potential and resources (26).
Taken together this evidence is consistent with the hypothesis that the relationship between SES and health is reciprocal, bound in a reinforcing cycle where the direction of causality is difficult to determine (27, 28). It is possible, for example, that although both health selection and social causation operate over the life course, their relative importance varies from one developmental stage to another. Health problems early in life may have severe and long-term consequences as they affect educational attainment and subsequent adult SES (22, 24, 25). In contrast, health problems that emerge in
adulthood may play only a minor role in the overall relationship between health and change in SES (11, 21, 29). Longitudinal research designs are needed to capture such life-stage dependent
relationships. Furthermore, research using objective indicators of health would strengthen the existing evidence as self-reported measures may be biased by socially-patterned reporting of health.
In this study from the Whitehall II cohort (2), we investigate health-related selection and social causation using repeated measurements of objectively-assessed cardiometabolic factors in adulthood. To assess the selection process at different stages of the life-course, we examine the extent to which childhood health predicts socioeconomic mobility and the extent to which adult cardiometabolic factors, such as obesity, high blood pressure, lipid levels, glycaemia and inflammation, predict future promotion at work. To study social causation, we assess whether adult SES predicts change in cardiometabolic factors over a 10-year period.
MATERIALS AND METHODS Study population and design
The Whitehall II study sample recruitment (phase 1) took place between late 1985 and early 1988 among all staff from 20 London-based Civil Service departments. With a response rate of seventy-three percent, 6,895 men and 3,413 women were enrolled into the study (2, 30). Since phase 1 there have been several further data collection phases. Baseline data on cardiometabolic factors for the present study are drawn from phase 3 (1991-1993). Repeat measures at phase 5 (1997-1999) and phase 7 (2003-2004) provided the 5-year and 10-year follow-up data respectively. Data on childhood SES and health were collected retrospectively at phases 1, 3 and 5. Informed consent was gained from all participants. The University College London Medical School Committee on the Ethics of Human Research approved the protocol.
SES and health in childhood
was used as a measure of parental SES. Self-reports of birth weight (phase 3) and hospitalization in childhood (phase 5 - "Did any of the following things happen during your childhood (that is up until you were 16)? You spent 4 or more weeks in hospital?" response format: Yes/No) were used as indicators of childhood health.
SES and social mobility in adulthood
We used a 6-level civil service employment grade as the measure of SES at phases 3, 5 and 7. For those who left the civil service after phase 3, we used the last known employment grade reported at phases 5 and 7. The six employment grade categories were: Unified Grade 1-6 (UG1-6; highest grade), Unified Grade 7 (UG7), Senior Executive Officer (SEO), Higher Executive Officer (HEO), Executive Officer (EO), Clerical and Support staff (CS; lowest grade). Upward social mobility
(promotion) was defined as ending up in a higher employment grade at follow up compared to grade at baseline using the 6-level classification. We examined the cross-sectional correlation of
employment grade with other indicators of SES: income, Registrar General's social class, and educational level. As can be seen in the Box, the 6-level employment grade measure was strongly correlated with income (Pearson r = 0.90, p<0.0001), strongly correlated with Registrar's General social class (r = 0.73, p<0.0001) and moderately correlated with educational level (r = 0.43, p<0.0001).
Cardiometabolic factors in adulthood
The measurement of cardiometabolic factors at phases 3, 5 and 7 using standard protocols is presented briefly as it has been described previously (31-34). We assessed waist circumference, weight, and calculated body mass index (BMI, weight in kg/ height in meters squared). We measured systolic blood pressure and diastolic blood pressure twice in the sitting position after 5 minutes of rest with the Hawksley random-0 sphygmomanometer (phases 3 and 5) and OMRON HEM 907 (phase 7). The average of 2 readings was taken to be the measured systolic and diastolic blood pressures. Oral glucose tolerance tests, according to the World Health Organization protocol, were administered
following a minimum 5-hour fast. Known diabetics did not participate in this part of the screening. High density lipoprotein (HDL)-cholesterol and triglycerides were measured within 72 hours in serum stored at 4°C using enzymatic colorimetric methods. We used the Friedewald formula to calculate low density lipoprotein (LDL) cholesterol concentration. C-reactive protein (CRP) and interleukin-6 (IL-6) were determined in serum; samples were stored at -80°C (these data were available only for phases 3 and 7). Plasma glucose was measured using an electrochemical glucose oxidase method and serum insulin by radioimmunoassay using a polyclonal antiserum. Metabolic syndrome was determined using National Cholesterol Education Program Adult Treatment Panel III (ATPIII) criteria based on waist circumference, HDL cholesterol, triglycerides, blood pressure and fasting plasma glucose (35).
Statistical analysis
We used SAS 9.1 and Stata 11.0 statistical software for Windows for all analyses. There were no clear differences in our results between men and women, so the data were pooled and adjusted for sex. We ran separate sets of analyses to assess evidence for health selection and social causation as explanations of the associations between SES and cardiometabolic factors.
Test of the health-related selection hypothesis: To test health-related selection (childhood
health predicting adult SES) we divided participants into six groups on the basis of employment grade at phase 3 and used linear and multinomial logistic regression analysis to summarize the associations of childhood hospitalization (yes/no) and birth weight (lbs) with employment grade at baseline,
adjusting for age, sex and parental SES. Regression coefficients for employment grade, treated as a continuous outcome, were calculated using linear regression analysis. We also examined whether these childhood variables predicted promotion in adulthood compared to staying in the same
employment grade throughout the follow up. To examine the extent to which missing childhood data were associated with adult employment grade, we performed a corresponding multinomial logistic regression analysis with the status of the missing data (yes/no) as the exposure and repeated the analysis after multiple multivariate imputation for missing values (a detailed description of the method
is provided below).
To test the heath-related selection hypothesis in adulthood, the effect of cardiometabolic factors at phase 3 on promotion over 10 years (from phase 3 to phase 7) was modelled comparing those subsequently promoted; those demoted and those who stayed in the same grade, adjusted for age and sex. We added "non-response/death at phase 7" (yes/no) as a further outcome category in order to examine selective sample retention. To examine the effect of sample attrition on the findings, we repeated the analysis after multiple multivariate imputation for missing values (see below). We additionally tested the selection hypothesis over 5 year intervals (i.e., from phase 3 to phase 5 and from phase 5 to phase 7) using multilevel longitudinal modeling (xtmixed and xtlogit procedures in Stata, College Station, Texas, USA) (xtmixed and xtlogit procedures in Stata, College Station, Texas, USA) with robust estimation to take into account the fact that repeated measurements on the same participant are correlated. In these models, cardiometabolic factors at phase 3 were fitted as
predictors of promotion between phases 3 and 5 and cardiometabolic factors at phase 5 as predictors of promotion between phases 5 and 7. Levels of the cardiometabolic factors were allowed to change within subjects over time.
Tests of the social causation hypothesis: To test the social causation hypothesis,
associations between baseline adult employment grade and changes in adult cardiometabolic factors over 10 years (from phases 3 to 7) were examined using logistic regression analysis and analysis of variance as appropriate. To examine the extent to which employment grade at phase 3 predicted participation at follow-up, we performed a corresponding logistic regression analysis with non-response/death at phase 7 (yes/no) as the outcome. To test the robustness of our findings, we repeated the analyses in a subgroup excluding participants who had retired by phase 7. To test the causation hypothesis over 5 year intervals (i.e., from phase 3 to phase 5 and from phase 5 to phase 7), we used a multilevel modeling approach (xtmixed and xtlogit procedures in Stata, College Station, Texas, USA). In these models, employment grade at phase 3 was tested as a predictor of change in cardiometabolic factors between phases 3 and 5, and employment grade at phase 5 as a predictor of
change in these factors between phases 5 and 7.
Multiple multivariate imputation for missing values: To retain all participants, multiple
imputed values were generated for the missing data from the variables used in the analysis, by means of PROC MI (SAS 9.1.3 SAS Institute, Cary, North Carolina, USA). Ten datasets were randomly selected, and analyses were conducted on each of these imputed datasets. The mean of these estimates was presented using SAS PROC MIANALYSE. This procedure takes account of the uncertainty in the imputation as well as uncertainty due to random variation (as in all multivariable analyses).
Correction for multiple testing. In all analyses, statistical tests were 2-sided and a P-value of
less than 0.05 was considered statistically significant. Bonferroni corrected P-values were calculated, in addition to uncorrected P-values, to reduce the risk of type 1 errors arising from multiple testing.
RESULTS
Of the 10,308 participants, 8,312 participated in the phase 3 screening. Of the 1,996 participants excluded, 125 had died between phase 1 and phase 3 and 1,871 were non-respondents or had missing data on employment grade. At recruitment to the study (phase 1), those excluded from the current analyses were slightly older (44.8 years compared to 44.4 years, p=0.002), more likely to be women (41.8% vs. 31.0%, p<0.0001), and less likely to be from the highest employment grade (21.8% vs. 31.2%, p<0.0001).
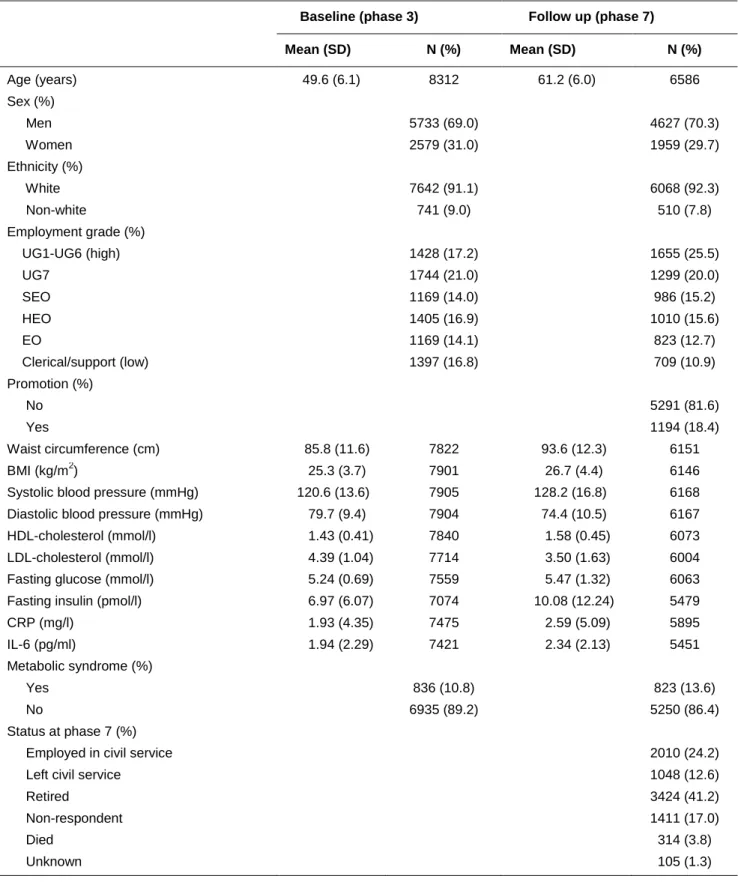
Baseline characteristics of the study participants are shown in Table 1. Most of the participants were in the intermediate employment grade categories (grade levels SEO,HEO and EO, 45.0%) at phase 3 and in the high grade categories at phase 7 (grade levels UG1-UG7, 45.6%). 18.4% had been promoted during follow-up. Adverse changes were observed for most cardiometabolic factor levels during the follow-up, although the cholesterol profile improved. At baseline, 10.8% of participants and at follow-up 13.6% were classified as having the metabolic syndrome.
Health-related selection from childhood to adulthood
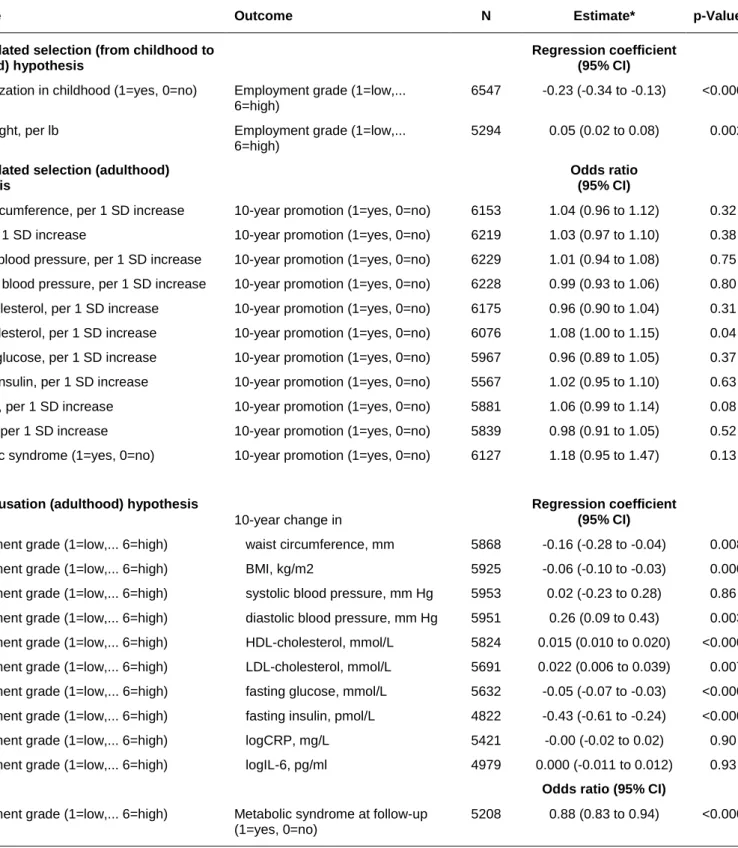
As shown in Table 2, poor childhood health (indicated by hospitalization in childhood and lower birth weight) predicted lower adult employment grade at phase 3, with no statistical evidence of sex differences (p for sex-interaction >0.37). These associations were attenuated after adjustment for parental SES [by 31% from -0.21 (95% CI: -0.03, -0.10) to -0.15, (95% CI -0.24, -0.05) for
hospitalization, N=5,750 in both models; and by 47% from 0.05, (95% CI: 0.02, 0.08) to 0.03 (95% CI: 0.00, 0.05) for birth weight, N=4,701 in both models]. The proportion of participants hospitalized and with lower birth weight increased in a step-by-step manner with each decrease in adult employment grade category. This association was also seen when employment grade at entry to the civil service was used as an outcome. (Online Annex eTable1 and eTable2)
Participants from lower employment grades were more likely to have missing data for
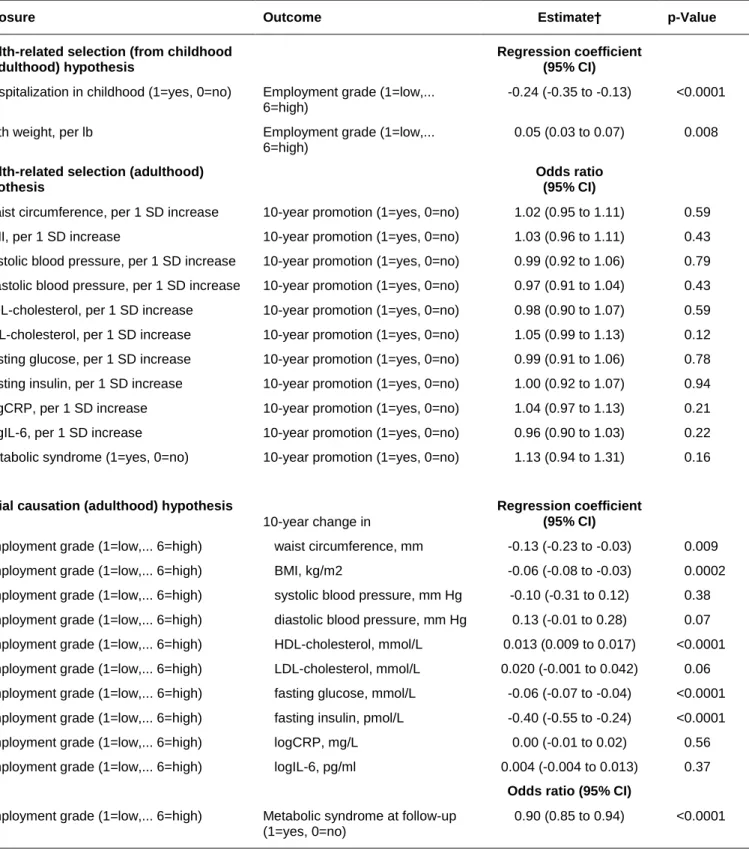
childhood variables than those from the highest employment grade (eTable1 and eTable2). However, as can be seen from a comparison of Tables 2 and 3, analyses based on the entire baseline cohort with imputation suggested that missing data had little effect on estimates of the associations between hospitalization or birth weight and baseline grade.
Health-related selection during adulthood
To test potential health-related selection in adulthood, we analyzed whether cardiometabolic factors at baseline predicted promotion during follow-up. Of the demographic variables, male sex (odds ratio 1.24, 95% CI: 1.09, 1.42), younger age (odds ratio per year 0.91, 95% CI: 0.90, 0.92) and higher employment grade (odds ratio 1.22, 95% CI 1.18, 1.27) were all associated with promotion. There was no firm evidence of an association between educational level at phase 1 and promotion (odds ratio for over 18 vs up to 16 years of education 1.17, 95% CI: 0.99, 1.38).
As expected, adverse cardiometabolic risk factor levels were related to higher levels of non-response and death (eTable3). As shown in Table 2, cardiometabolic factors in adulthood did not predict promotion during the subsequent 10 years. The only exception was LDL-cholesterol which was
associated with higher odds of promotion, but this finding did not survive correction for multiple testing (p=0.44)(Table 2). The findings were similar after exclusion of participants who retired before the end of the follow-up (eTable4). Multilevel analyses of promotion over 5 year intervals appeared to show larger waist, lower diastolic blood pressure and lower LDL cholesterol to be associated with higher odds of promotion (eTable5). In the entire baseline cohort with missing data imputed, there were no associations between cardiometabolic factors and promotion over a 10-year interval (Table 3). For the association between BMI and promotion, but not for other cardiometabolic factors, there was evidence of sex differences (p for interaction=0.008), with no association observed among women (OR 0.93, 95% CI -0.85, 1.02) and a weak direct association in men (OR 1.13, 95% CI 1.03, 1.23).
Thus, there was little consistent evidence that adults with better cardiometabolic health would be more likely to be promoted.
Social causation in adulthood
The associations between adult employment grade and change in cardiometabolic factors during the 10-year follow-up are shown in the lower halves of Tables 2 and 3. Participants in higher employment grades had smaller increases in waist circumference, BMI, fasting glucose, and fasting insulin, more favorable changes in HDL-cholesterol and reduced risk of the metabolic syndrome. However, they also had a smaller reduction in diastolic blood pressure and LDL-cholesterol (although higher employment grade was associated with reduced likelihood of being treated with lipid-lowering drugs and antihypertensive medication at follow-up, eTable6). For BMI, the effect was stronger in women (regression coefficient 0.15, 95% CI: 0.22, 0.07) than in men (regression coefficient=0.03, 95% CI: -0.07, 0.01) (p for interaction 0.003).
Absolute changes in these factors by employment grade category are shown in the online Annex (eTable6 and eTable7). They indicate that the associations of employment grade with changes in BMI, diastolic blood pressure, HDL cholesterol, fasting glucose, and fasting insulin and with lower risk of metabolic syndrome survived after adjustment for multiple testing. Except for diastolic blood
pressure, these associations were also observed in the entire baseline cohort with missing data imputed (Table 3) and in sub-cohorts composed of those with poor and good childhood health (eTable 6 and eTable7). In the 5-year follow-up, higher employment grade was associated with more favorable changes in HDL-cholesterol and fasting glucose and with reduced risk of the metabolic syndrome (eTable8).
DISCUSSION
In this study of British civil servants, early health problems characterized by hospitalization during childhood and lower birth weight predicted lower socioeconomic status, assessed as civil service employment grade, in adulthood independent of parental socioeconomic status. However, after entering the civil service, we did not find strong evidence to suggest that a better cardiometabolic risk profile predicts promotion. In midlife lower socioeconomic status was associated with adverse
changes in adiposity and glucose metabolism over 10 years of follow-up and thus increased the risk of the metabolic syndrome. These associations appeared to be independent of early health problems. Thus the study provides evidence that health-related selection in childhood appears to influence socioeconomic status in adulthood, which in turn influences cardiometabolic profile in later life.
Strengths and weaknesses
Due to missing data, our analyses were based on between 4,542 and 8,312 men and women of the original population of 10,308. We found that lower SES, assessed using employment grade, was associated with higher non-response and death over the follow-up, consistent with its poorer risk factor status. In order to generate spurious support for health-related selection from childhood to adulthood, missingness should have been more common either for individuals with both poor childhood health and high employment grade compared to those with poor childhood health and low employment grade or for those with good health in childhood and low employment grade compared to those with good childhood health and high employment grade. Similarly, selective sample attrition of
those with high employment grade and adverse metabolic profiles or low employment grade and favorable profiles would lead to spurious support for social causation. We cannot see any reason why this would be the case. Furthermore, the main findings of this study were reproducible in the total cohort with missing values imputed using multivariate multiple imputation methods.
Longitudinal data from the Whitehall II study have been used extensively to demonstrate and explain social gradients in adult health. As previously, we used employment grade as a marker of adult SES (2). SES is a multi-faceted concept and it could be argued that grade does not fully capture all these dimensions. In this cohort, employment grade was more strongly associated with income (correlation 0.9) than with education (correlation 0.4). Previous research has shown income to be both a consequence of poor health (28, 36) and a predictor of cardiovascular disease (37) making
employment grade an adequate SES indicator to examine the social causation hypothesis. However, education rather than income appears to be related type 2 diabetes (38). Thus, in relation to diabetes-related metabolic factors our use of employment grade as a measure of SES, given its moderate associated with education, probably provides a conservative test of the social causation hypothesis.
The validity of our measures of childhood health may be questioned as they were collected retrospectively, i.e., the participants were asked to recall their birth weight and hospitalizations of more than four weeks several decades after the events. However, previous studies suggest moderate to good accuracy for self-reported birth weight (39). The accuracy of self-reported birth weight has been shown to be high among those within the normal range for birth weight, as is the case for most of the participants in our study and a relatively high correlation (r=0.83-0.87) between self reported and register-based birth weight has been observed even among middle-aged and elderly participants (40). In addition, measurement imprecision may lead to weaker associations with self-reported birth weight compared with recorded birth weight (39).
Thirteen percent of the participants reported long-term hospitalization before the age of 16. This figure appears high and should be interpreted with caution. In the prospective British 1946 birth cohort study, for example, the prevalence of an illness requiring hospitalization of 3 weeks or more
under the age of 5 was lower, varying from 4% to 10% (41). The validity of self reported use of health care, including hospitalization, have shown to be reasonably good with only small SES differences when the recall time is relatively short (up till 1 year)(42). Bergman and colleagues (43) found recall accuracy over a ten year period to be greater than 80 percent for most conditions leading to
hospitalization, although the validity of self reported hospitalization was somewhat dependent on the specific health problems. In a systematic review, Bhandari and Wagner (44) concluded that as inpatient hospitalization tends to be rare it is highly memorable. Furthermore, it should be noted that for the oldest of our cohort members the period before age 16 spanned the years 1930 to 1946 when hospital stays were longer and periods of convalescence common. During those years a much larger share of inpatients were under 15 than now and the age distribution of inpatients has been changed dramatically from 1970 to 2006 (45).
By using a large number of cardiometabolic risk factors as indicators of ill health or factors contributing to ill health we were able to avoid reliance on self-reported health measures, which may be subject to socially-patterned reporting bias. We could have also used height as an objective measure of childhood health as in some of the previous studies (46). However, this indicator is problematic as height reflects early-life socioeconomic circumstances and genetic influences, in addition to health (47), and taller stature can contribute to upward mobility due to physical appearance as well as health.
Two thirds of our cohort participants were male white collar workers, potentially reducing the generalizability of our findings. Thus, it is not possible to draw inferences about the relative importance of either hypothesis for people out of the labor force or those repeatedly entering or leaving the labor force. Furthermore, occupational groups are, by their very nature, healthier than the general
population, so the range of cardiometabolic factors and SES might be narrower. Besides, there is little downward social mobility in this cohort. Given these limitations, the associations reported here might be under- or over-estimates of the associations in the general population, which includes people not in employment.
Comparison with previous studies
We are not aware of any other study that has repeat data on SES alongside direct assessment of cardiometabolic factors, over an extended follow-up period. A recent analysis of self-report data from Whitehall II suggests that the association between childhood health and adult SES is not accounted for by educational qualifications, childhood SES, mother’s education and care-giving or parents’ illness
(48). Our study supports previous studies that have found selection effects from early life, typically from adolescence to adulthood. Early life health selection has been shown for health behaviors (eg smoking and drinking) and mental health problems (49, 50). It has also been shown that mental disorders are more frequent among socioeconomically disadvantaged individuals (51). However, our findings do not support health-related selection as an important source of socioeconomic differences in adult cardiometabolic health. In men, but not in women, initial BMI was associated with later
promotion and this may be related to gendered norms about masculinity and men’s ideal body weight. There is some evidence to suggest that not only height but in men heft is also viewed positively (52).
A large body of evidence suggests greater morbidity and mortality and worse risk profiles among adults in lower SES groups compared with their counterparts in higher SES groups (2-5, 53-55). Our findings confirm these observations and additionally demonstrate that low adult SES tends to set a trajectory of adverse change in cardiometabolic factors, in particular adiposity, glucose
metabolism and new-onset metabolic syndrome.
Meaning of the study and unanswered questions
Taken together, these findings suggest that multiple processes rather than a single underlying mechanism are likely to drive the socioeconomic differences in cardiometabolic health. We observed that health-related selection operated from childhood to adulthood. However, the direction of the causal association after entering work life seemed predominantly from lower SES to a less favourable
cardiometabolic risk profile, rather than good cardiometabolic health improving SES, modeled here as chances of promotion.
These findings have important implications for policy. The general recommendation would be to focus on the accumulation of risk factors and benefits throughout the life course. Such a strategy should ensure that children with health problems are not disadvantaged with respect to educational opportunities. Determined action is also required to remove material and psychosocial adversities likely to underlie the excess cardiometabolic risk in low socioeconomic groups.
Acknowledgements: We thank all participating civil service departments and their welfare personnel, and establishment officers; the Occupational Health and Safety Agency; the Council of Civil Service Unions; all participating civil servants in the Whitehall II study; all members of the Whitehall II study team. The Whitehall II Study team comprises research scientists, statisticians, study coordinators, nurses, data managers, administrative assistants and data entry staff, who make the study possible.
Funding: The Whitehall II study has been supported by grants from the Medical Research Council; British Heart Foundation; Health and Safety Executive; Department of Health; National Heart Lung and Blood Institute (HL36310), US, NIH: National Institute on Aging (AG13196, R01 AG034454), US, NIH; Agency for Health Care Policy Research (HS06516); and the John D and Catherine T MacArthur Foundation Research Networks on Successful Midlife Development and Socio-economic Status and Health. ME is supported by Work Environment Fund and the Academy of Finland (Grant number 128002). MK is supported by the BUPA Foundation, the Academy of Finland and the EU New OSH ERA Research Programme Grant; GDB is a Wellcome Trust Research Fellow; AS-M is supported by a ‘EURYI’ award from the European Science Foundation; JEF is supported by the Medical Research Council; MJS and MH are supported by the British Heart Foundation; and MGM is supported by a MRC Research Professorship.
REFERENCES
1. Marmot MG, Shipley MJ, Rose G. Inequalities in death--specific explanations of a general pattern?
Lancet 1984;1:1003-6.
2. Marmot MG, Smith GD, Stansfeld S, et al. Health inequalities among British civil servants: the
Whitehall II study. Lancet 1991;337:1387-93.
3. Brunner EJ, Marmot MG, Nanchahal K, et al. Social inequality in coronary risk: Central obesity and
the metabolic syndrome. Evidence from the Whitehall II study. Diabetologia 1997;40:1341-9.
4. Everson SA, Maty SC, Lynch JW, et al. Epidemiologic evidence for the relation between
socioeconomic status and depression, obesity, and diabetes. J Psychosom Res 2002;53:891-5.
5. Kumari M, Head J, Marmot M. Prospective study of social and other risk factors for incidence of
type 2 diabetes in the Whitehall II study. Arch Intern Med 2004;164:1873-80.
6. Kivimaki M, Shipley MJ, Ferrie JE, et al. Best-practice interventions to reduce socioeconomic
inequalities of coronary heart disease mortality in UK: a prospective occupational cohort study.
Lancet 2008;372:1648-54.
7. Mackenbach JP, Stirbu I, Roskam AJ, et al. Socioeconomic inequalities in health in 22 European
countries. N Engl J Med 2008;358:2468-81.
8. Hart JT. The inverse care law. Lancet 1971;1:405-12.
9. Lynch JW, Davey Smith G, Kaplan GA, et al. Income inequality and mortality: importance to health
of individual income, psychosocial environment, or material conditions. British Medical Journal
2000;320:1200-4.
10.
Kawachi I, Kennedy B. The Health of Nations: Why Inequality Is Harmful to Your Health.
New York: New Press, 2002.
11.
Marmot GM. Status syndrome : How your social standing directly affects your health and life
expectancy. London: Bloomsburry Publishing, 2004.
12.
Wilkinson RG, Pickett KE. Income inequality and population health: a review and explanation
of the evidence. Social Science & Medicine 2006;62:1768-84.
13.
Wilkinson RG, Pickett KE. The problems of relative deprivation: why some societies do better
than others. Soc Sci Med 2007;65:1965-78.
14.
Bosma H, Marmot MG, Hemingway H, et al. Low job control and risk of coronary heart disease
in Whitehall II (prospective cohort) study. Bmj 1997;314:558-65.
15.
Chandola T, Brunner E, Marmot M. Chronic stress at work and the metabolic syndrome:
prospective study.[see comment]. BMJ 2006;332:521-5.
16.
Kivimaki M, Virtanen M, Elovainio M, et al. Work stress in the etiology of coronary heart
disease--a meta-analysis. Scand J Work Environ Health 2006;32:431-42.
17.
Karasek RA. Job demands, job decision latitude and meantal strain: Implications for job
redesign. Administrative Science Quarterly 1979;24:285-95.
18.
Power C, Stansfeld SA, Matthews S, et al. Childhood and adulthood risk factors for
socio-economic differentials in psychological distress: evidence from the 1958 British birth cohort. Social
Science & Medicine 2002;55:1989-2004.
19.
Johnson W, Kyvik KO, Mortensen EL, et al. Does education confer a culture of healthy
behavior? Smoking and drinking patterns in Danish twins. American Journal Epidemiology
2010:[Epub ahead of print].
20.
Blane D, Davey Smith G, Bartley M. Social selection: What does it contribute to social class
differences in health? Sociology of Health and Illness 1993;15:1-15.
21.
Manor O, Matthews S, Power C. Health selection: The role intra- and intra-generational
mobility on social inequalitues in health. Social Science & Medicine 2003;57:2217-27.
22.
van de Mheen H, Stronks K, Schrijvers CT, et al. The influence of adult ill health on
occupational class mobility and mobility out of and into employment in the The Netherlands. Soc
Sci Med 1999;49:509-18.
23.
Case A, Fertig A, Paxson C. The lasting impact of childhood health and circumstance. Journal
of health economics 2005;24:365-89.
24.
Haas SA. Social selection and the process of social stratification: the effect of childhood health
on socioeconomic attainment. Journal of Health and Social Behavior 2006;47:339-54.
25.
Palloni A, Milesi C, White RG, et al. Early childhood health, reproduction of economic
inequalities and the persistence of health and mortality differentials. Soc Sci Med 2009;68:1574-82.
26.
van Agt HME, Stronks K, Mackenbach JP. Chronic illness and poverty in The Netherlands..
European Journal of Public Health 2000;10:197-200.
27.
Mulatu MS, Schooler C. Causal connections between socio-economic status and health:
reciprocal effects and mediating mechanisms. J Health Soc Behav 2002;43:22-41.
28.
Halleröd B, Gustafsson J-E. A longitudinal analysis of the relationship between changes in
socio-economic status and changes in health. Social Science & Medicine
2010;10.1016/j.socscimed.2010.09.036.
29.
Cardano M, Costa G, Demaria M. Social mobility and health in the Turin longitudinal study.
Soc Sci Med 2004;58:1563-74.
30.
Marmot M, Brunner E. Cohort Profile: the Whitehall II study. Int J Epidemiol 2005;34:251-6.
31.
Brunner EJ, Kivimaki M, Witte DR, et al. Inflammation, insulin resistance, and
diabetes-Mendelian randomization using CRP haplotypes points upstream. PLoS Med 2008;5:e155.
32.
Kivimaki M, Batty GD, Singh-Manoux A, et al. Validating the Framingham Hypertension Risk
Score: results from the Whitehall II study. Hypertension 2009;54:496-501.
insulin secretion before diagnosis of type 2 diabetes: an analysis from the Whitehall II study. Lancet
2009;373:2215-21.
34.
Hemingway H, Shipley M, Mullen MJ, et al. Social and psychosocial influences on
inflammatory markers and vascular function in civil servants (the Whitehall II study). Am J Cardiol
2003;92:984-7.
35.
Expert Panel on Detection E, and Treatment of High Blood Cholesterol in Adults. Executive
summary of the third report of the national Cholesterol Education Program (NCEP) Expert Panel on
Detection, Evaluation, and Treatment of High Blood Cholesterol in Adults (Adult Treatment Panel
III). Journal of the American Medical Association 2001;285:2486-97.
36.
Chandola T, Bartley M, Sacker A, et al. Health selection in the Whitehall ll study. Social
Science & Medicine 2003;56:2059-72.
37.
Manrique-Garcia E, Sidorchuk A, Hallqvist J, et al. Socioeconomic position and incidence of
acute myocardial infarction: a meta-analysis. J Epidemiol Community Health. 2010 Sep 14. [Epub.
ahead of print].
38.
Maty SC, Everson-Rose SA, Haan MN, et al. Education, income, occupation, and the 34-year
incidence (1965-99) of Type 2 diabetes in the Alameda County Study. Int J Epidemiol
2005;34:1274-81.
39.
Tehranifar P, Liao Y, Flom JD, et al. Validity of self-reported birth weight by adult women:
sociodemographic influences and implications for life-course studies. Am J Epidemiol
2009;170:910-7.
40.
Wodskou PM, Hundrup YA, Jorgensen T. Validity of self-reported birth weight among
middle-aged and elderly women in the Danish Nurse Cohort Study. Acta Obstet Gynecol Scand 2010;
89:1134-9.
learning disability. British Journal of Psychiatry 2001;179:523-7.
42.
Reijneveld SA, Stronks K. The validity of self-reported use of health care across socioeconomic
strata: a comparison of survey and registration data. International Journal of Epidemiology
2001;30:1407-14.
43.
Bergman MM, Byers T, Freedman DS, Mokdad A. Validity of self-reported diagnosies leading
to hospitalization: a comparison of self-reports with hospital records in a prospective study of
American adults. American Journal of Epidemiology 1998;147:969-977.
44.
Bhandari A, Wagner T. Self-reported utilization of health care services: improving
measurement and accuracy. Medical Care Research and Review 2006;63:217-235.
45.
DeFrances CJ, Lucas CA, Buie VC, Golosinskiy A. 2006 National hospital discharge survey.
National Health Statistics Reports 2008;5:1-20.
46.
Case A, Paxson C. Stature and status: Height, ability and labour market outcomes. Journal of
Political Economy 2008;116:499-532.
47.
Batty GD, Shipley MJ, Gunnell D, et al. Height, wealth, and health: an overview with new data
from three longitudinal studies. Econ Hum Biol 2009;7:137-52.
48.
Case A, Paxson C. The long reach of childhood health and circumstances: Evidence from
Whitehall ll study. NBER Working Papers 2010.
49.
Aro S, Aro H, Keskimäki I. Socio-economic mobility among patients with schizophrenia or
major affective disorder. A 17-year retrospective follow-up. British Journal of Psychiatry
1995;166:759-69.
50.
Pulkki L, Kivimäki L, Elovainio M, et al. Contribution of socioeconomic status to the
association between hostility and cardiovascular risk behaviors: A prospective cohort study.
American Journal of Epidemiology 2003;158:736-42.
Epidemiol Rev 2004:52-64.
52.
Cohane GH, Pope HG. Body image in boys: a review of the literature. International Journal of
Eating Disorders 2001; 29: 373-9.
53.
Black D. Inequalities in health: Report of a working group chaired by Sir Douglas Black.
London: Department of Health and Social Security, 1980.
54.
Brunner EJ, Shipley M, Blane D, et al. When does cardiovascular risk start? Past and present
socioeconomic circumstances and risk factors in adulthood. Journal of Epidemiology and
Community Health 1999;53:757-64.
55.
Kuh D, Hardy R, Langenberg C, et al. Mortality in adults aged 26-54 years related to
socioeconomic conditions in childhood and adulthood: Post war birth cohort study. British Medical
Journal 2002;325:1076-80.
BOX. Cross-sectional Association of Whitehall II Employment Grade with Other Indicators of
Socioeconomic Status, the Whitehall II Study, 1991-2004.
Whitehall II employment grade
UG1-UG6 (high)
UG7 SEO HEO EO Clerical/support (low) Pearson r UK Registrar General social class*, n (%) I (high) 899 (63) r = 0.73, II 529 (37) 1744 (100) 1169 (100) 1397 (99) 944 (81) 5 (0) P<0.0001 IIIn 8 (1) 224 (19) 1095 (79) IIIm 1 (0) 236 (17) IV V (low) 61 (4) Years of education†, n (row%) >18 583 (75) 843 (64) 464 (42) 578 (39) 336 (28) 332 (18) r = 0.43, 17-18 113 (15) 288 (22) 344 (31) 480 (33) 334 (28) 323 (18) P<0.0001 <16 78 (10) 180 (14) 307 (28) 413 (28) 516 (43) 1168(64) Income‡, n (row%) <£15,000 2 (0) 2 (0) 11 (2) 15 (4) 220 (50) r = 0.90, £15,000 - <£20,000 1 (0) 4 (1) 2 (0) 18 (3) 204 (51) 193 (43) P<0.0001 £20,000 - <£25,000 10 (2) 8 (1) 22 (5) 357 (63) 116 (29) 25 (6) £25,000 - <£35,000 12 (2) 116 (16) 372 (85) 165 (29) 58 (14) 5 (1) £35,000 - <£50,000 178 (30) 565 (77) 37 (9) 16 (3) 8 (2) 1 (0) >=£50,000 389 (66) 36 (5) 2 (0) 3 (0) 1 (0)
Table 1. Sample Characteristics at Study Baseline and at Follow-up, the Whitehall II Study, 1991-2004. Baseline (phase 3) Follow up (phase 7)
Mean (SD) N (%) Mean (SD) N (%) Age (years) 49.6 (6.1) 8312 61.2 (6.0) 6586 Sex (%) Men 5733 (69.0) 4627 (70.3) Women 2579 (31.0) 1959 (29.7) Ethnicity (%) White 7642 (91.1) 6068 (92.3) Non-white 741 (9.0) 510 (7.8) Employment grade (%) UG1-UG6 (high) 1428 (17.2) 1655 (25.5) UG7 1744 (21.0) 1299 (20.0) SEO 1169 (14.0) 986 (15.2) HEO 1405 (16.9) 1010 (15.6) EO 1169 (14.1) 823 (12.7) Clerical/support (low) 1397 (16.8) 709 (10.9) Promotion (%) No 5291 (81.6) Yes 1194 (18.4) Waist circumference (cm) 85.8 (11.6) 7822 93.6 (12.3) 6151 BMI (kg/m2) 25.3 (3.7) 7901 26.7 (4.4) 6146 Systolic blood pressure (mmHg) 120.6 (13.6) 7905 128.2 (16.8) 6168 Diastolic blood pressure (mmHg) 79.7 (9.4) 7904 74.4 (10.5) 6167 HDL-cholesterol (mmol/l) 1.43 (0.41) 7840 1.58 (0.45) 6073 LDL-cholesterol (mmol/l) 4.39 (1.04) 7714 3.50 (1.63) 6004 Fasting glucose (mmol/l) 5.24 (0.69) 7559 5.47 (1.32) 6063 Fasting insulin (pmol/l) 6.97 (6.07) 7074 10.08 (12.24) 5479 CRP (mg/l) 1.93 (4.35) 7475 2.59 (5.09) 5895 IL-6 (pg/ml) 1.94 (2.29) 7421 2.34 (2.13) 5451 Metabolic syndrome (%) Yes 836 (10.8) 823 (13.6) No 6935 (89.2) 5250 (86.4) Status at phase 7 (%)
Employed in civil service 2010 (24.2) Left civil service 1048 (12.6)
Retired 3424 (41.2)
Non-respondent 1411 (17.0)
Died 314 (3.8)
Table 2. Test of the Health-related Selection Hypothesis (Health Predicts Social Mobility) and the Social Causation
Hypothesis (Socioeconomic Status Influences Health), the Whitehall II Study, 1991-2004.
*All models are adjusted for age and sex. Test of the association between employment grade and metabolic syndrome at follow-up was based on a subgroup with no metabolic syndrome at baseline
Exposure Outcome N Estimate* p-Value
Health-related selection (from childhood to adulthood) hypothesis
Regression coefficient (95% CI)
Hospitalization in childhood (1=yes, 0=no) Employment grade (1=low,... 6=high)
6547 -0.23 (-0.34 to -0.13) <0.0001
Birth weight, per lb Employment grade (1=low,... 6=high)
5294 0.05 (0.02 to 0.08) 0.002
Health-related selection (adulthood) hypothesis
Odds ratio (95% CI)
Waist circumference, per 1 SD increase 10-year promotion (1=yes, 0=no) 6153 1.04 (0.96 to 1.12) 0.32 BMI, per 1 SD increase 10-year promotion (1=yes, 0=no) 6219 1.03 (0.97 to 1.10) 0.38 Systolic blood pressure, per 1 SD increase 10-year promotion (1=yes, 0=no) 6229 1.01 (0.94 to 1.08) 0.75 Diastolic blood pressure, per 1 SD increase 10-year promotion (1=yes, 0=no) 6228 0.99 (0.93 to 1.06) 0.80 HDL-cholesterol, per 1 SD increase 10-year promotion (1=yes, 0=no) 6175 0.96 (0.90 to 1.04) 0.31 LDL-cholesterol, per 1 SD increase 10-year promotion (1=yes, 0=no) 6076 1.08 (1.00 to 1.15) 0.04 Fasting glucose, per 1 SD increase 10-year promotion (1=yes, 0=no) 5967 0.96 (0.89 to 1.05) 0.37 Fasting insulin, per 1 SD increase 10-year promotion (1=yes, 0=no) 5567 1.02 (0.95 to 1.10) 0.63 LogCRP, per 1 SD increase 10-year promotion (1=yes, 0=no) 5881 1.06 (0.99 to 1.14) 0.08 LogIL-6, per 1 SD increase 10-year promotion (1=yes, 0=no) 5839 0.98 (0.91 to 1.05) 0.52 Metabolic syndrome (1=yes, 0=no) 10-year promotion (1=yes, 0=no) 6127 1.18 (0.95 to 1.47) 0.13
Social causation (adulthood) hypothesis 10-year change in
Regression coefficient (95% CI)
Employment grade (1=low,... 6=high) waist circumference, mm 5868 -0.16 (-0.28 to -0.04) 0.008 Employment grade (1=low,... 6=high) BMI, kg/m2 5925 -0.06 (-0.10 to -0.03) 0.0003 Employment grade (1=low,... 6=high) systolic blood pressure, mm Hg 5953 0.02 (-0.23 to 0.28) 0.86 Employment grade (1=low,... 6=high) diastolic blood pressure, mm Hg 5951 0.26 (0.09 to 0.43) 0.003 Employment grade (1=low,... 6=high) HDL-cholesterol, mmol/L 5824 0.015 (0.010 to 0.020) <0.0001 Employment grade (1=low,... 6=high) LDL-cholesterol, mmol/L 5691 0.022 (0.006 to 0.039) 0.007 Employment grade (1=low,... 6=high) fasting glucose, mmol/L 5632 -0.05 (-0.07 to -0.03) <0.0001 Employment grade (1=low,... 6=high) fasting insulin, pmol/L 4822 -0.43 (-0.61 to -0.24) <0.0001 Employment grade (1=low,... 6=high) logCRP, mg/L 5421 -0.00 (-0.02 to 0.02) 0.90 Employment grade (1=low,... 6=high) logIL-6, pg/ml 4979 0.000 (-0.011 to 0.012) 0.93
Odds ratio (95% CI) Employment grade (1=low,... 6=high) Metabolic syndrome at follow-up
(1=yes, 0=no)
Table 3. Test of Health-related Selection and Social Causation Hypotheses After Multiple Multivariate
Imputation for Missing Values*, the Whitehall II Study, 1991-2004.
Exposure Outcome Estimate† p-Value
Health-related selection (from childhood to adulthood) hypothesis
Regression coefficient (95% CI)
Hospitalization in childhood (1=yes, 0=no) Employment grade (1=low,... 6=high)
-0.24 (-0.35 to -0.13) <0.0001
Birth weight, per lb Employment grade (1=low,... 6=high)
0.05 (0.03 to 0.07) 0.008
Health-related selection (adulthood) hypothesis
Odds ratio (95% CI)
Waist circumference, per 1 SD increase 10-year promotion (1=yes, 0=no) 1.02 (0.95 to 1.11) 0.59 BMI, per 1 SD increase 10-year promotion (1=yes, 0=no) 1.03 (0.96 to 1.11) 0.43 Systolic blood pressure, per 1 SD increase 10-year promotion (1=yes, 0=no) 0.99 (0.92 to 1.06) 0.79 Diastolic blood pressure, per 1 SD increase 10-year promotion (1=yes, 0=no) 0.97 (0.91 to 1.04) 0.43 HDL-cholesterol, per 1 SD increase 10-year promotion (1=yes, 0=no) 0.98 (0.90 to 1.07) 0.59 LDL-cholesterol, per 1 SD increase 10-year promotion (1=yes, 0=no) 1.05 (0.99 to 1.13) 0.12 Fasting glucose, per 1 SD increase 10-year promotion (1=yes, 0=no) 0.99 (0.91 to 1.06) 0.78 Fasting insulin, per 1 SD increase 10-year promotion (1=yes, 0=no) 1.00 (0.92 to 1.07) 0.94 LogCRP, per 1 SD increase 10-year promotion (1=yes, 0=no) 1.04 (0.97 to 1.13) 0.21 LogIL-6, per 1 SD increase 10-year promotion (1=yes, 0=no) 0.96 (0.90 to 1.03) 0.22 Metabolic syndrome (1=yes, 0=no) 10-year promotion (1=yes, 0=no) 1.13 (0.94 to 1.31) 0.16
Social causation (adulthood) hypothesis 10-year change in
Regression coefficient (95% CI)
Employment grade (1=low,... 6=high) waist circumference, mm -0.13 (-0.23 to -0.03) 0.009 Employment grade (1=low,... 6=high) BMI, kg/m2 -0.06 (-0.08 to -0.03) 0.0002 Employment grade (1=low,... 6=high) systolic blood pressure, mm Hg -0.10 (-0.31 to 0.12) 0.38 Employment grade (1=low,... 6=high) diastolic blood pressure, mm Hg 0.13 (-0.01 to 0.28) 0.07 Employment grade (1=low,... 6=high) HDL-cholesterol, mmol/L 0.013 (0.009 to 0.017) <0.0001 Employment grade (1=low,... 6=high) LDL-cholesterol, mmol/L 0.020 (-0.001 to 0.042) 0.06 Employment grade (1=low,... 6=high) fasting glucose, mmol/L -0.06 (-0.07 to -0.04) <0.0001 Employment grade (1=low,... 6=high) fasting insulin, pmol/L -0.40 (-0.55 to -0.24) <0.0001 Employment grade (1=low,... 6=high) logCRP, mg/L 0.00 (-0.01 to 0.02) 0.56 Employment grade (1=low,... 6=high) logIL-6, pg/ml 0.004 (-0.004 to 0.013) 0.37
Odds ratio (95% CI)
Employment grade (1=low,... 6=high) Metabolic syndrome at follow-up (1=yes, 0=no)
0.90 (0.85 to 0.94) <0.0001
*N=8312 in each of the 10 imputed copies of the dataset.
†All models are adjusted for age and sex. The association of employment grade and metabolic syndrome at baseline is additionally adjusted for metabolic syndrome at baseline.
ONLINE APPENDIX: SUPPLEMENTAL MATERIAL
Elovainio et al. Socioeconomic Differences in Cardiometabolic Factors—Social Causation or Health-related Selection? Evidence from the Prospective Whitehall II Cohort Study, 1991-2004. Am J Epidemiol 2010.
eTable1. Selection hypothesis (from childhood to adulthood): Age- and sex-adjusted association of indicators of childhood health with adult baseline employment grade, the Whitehall II study, 1991-2004
Employment grade at baseline
Childhood predictor N UG1-UG6 UG7 SEO HEO EO Clerical/
support
Regression coefficient
(95% CI)‡ Odds ratio (95% CI)
Hospitalization (>4 wks) during childhood Yes=861 No=5686 1.00 (ref) 1.09 (0.86 to 1.39) 1.33 (1.02 to 1.72) 1.36 (1.06 to 1.74) 1.45 (1.11 to 1.89) 1.65 (1.25 to 2.17) -0.23 (-0.34 to -0.13) P-value <0.0001#
Childhood data missing Yes=3018 N0=5294 1.00 (ref) 1.04 (0.89 to 1.21) 1.11 (0.93 to 1.31) 1.24 (1.05 to 1.45) 1.65 (1.39 to 1.96) 2.14 (1.80 to 2.55) -0.35 (-0.42 to -0.28) P-value <0.0001# Difference (95% CI)
Birth weight (mean difference, lbs)† 5294 0.00 (ref) -0.07 (-0.13 to -0.00) -0.04 (-0.11 to 0.04) -0.08 (-0.15 to -0.01) -0.06 (-0.14 to 0.01) -0.14 (0.22 to -0.06) 0.05 (0.02 to 0.08) P-value 0.002#
†Average birth weight is 7.65 lbs (95% CI 7.57 to 7.73) in high grade (UG1-UG6) employees (N=939). ‡Linear regression with employment grade as a continuous outcome (1=low,...6=high).
eTable2. Selection hypothesis (childhood to adulthood): Age at entry to the Civil Service and sex-adjusted association of indicators of childhood health with first employment grade
Employment grade
Childhood predictor N UG1-UG6 UG7 SEO HEO EO Clerical/
support
Regression coefficient (95%
CI)‡ Odds ratio (95% CI)
Hospitalization (>4 wks) during childhood Yes=875 No=5804 1.00 (ref) 1.21 (0.57 to 2.57) 0.91 (0.44 to 1.88) 1.14 (0.55 to 2.38) 1.10 (0.54 to 2.23) 1.48 (0.74 to 2.98) -0.13 (-0.21 to -0.05) P-value p<0.0008#
Childhood data missing Yes=4650 N0=5365 1.00 (ref) 0.87 (0.55 to 1.36) 1.10 (0.72 to 1.67) 1.29 (0.84 to 1.99) 1.20 (0.79 to 1.81) 1.88 (1.25 to 2.83) -0.22 (0.18 to 0.27) P-value p<0.0001# Difference (95% CI)
Birth weight (mean difference, lbs)† 5365 0.00 (ref) -0.04 (-0.26 to 0.18) -0.05 (-0.25 to 0.18) -0.06 (-0.27 to 0.15) -0.03 (-0.23 to 0.18) -0.10 (-0.30 to 0.10) 0.02 (0.002 to 0.04) P-value p=0.03
†Average birth weight is 7.69 lbs (95% CI 7.29 to 8.10) in high grade (UG1-UG6) employees (N=939). ‡Linear regression with employment grade as a continuous outcome (1=low,...6=high).
eTable3. Selection hypothesis (adulthood): Age- and sex-adjusted association of adult cardiometabolic factors at baseline with subsequent promotion and non-response or death over the 10-year follow-up, the Whitehall II study, 1991-2004.
Odds ratio (95% confidence interval) for Baseline risk factor (per 1 SD increase
or per category)
No. of
stable/promoted/non-responders*
promotion during 10-year follow up*
P-value† non-response/death*
Waist circumference 5015/1138/1669 1.04 (0.96 to 1.12) 0.32 1.10 (1.04 to 1.17)
BMI 5075/1144/1682 1.03 (0.97 to 1.10) 0.38 1.08 (1.02 to 1.14)
Systolic blood pressure 5078/1151/1676 1.01 (0.94 to 1.08) 0.75 1.12 (1.06 to 1.19)
Diastolic blood pressure 5077/1151/1676 0.99 (0.93 to 1.06) 0.80 1.11 (1.05 to 1.18)
HDL-cholesterol 5039/1136/1665 0.96 (0.90 to 1.04) 0.31 0.90 (0.85 to 0.96) LDL-cholesterol 4960/1116/1638 1.08 (1.00 to 1.15) 0.04 1.11 (1.05 to 1.18) Fasting glucose 4858/1109/1592 0.96 (0.89 to 1.05) 0.37 1.10 (1.04 to 1.16) Fasting insulin 4542/1025/1507 1.02 (0.95 to 1.10) 0.63 1.11 (1.05 to 1.17) LogCRP 4817/1064/1594 1.06 (0.99 to 1.14) 0.08 1.12 (1.06 to 1.19) LogIL-6 4784/1055/1582 0.98 (0.91 to 1.05) 0.52 1.18 (1.11 to 1.25)
Metabolic syndrome (yes vs no) 4997/1130/1644 1.18 (0.95 to 1.47) 0.13 1.26 (1.06 to 1.50)
*Comparison with stable or demoted (combined) employment grade. For each risk factor, the total number of participants across the categories
stable/promoted/non-response equals the number of participants at phase 3 screening (see table 1). Based on last known employment grade at the end at the 10 year follow up (including retired participants at phase 7).
eTable4. Selection hypothesis (adulthood): Age- and sex-adjusted association of adult cardiometabolic factors with subsequent promotion and drop out due to missing data, retirement or non-working at follow-up.
Odds ratio (95% confidence interval) Risk factor (per 1 SD increase) No. of
stable/promoted/missing* Promotion during follow up* Missing*
Waist circumference 1312/624/5886 0.99 (0.89 to 1.10) 1.04 (0.96 to 1.12)
BMI 1326/626/5949 1.00 (0.91 to 1.10) 1.01 (0.95 to 1.08)
Systolic blood pressure 1327/628/5950 0.92 (0.83 to 1.03) 1.03 (0.96 to 1.11)
Diastolic blood pressure 1327/628/5950 0.96 (0.87 to 1.07) 1.11 (1.04 to 1.19)
HDL-cholesterol 1317/622/5901 0.98 (0.88 to 1.09) 1.01 (0.94 to 1.09) LDL-cholesterol 1293/610/5810 1.12 (1.01 to 1.24) 1.07 (1.00 to 1.15) Fasting glucose 1276/606/5677 0.93 (0.81 to 1.05) 1.04 (0.96 to 1.12) Fasting insulin 1188/559/5327 1.06 (0.94 to 1.18) 1.08 (0.99 to 1.17) LogCRP 1257/583/5635 1.12 (1.01 to 1.23) 1.06 (0.99 to 1.14) LogIL-6 1248/577/5596 0.99 (0.90 to 1.10) 1.09 (1.02 to 1.17)
Metabolic syndrome (yes vs no) 1308/618/5845 1.12 (0.80 to 1.58) 1.08 (0.85 to 1.36)
*Comparison with stable or demoted (combined) employment grade. Missing refers to missing data at follow-up or not working due to retirement or other reasons at follow-up. For each risk factor, total number in categories of stable/promoted/missing equals to the number of participants in Phase 3 screening (in Table 1). None of the association with promotion were statistically significant after corrections for multiple testing.
Statistical analysis for 5-year change in employment grade and change in cardiometabolic factors
For the analyses of the prospective data, which are structured such that 5-yearly measurements (observations) are nested within individuals, we used multilevel linear and logistic regression analysis to model the association of cardiometabolic factors with subsequent change in employment grade across phases, that is cardiometabolic factors at phase 3 predicting
promotion between phases 3 and 5 and those at phase 5 predicting promotion between phases 5 and 7 (eTable7). The levels of cardiometabolic factors were allowed to change within subjects over time, i.e., these variables were modelled as time variant, and the analysis used all available measurements from every subject at all phases. Repeated measurements within individuals constitute a cluster and the calculation of standard errors takes into account the
non-independence of the measurements; that is, the same individual contributes more than one observation in the dataset and these observations are of course related. We used a similar approach to examine the association of employment grade with subsequent change in cardiometabolic factors (ie grade at phase 3 predicting change in cardiometabolic factors between phases 3 and 5, and grade at phase 5 predicting changes in these factors between phases 5 and 7 (eTable8). We used Stata 11.0 statistical software for Windows, procedures 'xtmixed' and 'xtlogit' for these analyses.
eTable5. Health-related selection hypothesis (adulthood): Age- and sex-adjusted association of adult cardiometabolic factors at baseline with promotion over 5 years. Random-intercept multilevel analysis across 3 study phases, the Whitehall II study, 1991-2004
Baseline factor (per 1 SD increase or per category)
No. of participants/ no. of observations
Odds ratio (95% confidence interval) for promotion over 5 years*
P-value
Waist circumference 5757/7429 1.11 (1.04 to 1.19) 0.003†
BMI 5829/7682 1.06 (0.99 to 1.12) 0.07
Systolic blood pressure 5852/8000 0.92 (0.87 to 0.98) 0.01
Diastolic blood pressure 5851/7999 0.87 (0.82 to 0.93) <0.0001†
HDL-cholesterol 5787/7620 1.07 (1.00 to 1.15) 0.06
LDL-cholesterol 5707/7496 0.86 (0.81 to 0.92) <0.0001†
Fasting glucose 5671/7718 0.98 (0.93 to 1.04) 0.54
Fasting insulin 5436/7350 1.04 (1.01 to 1.08) 0.03
Metabolic syndrome (yes vs no) 5768/7758 0.86 (0.69 to 1.07) 0.17
*Comparison with stable or demoted (combined). The highest grade at baseline is excluded to reduce ceiling effect. †Statistically significant after Bonferroni correction for multiple testing.
eTable6. Causation hypothesis (adulthood): Age- and sex-adjusted association of baseline employment grade with medication use, new-onset metabolic syndrome and missingness at follow-up, the Whitehall II study, 1991-2004.
Outcome at follow-up Employment grade at baseline Use of lipid lowering
drugs† antihypertensive Use of drugs† New onset metabolic syndrome (yes v no)‡ Non-response/death at follow-up (yes v no) Total cohort (N=7316) N=7316 N=5208 N= 8312
1 (High) 1.00 (ref) 1.00 (ref.) 1.00 (ref.) 1.00 (ref.)
2 0.86 (0.57 to 1.29) 1.06 (0.84 to 1.34) 1.36 (0.98 to 1.90) 1.18 (1.02 to 1.36)
3 0.61 (0.36 to 1.02) 1.10 (0.85 to 1.43) 1.53 (1.07 to 2.18) 1.16 (0.98 to 1.36)
4 1.21 (0.80 to 1.82) 1.58 (1.25 to 2.00) 1.56 (1.10 to 2.21 1.41 (1.21 to 1.65)
5 1.26 (0.81 to 1.96) 1.57 (1.22 to 2.02) 1.84 (1.28 to 2.65) 1.60 (1.35 to 1.88)
6 (Low) 1.50 (0.95 to 2.35) 1.88 (1.46 to 2.43) 2.08 (1.43 to 3.03) 2.28 (1.93 to 2.70)
P-value for trend 0.02 <0.0001* <0.0001* <0.0001*
Subcohort with poor childhood health# N=1188 N=1188 N=821 N=1232
1 (High) 1.00 (ref.) 1.00 (ref.) 1.00 (ref.) 1.00
2 1.11 (0.28 to 4.23) 2.23 (1.17 to 4.24) 0.98 (0.40 to 2.42) 1.04 (0.69 to 1.57)
3 1.26 (0.31 to 5.16) 1.96 (0.98 to 3.91) 0.89 (0.32 to 2.34) 0.99 (0.63 to 1.55)
4 2.79 (0.82 to 9.46) 2.93 (1.53 to 5.61) 1.53 (0.63 to 3.70) 1.07 (0.70 to 1.65)
5 3.25 (0.93 to 11.42) 1.92 (0.95 to 3.89) 1.37 (0.53 to 3.49) 1.21 (0.77 to 1.90)
6 (Low) 4.21 (1.23 to 14.38) 2.15 (1.09 to 4.26) 1.19 (0.45 to 3.14) 1.50 (0.97 to 2.33)
p-value for trend 0.002* 0.11 0.40 0.05
Subcohort with good childhood health N=5739 N=5739 N=4150 N=6152
1 (High) 1.00 (ref.) 1.00 (ref.) 1.00 (ref.) 1.00 (ref.)
2 0.85 (0.54 to 1.33) 0.92 (0.71 to 1.20) 1.42 (0.99 to 2.06) 1.19 (1.01 to 1.41)
3 0.63 (0.35 to 1.11) 1.03 (0.76 to 1.38) 1.66 (1.13 to 2.46) 1.10 (0.91 to 1.33)
4 1.13 (0.71 to 1.80) 1.43 (1.09 to 1.87) 1.48 (1.00 to 2.18) 1.38 (1.16 to 1.65)
5 1.24 (0.76 to 2.04) 1.59 (1.20 to 2.10) 1.79 (1.19 to 2.70) 1.45 (1.21 to 1.78)
6 (Low) 1.25 (0.73 to 2.14) 1.96 (1.46 to 2.62) 2.27 (1.49 to 3.47) 1.95 (1.60 to 2.38)
p-value for trend 0.17 <0.0001* 0.0003* <0.0001*
*Statistically significant after Bonferroni correction for multiple testing. †Self-reported at phase 7. ‡Among those free of metabolic syndrome at baseline. #Low birthweight (<2.5kg) and/or hospitalization in childhood.
eTable7. Causation hypothesis (adulthood): Age- and sex-adjusted association of baseline employment grade with subsequent change in cardiometabolic factors over the 10-year follow up, the Whitehall II study, 1991-2004.
Outcome (10-year change) Employment grade at baseline Waist circumference (cm) BMI (kg/m2) Systolic blood pressure (mmHg) Diastolic blood pressure (mmHg) HDL-cholesterol (mmol/l) LDL-cholesterol (mmol/l) Fasting glucose (mmol/l) Fasting insulin (pmol/l) LogCRP (mg/l) LogIL-6 (pg/ml) Total cohort N=5868 N=5925 N=5953 N=5951 N=5824 N=5691 N=5632 N=4822 N=5421 N=4979 1 (High) 8.24 1.38 8.2 -4.0 0.18 -0.75 0.08 2.31 0.44 0.19 2 8.30 1.42 9.0 -3,9 0.15 -0.74 0.10 2.83 0.41 0.21 3 8.68 1.53 8.7 -4.0 0.15 -0.76 0.19 2.89 0.41 0.17 4 8.50 1.46 8.2 -4.7 0.16 -0.78 0.23 2.97 0.43 0.20 5 8.98 1.65 8.4 -5.3 0.11 -0.83 0.25 3.68 0.42 0.17 6 (Low) 9.04 1.73 8.5 -4.9 0.09 -0.86 0.35 5.11 0.45 0.21
P-value for trend 0.008 0.0003* 0.86 0.003* <0.0001* 0.007 <0.0001* <0.0001* 0.90 0.93
Subcohort with poor childhood health † N=945 N=948 N=955 N=954 N=937 N=907 N=910 N=780 N=869 N=805 1 (High) 9.41 1.62 9.0 -3.4 0.20 -0.79 0.09 2.23 0.33 0.24 2 8.54 1.53 9.1 -4.4 0.18 -0.74 0.08 2.50 0.40 0.21 3 8.95 1.57 7.2 -4.2 0.17 -0.71 0.17 2.35 0.45 0.12 4 8.94 1.51 8.4 -5.1 0.19 -0.90 0.27 2.42 0.30 0.17 5 9.01 1.70 8.4 -4.9 0.17 -0.92 0.14 2.34 0.49 0.19 6 (Low) 8.73 1.50 6.7 -4.3 0.08 -0.97 0.43 4.65 0.50 0.23
p-value for trend 0.78 0.94 0.27 0.35 0.005 0.03 0.01 0.02 0.30 0.72
Subcohort with good childhood health N=4647 N=4698 N=4718 N=4717 N=4618 N=4522 N=4466 N=3824 N=4300 N=3956 1 (High) 8.13 1.35 8.2 -4.1 0.18 -0.73 0.09 2.47 0.47 0.18 2 8.27 1.39 8.8 -3.9 0.15 -0.74 0.10 2.92 0.43 0.21 3 8.61 1.51 9.1 -4.0 0.15 -0.77 0.20 3.01 0.40 0.17 4 8.45 1.46 8.3 -4.5 0.15 -0.75 0.19 2.75 0.46 0.20 5 9.05 1.62 8.3 -5.5 0.10 -0,80 0.25 3.15 0.43 0.17 6 (Low) 9.17 1.82 8.6 -5.0 0.09 -0.83 0.32 5.55 0.45 0.22
p-value for trend 0.003* <0.0001* 0.95 0.008 <0.0001* 0.06 <0.0001* 0.0003* 0.81 0.85
*Statistically significant after Bonferroni correction for multiple testing. † Among those free of metabolic syndrome at baseline. #Low birthweight (<2.5kg) and/or hospitalization in childhood.
eTable8. Causation hypothesis (adulthood): Age- and sex-adjusted association of baseline employment grade with change in
cardiometabolic factors over 5 years. Random-intercept multilevel analysis across 3 study phases, the Whitehall II study, 1991-2004.
Outcome* (5-year change) Employment grade at baseline Waist circumference (cm) BMI (kg/m2) Systolic blood pressure (mmHg) Diastolic blood pressure (mmHg) HDL-cholesterol (mmol/l) LDL-cholesterol (mmol/l) Fasting glucose (mmol/l) Fasting insulin (pmol/l) New onset metabolic syndrome (yes/no)†
Total cohort: Number of observations /participants
6768/4716 7700/5420 8859/6229 8858/6228 7698/5455 7512/5344 8530/6025 7962/5747 7457/5325 1 (High) 0.00 (ref) 0.00 (ref) 0.00 (ref) 0.00 (ref) 0.00 (ref) 0.00 (ref) 0.00 (ref) 0.00 (ref) 1.00 (ref) 2 -0.04 0.06 0.66 0.36 -0.00 0.04 0.01 0.66 0.90 3 0.01 0.06 0.12 0.23 -0.01 0.04 0.04 0.41 1.41 4 -0.03 0.02 -0.12 -0.34 -0.02 0.02 0.08 0.39 1.23 5 0.07 0.07 0.06 -0.47 -0.02 -0.04 0.10 0.35 1.13 6 (Low) -0.06 0.07 -0.37 -0.37 -0.03 -0.05 0.17 1.74 2.61 P-value for trend 0.99 0.40 0.23 0.03 0.001‡ 0.04 <0.0001‡ 0.012 <0.0001‡
*Mean difference (95% confidence interval) compared to the highest employment grade (odds ratio for new-onset metabolic syndrome). †Among those free of metabolic syndrome at baseline.