HAL Id: hal-01759208
https://hal.uca.fr/hal-01759208
Submitted on 26 May 2020
HAL is a multi-disciplinary open access
archive for the deposit and dissemination of
sci-entific research documents, whether they are
pub-lished or not. The documents may come from
teaching and research institutions in France or
abroad, or from public or private research centers.
L’archive ouverte pluridisciplinaire HAL, est
destinée au dépôt et à la diffusion de documents
scientifiques de niveau recherche, publiés ou non,
émanant des établissements d’enseignement et de
recherche français ou étrangers, des laboratoires
publics ou privés.
Distributed under a Creative Commons Attribution| 4.0 International License
histone crotonylation in the colon through histone
deacetylases
Rachel Fellows, Jérémy Denizot, Claudia Stellato, Alessandro Cuomo, Payal
Jain, Elena Stoyanova, Szabina Balázsi, Zoltán Hajnády, Anke Liebert, Juri
Kazakevych, et al.
To cite this version:
Rachel Fellows, Jérémy Denizot, Claudia Stellato, Alessandro Cuomo, Payal Jain, et al.. Microbiota
derived short chain fatty acids promote histone crotonylation in the colon through histone deacetylases.
Nature Communications, Nature Publishing Group, 2018, 9 (1), pp.1-15.
�10.1038/s41467-017-02651-5�. �hal-01759208�
Microbiota derived short chain fatty acids promote
histone crotonylation in the colon through histone
deacetylases
Rachel Fellows
1
, Jérémy Denizot
1,9
, Claudia Stellato
1
, Alessandro Cuomo
2
, Payal Jain
1
, Elena Stoyanova
1
,
Szabina Balázsi
1
, Zoltán Hajnády
1
, Anke Liebert
1
, Juri Kazakevych
1
, Hector Blackburn
1
,
Renan Oliveira Corrêa
3
, José Luís Fachi
3
, Fabio Takeo Sato
3
, Willian R. Ribeiro
4,5
,
Caroline Marcantonio Ferreira
4
, Hélène Perée
1
, Mariangela Spagnuolo
1
, Raphaël Mattiuz
1
, Csaba Matolcsi
1
,
Joana Guedes
6
, Jonathan Clark
7
, Marc Veldhoen
6,10
, Tiziana Bonaldi
2
, Marco Aurélio Ramirez Vinolo
3
&
Patrick Varga-Weisz
1,8
The recently discovered histone post-translational modi
fication crotonylation connects
cel-lular metabolism to gene regulation. Its regulation and tissue-speci
fic functions are poorly
understood. We characterize histone crotonylation in intestinal epithelia and
find that histone
H3 crotonylation at lysine 18 is a surprisingly abundant modi
fication in the small intestine
crypt and colon, and is linked to gene regulation. We show that this modi
fication is highly
dynamic and regulated during the cell cycle. We identify class I histone deacetylases, HDAC1,
HDAC2, and HDAC3, as major executors of histone decrotonylation. We show that known
HDAC inhibitors, including the gut microbiota-derived butyrate, affect histone
decrotonyla-tion. Consistent with this, we
find that depletion of the gut microbiota leads to a global
change in histone crotonylation in the colon. Our results suggest that histone crotonylation
connects chromatin to the gut microbiota, at least in part, via short-chain fatty acids and
HDACs.
DOI: 10.1038/s41467-017-02651-5
OPEN
1Nuclear Dynamics, Babraham Institute, Cambridge, CB22 3AT, UK.2Department of Experimental Oncology, Istituto Europeo di Oncologia, 20139 Milano,
Italy.3Laboratory of Immunoinflammation, Institute of Biology, UNICAMP, Campinas 13083-862, Brazil.4Department of Pharmaceutical Sciences, Institute of Environmental, Chemistry and Pharmaceutical Sciences, Universidade Federal de São Paulo, Diadema, SP 09913-03, Brazil.5Chemical Biology Graduate Program, Universidade Federal de São Paulo, Diadema SP 09913-03, Brazil.6Lymphocyte Signalling and Development, Babraham Institute, Cambridge, CB22 3AT, UK.7Biological Chemistry, Babraham Institute, Cambridge CB22 3AT, UK.8School of Biological Sciences, University of Essex, Colchester CO4 3SQ, UK.
9Present address: Université Clermont Auvergne, Inserm U1071, INRA USC2018, M2iSH, Clermont
–Ferrand F-63000, France.10Present address: Instituto de
Medicina Molecular, Faculdade de Medicina da Universidade de Lisboa, Lisbon 1649-028, Portugal. Jérémy Denizot, Claudia Stellato, Alessandro Cuomo, Payal Jain and Elena Stoyanova contributed equally to this work. Correspondence and requests for materials should be addressed to
T.B. (email:tiziana.bonaldi@ieo.it) or to M.R.A.V. (email:mvinolo@unicamp.br) or to P.V.-W. (email:patrick.varga-weisz@babraham.ac.uk)
123456789
H
istone post-translational modifications (HPTMs) are
fundamental regulators of gene expression and are tightly
controlled by enzymes that respond to the availability of
metabolic precursors
1. Histone acetylation is a well-studied
HPTM usually linked to active genes and is added to various
lysine groups of histones by histone acetyltransferases (HATs)
and removed by histone deacetylases (HDACs). More recently,
various longer chain acylations of histones have been
character-ized, including crotonylation
2, butyrylation
3, 4, and
hydro-xybutyrylation
5. These acylations have been linked to cellular
metabolism, because they reflect the availability of the short-chain
fatty acids (SCFAs) and their coenzyme A adducts in the cell
5,6(reviewed in refs.
7,8). This has been demonstrated by
introdu-cing crotonate (2-butenoate), an SCFA moiety produced
intracellularly as an intermediate of metabolic processes
2,6,9,10,
to the cell culture media which affects histone crotonylation
levels. Histone crotonylation reprograms the functionality of
nucleosomes, setting it apart from histone acetylation, by favoring
interactions with a specific set of chromatin modifiers
9–12.
A link between cellular metabolism, SCFAs, and transcriptional
regulation is particularly relevant in the intestine where
micro-organisms break down complex carbohydrates to SCFAs such as
acetate, propionate, and butyrate
13,14. SCFAs are an important
component of normal gut physiology by providing a major
energy source for the colon epithelial cells
15. They also affect
cellular functions and modulate immune responses, in part by
affecting gene expression and the epigenome through inhibiting
HDACs
14,16. Here, we explore histone crotonylation in intestinal
H3 (18–26) KQLATKAAR
d
c
Villus
Crypt
Crotonylation DAPI Crotonylation DAPI
Colon Small intestine 0% 2% 4% Anti-Kcr Anti-H3K18cr Anti-H3K18ac Anti-H3 H3 H4 95 kDa 10 kDa 28 kDa 28 kDa 36 kDa 10% 20% 30% 40% 50% 60% 70% 80% 90% 0% Small intestine Crypt Colon
unmod K18me1 K18ac
K18cr/K23acK18ac/K23ac
Brain Colon Liver Spleen Kidney
a
b
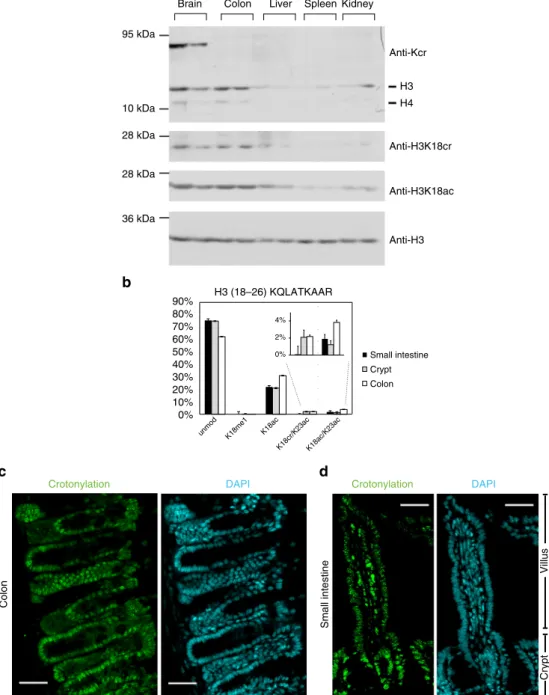
Fig. 1 Histone crotonylation is found in the intestine. a Western blot analysis of whole cell extracts from several mouse tissues using indicated antibodies shows that histone crotonylation is particularly abundant in the brain and colon; the analysis of tissues from two mice is shown.b Relative abundance of H3K18cr in the intestinal epithelium cell fractions,n = 3, error bars are standard deviation. c, d Immunofluorescence microscopy with anti-pan crotonyl antibody (green, left panels) and DAPI counterstaining (cyan, right panels) of a mouse colon (c) and small intestinal (d) tissue sections, scale bars 40μm
epithelial cells and show that histone H3 lysine 18 crotonylation
(H3K18cr) is readily detectable in this tissue and that histone
crotonylation is regulated by class I HDACs. Our
findings suggest
that histone crotonylation connects chromatin structure to the
gut microbiota via HDACs and SCFAs.
Results
Histone crotonylation abundance in the intestine. Western blot
analysis of the level of histone crotonylation in several tissues
(colon, brain, liver, spleen, kidney) using the antibodies against
crotonyl-lysine and H3K18cr indicates that the greatest levels of
histone crotonylation are in colon and, interestingly, brain among
the tissues analyzed (Fig.
1
a). An approximately 70 kDa protein in
the brain extract is recognized by the antibody against
crotonyl-lysine, indicating the presence of a crotonylated non-histone
protein in the brain.
To characterize the pattern of histone H3 PTMs in intestinal
cells, we analyzed small intestine epithelium, colon epithelium,
and small intestine crypt-enriched fractions by LC-MS/MS
(Supplementary Fig.
1
, LC-MS: liquid chromatography-mass
spectrometry). This analysis allowed the site-specific
identifica-tion of 38 differentially modified peptides (Supplementary
Table
1
). Among them, we identified lysine methylation and
acetylation combinations at several H3 peptides and increased
levels of monomethylated H3K4 in both small intestinal crypt
and colon fraction compared to the fraction from whole small
intestine epithelium. Di- and tri-methylated H3K4 were below the
detection limit, likely due to their low abundance (Supplementary
Fig.
1
and Supplementary Table
1
). Most interestingly, we
identified histone lysine crotonylation at several histone H3
residues: K9, K14, K18, K27, and K56 (Table
1
, Supplementary
Fig.
2
, and Supplementary Table
1
). H3K18 crotonylation
(H3K18cr), in association with H3K23 acetylation, was the most
abundant histone H3 crotonylation mark in crypt and colon
fractions (Fig.
1
b, Supplementary Table
1
), possibly suggesting
that these two marks are co-regulated. H3 crotonylation
abundance is overall rather low at K9, K27, and K56.
Representative MS/MS spectra for all crotonylated peptides are
displayed in Supplementary Fig.
2
.
As immunostaining with anti-H3K18cr antibody did not work
in our hands, we performed immunostaining of murine small
intestine and colon using antibodies targeting crotonyl-lysine
(anti-Kcr) and histone H4 crotonylated at K8 (anti-H4K8cr). This
demonstrated the presence of these modifications in the nuclei of
intestinal epithelium cells, especially in the proliferative crypt
compartments (Fig.
1
c, d, Supplementary Fig.
3
and
4
). Western
blot analysis of in vitro crotonylated or acetylated histones and of
whole colon extracts confirmed specificity of the Kcr,
anti-H3K18cr, and anti-H3K18ac antibodies (Supplementary Fig.
5
a, b).
Genome-wide localization of H3K18cr in the colon epithelium.
As we found that histone H3K18cr is the most abundant histone
crotonylation mark in the intestine, we characterized it further by
chromatin immunoprecipitation-sequencing (ChIP-seq). This
analysis showed that H3K18cr is associated with transcription
start sites (TSS) (Figs.
2
a–d), similar to H3K4me3 (Fig.
2
c), as has
been shown before in macrophages
6. To investigate the link
between H3K18cr and transcription, we performed
RNA-sequencing (RNA-seq) on colon epithelial crypts and found
higher gene expression levels associated with increased H3K18cr
enrichment over TSS (Fig.
2
e). KEGG pathway analysis of genes
with high levels of H3K18cr over their TSS highlights various
pathways, in particular several involved in cancer, suggesting that
deregulation of histone crotonylation may be linked to cancer
(Fig.
2
f, Supplementary Fig.
6
).
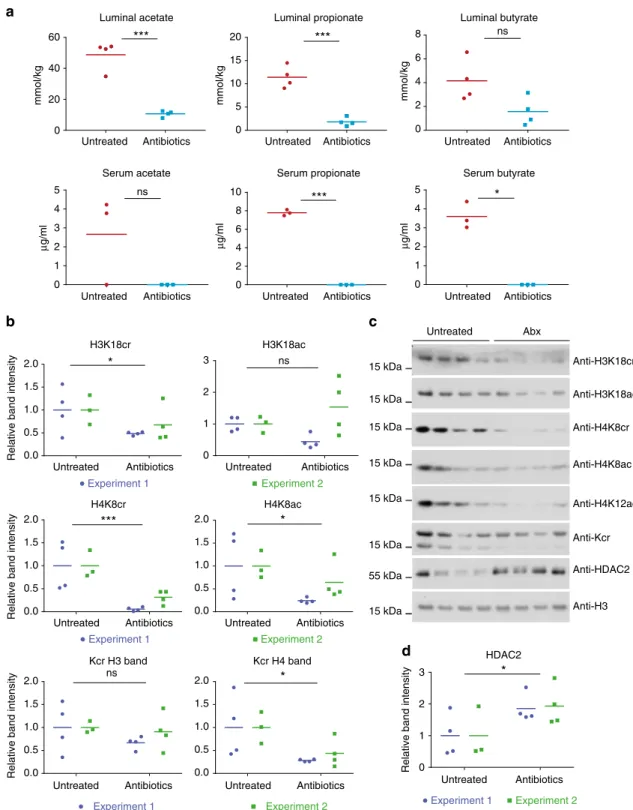
Microbiota and histone crotonylation in the mouse colon. As
histone crotonylation has been linked to cellular metabolism and
we found it to be relatively abundant in the gut, we hypothesized
that this modification may be linked to the SCFAs that are
gen-erated by intestinal microbiota, especially in the colon. Treatment
of mice for 3 days with a cocktail of antibiotics led to a reduction
of the bacterial load (Suppl. Figure
7a
) and a reduction of SCFAs
in colon luminal content and serum (Fig.
3
a). This was linked to a
noticeable global decrease of histone crotonylation in the colon
tissue, which was particularly clear with histone H4K8
crotony-lation but also for H3K18 and H4 crotonycrotony-lation (as detected by
the anti-Kcr antibody) (Figs.
3
b, c). Interestingly, we found that
the treatment with antibiotics was also linked to increased
amounts of HDAC2 (Figs.
3
d, c; changes in HDAC1 and HDAC3
levels were not consistent, Supplementary Fig.
7
b).
SCFAs promote histone crotonylation. Next we investigated if
the drop in SCFA concentration in the colon lumen and serum
could account for the observed global reduction in histone
cro-tonylation. When added to the media of human colon carcinoma
cells (HCT116) and mouse small intestinal organoids, the SCFA
crotonate promoted H3 and H4 crotonylation, thereby
confirm-ing previous
findings
6(Fig.
4
a, Supplementary Fig.
8
a). We found
that histone crotonylation is highly dynamic, being increased
within 2 h of crotonate addition to the medium and lost within 1
h of wash out (Supplementary Fig.
8
b). The chemically related
SCFA butyrate, which is naturally present in the intestine, also
promoted histone crotonylation at physiologically relevant
con-centrations, both in gut organoids and HCT116 cells (Fig.
4
a,
Supplementary Fig.
8
c). Therefore, these in vitro observations are
consistent with the idea that depletion of the microbiota leads to a
decrease in histone crotonylation of the colon epithelium because
of the drop in SCFAs.
HDAC inhibitors upregulate histone crotonylation. Since
butyrate is a well-known HDAC inhibitor
17, we hypothesized that
HDACs might regulate histone crotonylation and their inhibition
explains the increase in histone crotonylation upon butyrate
Table 1 List of K-crotonyl histone-modi
fied peptides
Modified sequences Modified sites Gene names Charge m/z RT Score
K(cr)STGGK(*)APR K9 HIST2H3 2+ 507.7921 71.3 60.3 K(*)STGGK(cr)APR K14 HIST2H3 3+ 338.8639 72.9 33.4 K(cr)QLATKAAR K18 HIST2H3 2+ 550.3367 90.8 93.1 K(cr)QLATK(ac)AAR K18 HIST2H3 2+ 548.8273 91.0 89.1 K(cr)SAPATGGVKKPHR K27 HIST2H3 3+ 531.3110 85.4 39.7 YQK(cr)STELLIR K56 HIST2H3 2+ 659.8710 129.0 47.3
Summary of identified crotonylation sites on histone H3 from the crypt fraction of the small intestine using MS/MS analysis SI small intestine, cr crotonylation, ac acetylation, (*) chemical alkylation
treatment. We found that other HDAC inhibitors are also able to
promote histone crotonylation in HCT116 cells, including
tri-chostatin A (TSA), the clinically relevant suberanilohydroxamic
acid (SAHA), and valproic acid (VPA, Supplementary Fig.
9
).
MS275 (entinostat), a selective inhibitor of class I HDACs, which
has been tested in various clinical trials
18, significantly promoted
histone crotonylation at sub-micromolar concentrations in
HCT116 cells (Fig.
4
b). This outcome cannot be explained by
cross-reactivity of the anti-crotonyl antibodies to acetylated
his-tones
6(Supplementary Fig.
5
). A ChIP-qPCR for H3K18cr
observed a significant increase in enrichment upon MS275
treatment in different genomic loci including repetitive regions,
suggesting that class I HDAC inhibition leads to a spread of
histone crotonylation into intergenic areas (Fig.
4
c).
f 0.6 0.7 0.8 0.9 1 1.1 Inputs H3K18cr H3K4me3 Pathways in cancer Adherens junction Prostate cancer Colorectal cancer Endometrial cancer
Sign. pathways regulating pluripotency of stem cells Hippo signaling pathway
cGMP-PKG signaling pathway
Proteoglycans in cancer
TGF-beta signaling pathway
Pancreatic cancer Chronic myeloid leukemia
KEGG pathway term
2 4 6 8 10 12
–log10 (adjusted p -value)
H3K18cr ChIP Input Bases 1 – 5000 TSS Bases 1 – 5000 105,400,000 105,600,000 105,800,000 106,000,000 106,200,000 106,400,000 106,600,000 106,800,000 Inputs H3K18cr ChIP mRNA Mus musculus GRCm38 chr1:105253688–106916131 (1.6 Mbp) –100 –10 –100 –10
Relative enrichment across probe 0.6
0.8 1 1.2 1.4 –500 bp TSS +500 bp Inputs H3K18cr ChIP
Read counts over TSS (+/– 0.5 kbp) log2 0
1 2 3 4 5 6 7 8 0 1 2 3 4 5 6 7 8 H3K18cr ChIP Inputs
Gene expression % bins Gene expression % bins
Relative enrichment of reads
Relative distance across genes
0–25 25–50 50–75 75–100 90–100 99–100 0–25 25–50 50–75 75–100 90–100 99–100
a
b
c
d
e
To investigate how HDAC inhibitors change the distribution of
histone crotonylation over the genome, we performed ChIP-seq
analysis of H3K18cr and H3K18ac. This showed a relative
decrease of read counts over TSS when HCT116 cells were treated
with MS275 (Fig.
5
a, b). This could be explained with an overall
increase of these marks over the genome outside of the TSS
regions. ChIP-seq measures the relative proportional distribution
of a mark over the genome. If the proportional increase of
H3K18cr over TSS is lower than the one outside of TSS, an
increase of histone crotonylation over regions outside of TSS
(which cover a much greater proportion of the genome than all
TSS combined) will lead to an apparent proportional drop of this
mark in TSS regions.
Interestingly, H3K18cr and H3K18ac peaks correlate highly
and occur at the same sites genome-wide in HCT116 cells, with or
without MS275 treatment (Figs.
5
c–e). MS275 treatment of
HCT116 cells caused changes in gene expression, which are
linked to changes in H3K18 acetylation and crotonylation (Fig.
5
f,
g). Thus, gene silencing and chromosome segregation defects
occurring upon HDAC inhibitor treatments
19may not only be
due to aberrant histone acetylation, but could also be linked to
histone crotonylation.
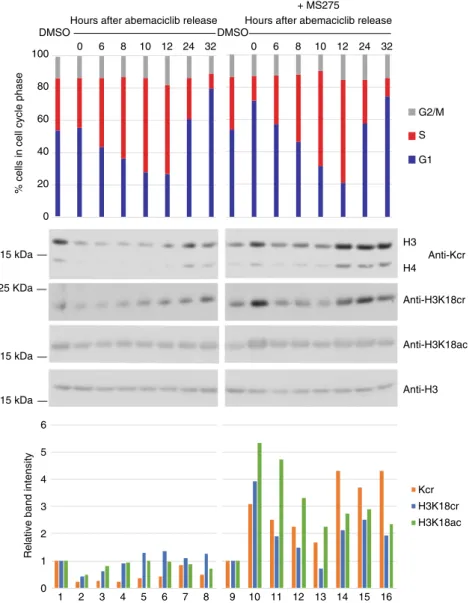
Histone crotonylation is linked to the cell cycle. We performed
cell cycle arrest and release experiments in presence or absence of
the class I HDAC specific inhibitor MS275. The results indicated
that histone crotonylation, including H3K18cr, is linked to cell
cycle progression, showing an increase in S and G2-M phase over
G1 arrested cells (Fig.
6
, lanes 1–8). This experiment also suggests
that class I HDACs may be involved in this cell cycle-mediated
modulation of histone crotonylation levels, as the
G1-arrest-linked downregulation of histone crotonylation is inhibited in the
presence of MS275 compared to untreated cells (Fig.
6
, lanes 1, 2,
9, 10). In addition, in MS275-treated cells, histone crotonylation
was modulated during the cell cycle, but levels remained generally
higher compared to untreated cells (Fig.
6
, lanes 9–16).
Class I HDACs are histone decrotonylases. To test further if we
could link class I HDACs to decrotonylation, we transiently
over-expressed a fusion protein of HDAC1 with green
fluorescent
protein (GFP), an N-terminal deletion mutant version of this or
GFP in HCT116 cells, sorted the transfected cells, and monitored
histone crotonylation by western blot analysis. This showed that
the over-expression of HDAC1 but not its mutant version with an
N-terminal truncation (or GFP alone) caused some reduction of
global histone H3K18 and H4K8 crotonylation (Supplementary
Fig.
10
).
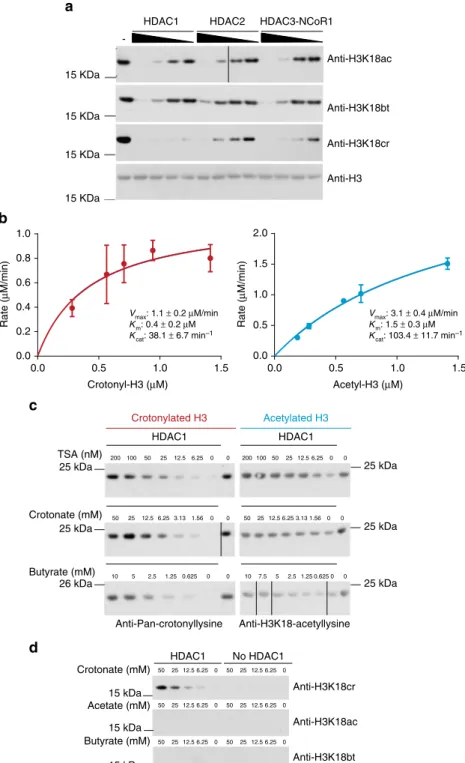
To validate the ability of HDACs to decrotonylate histones, we
tested this activity with recombinant, purified HDACs in in vitro
experiments and found that the class I HDAC enzymes HDAC1,
HDAC2, and the HDAC3/Ncor1 complex efficiently removed the
crotonyl moiety of in vitro crotonylated histones (Fig.
7
a). Using
this in vitro approach, we estimated enzyme kinetic values for the
decrotonylation of H3K18cr and deacetylation of H3K18ac and
found that HDAC1 has a similar capacity to perform each
reaction. HDAC1 has lower V
maxand K
catvalues for the
decrotonylation compared to the deacetylation reactions
indicat-ing that HDAC1 has a higher maximum turnover with the acetyl
substrate than the crotonyl substrate (Fig.
7
b, Supplementary
Fig.
11
). We found that the K
mwith acetylated histones of 1.47
µM was similar to a published K
mof HDAC with a BOC-lys
(acetyl)-AMC of 3.7
µM
20. Published K
mvalues with different
fluorescent or tritiated acetyl substrates vary from 0.68 to 78
µM
21–24. Relative to this, the K
m
of the crotonyl substrate was
lower at 0.42
µM suggesting that HDAC1 can efficiently bind
crotonylated histones at low concentrations of substrate. This
may be relevant in the context of the cell where HDAC1 could
respond to minor
fluctuations in the availability of the crotonyl
substrate.
In vitro, HDAC inhibitors TSA and butyrate reduced
decrotonylation by HDAC1 significantly, demonstrating that
the HDAC inhibitors, including SCFAs, affect decrotonylation by
HDACs directly (Fig.
7
c). TSA inhibited deacetylation at lower
doses (IC50 ~5 nM) than decrotonylation (IC50 ~50 nM)
high-lighting the differential impact of inhibitors on HDAC activity
and potential for specific drug development. We also found that
crotonate inhibited decrotonylation and deacetylation in vitro
(Fig.
7
c). Remarkably, at crotonate concentrations of 6 mM or
higher, HDAC1 catalyzed the addition of the crotonyl moiety to
lysine groups of histones (Fig.
7
d). This did not occur with acetate
or butyrate, possibly due to their lower chemical reactivity
compared to crotonate. While this
finding may not be directly
biologically relevant, as it is unlikely that such high
concentra-tions of crotonate are found intracellularly, it highlights the
reversible nature of the decrotonylation reaction by HDAC1.
A previous study dismissed HDACs 1–11 as decrotonylases
based on an in vitro
fluorometric assay using a peptide analog
2.
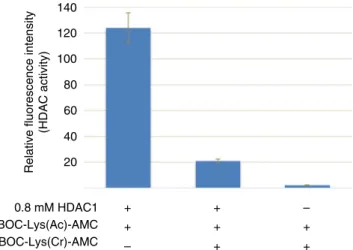
We also did not
find decrotonylase activity for HDAC1 using the
same assay, but found that the BOC-Lys(crotonyl)-AMC
compound used is inhibitory for the deacetylation step of the
BOC-Lys(acetyl)-AMC. This suggests that the HDACs interact
with BOC-Lys(crotonyl)-AMC, but potentially cannot release the
compound (Fig.
8
). Future studies will examine to what extent
HDACs require the peptide context of histone H3 for efficient
decrotonylation activity.
Discussion
A key
finding of our study is that histone crotonylation is
sur-prisingly abundant in the intestinal epithelium, especially the
crypt fraction of the small intestine and the colon. This supports
the notion that histone crotonylation does not simply reflect
‘metabolic noise’, as in the ability of p300 to use crotonyl-CoA to
modify histones, but has specific functions, which might vary
between tissues. We also
find high levels of histone crotonylation
Fig. 2 H3K18cr ChIP-seq from colon epithelium analysis. ChIP-sequencing on isolated colon epithelial cells from two mice. a Browser view of a segment from chromosome 1 showing a representative profile of the distribution of H3K18cr peaks with relationship to genes. Relative enrichment of the combined replicate sets of ChIP and input in linear scale are shown, probes are 500 bp, 250 bp overlap.b Average distribution of ChIP-seq normalized read counts with relation to genes shows that histone H3K18cr is highly enriched over transcription start sites (TSS) in colon epithelial cells.c Link between H3K4me3 and H3K18cr, using MACS peak quantification and an aligned probe plot. Probes were ranked according to H3K4me3 signal strength and span 5 kbp around MACS peaks.d Average distribution of reads in linear scale with relation to genes' TSS, showing enrichment over these sites. e Relationship between H3K18cr enrichment over TSS and mRNA levels of the corresponding genes from cells isolated from the mouse colon epithelium were quantified using mRNA-seq (three biological replicates) and the normalized read counts over genes were divided into percentile bins as indicated, from lowly expressed genes (0–25 percentile) to very highly expressed genes (99–100 percentile). H3K18cr over TSS ±0.5 kbp of genes belonging to the expression bins was quantified and is shown in box-whisker plots. f KEGG pathway terms and their adjusted p-values of significance of genes with the highest 10 percentile H3K18cr associated (MACS) peaks. Only results with–log10(p) > 6 are shown, see Supplementary Fig.6for all results. Cancer pathways are
a
Untreated Antibiotics 0 20 40 60 Luminal acetate Untreated Antibiotics 0 5 10 15 20 Luminal propionate Untreated Antibiotics 0 2 4 6 8 Luminal butyrate Untreated Antibiotics 0 1 2 3 4 5 Serum acetate Untreated Antibiotics 0 2 4 6 8 10 Serum propionate Untreated Antibiotics 0 1 2 3 4 5 Serum butyrate***
***
ns*
ns***
c
*
*
ns***
*
*
Untreated Antibiotics 0 1 2 3 HDAC2 Anti-HDAC2 Anti-H3K18cr Untreated Abx Anti-H4K8cr Anti-Kcr Anti-H3 Anti-H3K18ac Anti-H4K8ac Anti-H4K12ac Untreated Antibiotics 0 1 2 3 H3K18ac ns Untreated Antibiotics 0.0 0.5 1.0 1.5 2.0 H4K8ac Untreated Antibiotics 0.0 0.5 1.0 1.5 2.0 Kcr H3 band Untreated Antibiotics 0.0 0.5 1.0 1.5 2.0 Kcr H4 band Experiment 1 Experiment 2 Experiment 1 Experiment 2Experiment 1 Experiment 2 Experiment 1 Experiment 2
15 kDa 15 kDa 15 kDa 15 kDa 15 kDa 15 kDa 55 kDa 15 kDa Untreated Antibiotics 0.0 0.5 1.0 1.5 2.0 H4K8cr Untreated Antibiotics 0.0 0.5 1.0 1.5 2.0 H3K18cr
Relative band intensity
Relative band intensity
Relative band intensity Relative band intensity
mmol/kg mmol/kg mmol/kg
µ g/ml µg/ml µ g/ml
b
d
Fig. 3 Microbiota depletion affects colonic histone crotonylation and HDAC2. Antibiotic treatment led to a decrease in luminal and serum SCFA levels in mice (n ≥ 3, from experiment 2). a Acetate, propionate, and butyrate concentrations were measured in the colon lumen and serum by gas chromatography. Unpairedt-tests were conducted, *p-value < 0.05 and ***p-value < 0.001. Values of zero were below detectable levels. b Quantifications of western blot analysis of colon extracts from untreated and treated mice,n ≥ 3. Experiments 1 and 2 are repeat experiments. Center values (small bar) are the average of the treatment group relative to the untreated group. Two-way ANOVA (two-tailed) was performed on quantified bands to compare the effect of treatment for both experiments together; * corresponds to ap-value of < 0.05 and *** corresponds to <0.001. The quantification showed a statistically significant decrease in H4 crotonylation as detected by the anti-Kcr antibody and in H4K8cr, H4K8ac, and H3K18cr levels upon antibiotics treatment.c Global changes in various colon histone crotonylation and acetylation marks and HDAC2 as seen in representative western blots of colon extracts, from experiment 1.d Two-way ANOVA was performed on quantified bands from western blotting analysis with anti-HDAC2. A statistically significant increase was observed (p-value < 0.05)
in the brain. As SCFAs are taken up from the colon into the blood
stream (as supported by our own data, Fig.
3
a), SCFAs might be
taken up by brain cells, where they may affect histone
mod-ifications
25. Future studies will determine if there are
brain-specific functions for histone crotonylation.
We found that the SCFA butyrate, a well-known HDAC
inhibitor, promotes histone crotonylation in intestinal cell
and organoid culture. This led us to test other HDAC inhibitors,
which
showed
that
class
I
specific HDAC inhibitors
strongly promoted histone crotonylation at concentrations at
which they affected histone acetylation and implicated class I
HDACs in histone decrotonylation. Our in vitro assays of
recombinant, purified class I HDAC1-3 show that they are
decrotonylases and demonstrates that HDAC inhibitors,
includ-ing butyrate, reduce decrotonylation. Furthermore, the low K
mvalue of HDAC1 with crotonylated histones suggests that it can
efficiently decrotonylate this relatively less abundant histone
modification. Together, these findings strongly suggest that
SCFAs such as butyrate promote histone crotonylation by
inhi-biting the decrotonylase activity of HDACs in colon epithelial
cells. Future studies will address to what extent SCFAs also
promote crotonylation by acting as substrates for the generation
of intracellular crotonyl-CoA.
Our
finding that class I specific HDAC inhibitors promoted
global histone crotonylation led us to explore where this increased
histone crotonylation (H3K18cr) occurs in the genome in
cul-tured colon carcinoma cells. We show that the increase is not
because of a greater number of crotonylation peaks but a diffuse
spread of crotonylation genome-wide, including within repetitive
regions. Therefore, while H3K18cr
‘peaks’ do exist over TSS, these
findings suggest that pervasive crotonylation also occurs across
the genome and that it is controlled by class I HDACs.
Additionally, we show that histone crotonylation is modulated
during the cell cycle and that class I HDACs play a role in this
regulation. In synchronized cells, we
find an increase of histone
crotonylation during S phase which is enhanced when cells are
treated with the HDAC inhibitor MS275. Newly synthesized
histones are acetylated on several specific lysine residues (e.g., K5
and K12 on histone H4; K14, K18 on histone H3) prior to their
deposition onto nascent chromatin
26,27, reviewed in ref.
28. These
acetylations are then globally removed following nucleosome
assembly, which is important for the maintenance of repressive
chromatin, such as pericentromeric heterochromatin
19,29. Class I
HDACs are targeted to replicating chromatin and mediate this
deacetylation
30,31. Therefore, the levels of these histone
acetyla-tions are modulated in a cell cycle and HDAC-dependent
man-ner. In this study, we provide evidence that histone crotonylation
marks behave similarly to the pre-deposition acetylation marks:
they are low in G1 arrested cells and increase as cells progress
through S phase and this modulation depends on class I HDACs.
Therefore, histone crotonylation is not simply modulated through
dilution with non-crotonylated histones through the cell cycle,
but appears to be actively regulated by HDACs. Future studies
will address if histone crotonylation is also mediated prior to
histone deposition onto nascent chromatin and will address how
HDACs and other factors regulate histone crotonylation
con-comitant with chromatin replication.
Importantly, consistent with our
finding that
microbiota-generated SCFAs such as butyrate promote histone crotonylation
in vitro, we show that depletion of the microbiota led to a loss of
histone crotonylation. Our data suggest that the levels of histone
crotonylation in the gut reflect the generation of SCFAs by the
microbiota. Given the important role of microbiota-generated
SCFAs in modulating immunity and metabolism, our work
DMSO MS275 25 kDa Anti-H3 Anti-Kcr 0 1 5 10 0 0.5 1 5 Crotonate Butyrate (mM) 25 kDa Anti-Kcr Anti-H3K18bt Anti-LaminB1 Anti-H3K18ac Anti-H3K18cr MS 275 (µM) 25 kDa 70 kDa 25 kDa 25 kDa 25 kDa H4 H3 H4 H3 NT DMSODMSO40 10 7.5 5 2 1 0.5 0.250.1 % input 0.08 0.00 ADAD1 Up PUMACLDN7 p21 PUMA Chr1 SATChr4 SAT SAT1 SAT2 NBL2 0.02 0.04 0.06 0.10 0.12
a
b
c
Fig. 4 Butyrate and class I HDAC inhibition promote histone crotonylation. a Western blot analysis with indicated antibodies of whole cell extracts of small intestinal organoids treated for 48 h with indicated amounts of SCFAs. Representative western blot of two repeat experiments.b HCT116 cells were treated with MS275 or DMSO (vehicle) for 18 h, whole cell extracts collected, and analyzed by western blot using indicated antibodies; anti-Kcr: anti-crotonyl-lysine antibody, NT: not treated.c Increase in histone H3K18cr over promoters of indicated genes and repetitive, heterochromatic sites (alpha-satellite sequences, NBL2) upon MS275 treatment of HCT116 cells for 18 h. Summary of ChIP-qPCR data of three repeat experiments, error bars are SEM
proposes that the signaling between the microbiota and
chro-matin might be mediated through histone crotonylation. Future
work will explore further the roles of histone crotonylation in
normal gut physiology including host–microbiome interaction,
inflammation, and disease.
A surprising
finding of our work is that depletion of the
microbiota of mice with antibiotics not only led to a drop in
luminal and serum SCFAs, but also an increased expression of
HDAC2 in colon. A reduction in histone crotonylation is
con-sistent with both changes. A loss of SCFAs upon microbiota
2 4 6 8 10 12 2 4 6 8 10 12 R = 0.983 2 4 6 8 10 12 2 4 6 8 10 12 R = 0.983
H3K18ac (control) log2 H3K18ac (MS275) log2
H3K18cr (MS275) log2 H3K18cr (control) log2 –8000–6000–4000–2000TSS+2000+4000+6000+8000 1 1.2 1.4 1.6 1.8 4 6 8 10 12 4 6 8 10 12 Close to/within MS275 upregulated genes R = 0.973 2 4 6 8 10 12 2 4 6 8 10 12 Close to/within MS275 upregulated genes R = 0.968 H3K18cr (MS275) log2 H3K18ac (MS275) log2
H3K18cr (control) log2 H3K18ac (control) log2
b
Relative enrichment MS275 H3K18cr ChIP*
*
H3K18ac (control) H3K18ac MS275 H3K18cr (control) H3K18cr MS275 INPUTS H3K18ac control H3K18ac MS275 H3K18cr control H3K18cr MS275 InputsAVG read count over TSS
H3K18ac ChIP DMSO 0 500000 100000 150000 200000 250000 300000
a
c
d
e
f
g
depletion may lead to stabilization or increased expression of
HDAC2. In this context, it is interesting to note that a previous
study has shown that the stability of HDAC2 is selectively
reduced by the HDAC inhibitor valproic acid (a branched SCFA)
or butyrate and this is mediated by Ubc8-RLIM targeted
pro-teasomal degradation
32. Remarkably, HDAC2 expression has
been linked to colorectal tumorigenesis
33,34. It will be interesting
to examine how this links to our
finding that H3K18cr peaks
occur over a significant number of genes linked to cancer
path-ways. Future studies will examine how HDAC2 expression,
microbiota, and SCFAs are linked and how this affects histone
crotonylation over specific genes and cancer progression in the
colon.
While our study was in revision, a study by Yu, Wong, and
collaborators also demonstrated histone decrotonylation activity
of class I HDACs using transfection experiments in cell culture
35.
Our study complements and extends these and related
findings
36,37as we explore the effect of HDAC inhibitors on the
distribution of histone crotonylation, the link between histone
crotonylation and the cell cycle, and investigate how the
micro-biota influence these processes. This expands our understanding
of the functional spectrum of these exciting drug targets in cancer
therapy and other diseases
38, 39and provides a basis for the
development of specific inhibitors of the decrotonylation versus
deacetylation activity of these enzymes.
Methods
Mice. Mice were C57BL/6 background, details available on request. Male mice were used for all experiments. All mice were kept in specific pathogen-free conditions and fed ad lib. Mice for the ChIP and RNA-seq experiments were housed at the Babraham Institute Biological Service Unit. All experimental protocols at Babra-ham Institute were approved by the BabraBabra-ham Research Campus local ethical review committee and the Home Office (PPL 80/2488 and 70/8994). The anti-biotics treatment experiments were performed at the University of Campinas. Male C57BL/6 mice at age 8–12 weeks were provided by the Multidisciplinary Centre for Biological Investigation (CEIMB) and all the experimental procedures were approved by the Ethics Committee on Animal Use of the Institute of Biology, University of Campinas (protocol number 3742-1). No sample size calculation was used as the minimum number of mice used was 3 or 4. Mice of the same age and breed were randomly put in the experimental groups. The order of samples from groups was mixed on collection. Sample size is reported in exact numbers and no samples are excluded from the analysis. No blinding was conducted.
Antibiotic treatment of mice. Mice received 200µl of a mixture of antibiotics (5 mg/ml of neomicin, 5 mg/ml of gentamicin, 5 mg/ml of ampicillin, 5 mg/ml of metronidazole, and 2.5 mg/ml of vancomycin, Sigma Aldrich) daily for 3 days by gavage. The weight of the animals was monitored throughout the experiment. At the end of treatment period, feces were collected and snap-frozen in liquid nitrogen. After that, the animals were anesthetized using a mix of ketamine and xylazine (300 and 30 mg/kg, respectively) and the blood was collected by cardiac puncture. The blood was maintained at room temperature (RT) for 30 min and then centrifuged (3000×g, 8 min). The serum was collected and frozen at−80 °C. After euthanizing the animals by cervical dislocation, the entire intestine was harvested and the small intestine, colon, and cecum were isolated.
Determination of fecal bacterial load. Stool samples were collected on the third day after treatment by gavage with a mix of antibiotics or placebo. Fifty milligrams of the samples were used for extraction of the microbial genomic DNA using the InvitrogenTMPureLinkTMMicrobiome DNA Purification kit (Thermo Fisher
Scientific, MA, USA). Bacterial DNA was quantified by real-time PCR using pri-mers complementary to 16S rDNA of Eubacteria (sense ACT CCT ACG GGA GGC AGC AGT; anti-sense ATT ACC GCG GCT GCT GGC)40. To determine the
fecal bacterial load, a standard curve with serial dilutions was employed using genomic DNA extracted from Escherichia coli grown in vitro. Results obtained were normalized by the control condition (untreated mice).
SCFA measurements. Colonic luminal content samples were weighed into 1.5 ml tubes, crushed and homogenized in 100µl of distilled water. Subsequently, 40 mg of sodium chloride, 20 mg of citric acid, 40µl of 1 M hydrochloric acid, and 200 µl of butanol were added. The tubes were vortexed for 2 min and centrifuged at 18,000×g for 15 min. The supernatant was transferred to microtubes, and 1µl was injected into the gas chromatograph. For serum measurements, 20 mg of sodium chloride, 10 mg of citric acid, 20µl of 1 M hydrochloric acid, and 100 µl of butanol were added to 100µl of serum samples. Tubes were vortexed and centrifuged as pre-viously described and 1µl was injected into the gas chromatograph. To quantify SCFAs, a calibration curve for the concentration range of 0.015–1 mg/ml was constructed. SCFAs measurements were performed following a recently published protocol41: chromatographic analyses were performed using an Agilent 6850
sys-tem with ExChrom software, equipped with a 7683B automatic liquid sampler, a flame ionization detector (FID) (Agilent Technologies, USA), and a fused-silica capillary RTX-WAX (Restec Corporation, U.S.) with dimensions of 60 m × 0.25 mm internal diameter (i.d.) coated with a 0.15-µm thick layer of polyethylene glycol. The initial oven temperature was 100 °C (hold 2 min), which was increased to 200 °C at a rate of 15 °C/min (hold 5 min). The FID temperature was maintained at 260 °C, and theflow rates of H2, air, and the make-up gas N2were 35, 350, and
25 ml/min, respectively. Sample volumes of 1µl were injected at 260 °C using a split ratio of approximately 25:1. Nitrogen was used as the carrier gas at 25 ml/min. The runtime for each analysis was 12.95 min.
Small intestinal and colon epithelium extraction. Animals were sacrificed by cervical dislocation or exposure to CO2. Dissected small intestines and colons were
opened longitudinally and washed three times with ice cold Hank's balanced salt solution without Ca2+/Mg2+(HBSS). Intestinal and colon epithelium were dis-sociated with 30 mM EDTA/HBSS on ice with shaking for 30 min for small intestine and 1 h for colon; 50 ml Falcon tubes containing the tissue were then shaken vigorously by hand (2–3 shakes/second) for 5 min. The colon epithelium was incubated for an additional 10 min on ice in 30 mM EDTA/HBSS and further shaken for 5 min. Mucus and sub-mucosa were removed by dripping the material through a 100μm followed by a 70 μm cell strainer. The extracted cells were pelleted at 475×g at 4 °C for 10 min. The cells were washed with ice cold HBSS and re-pelleted as above for further use. For the H3K18cr ChIP, three colons were combined.
Purification and enzymatic digestion of histones. For isolating a crypt-enriched fraction, villi were removed by shaking the small intestine pieces for 10 s after incubation for 5 min on ice in HBSS–30 mM EDTA and before the additional incubation in HBSS–30 mM EDTA for 15 min. Histones were then acid extracted following a protocol published in ref.42: one small intestine/colon was used per
extraction followed by MS analysis. Small intestine epithelium, colon epithelium, and a crypt-enriched fraction were homogenized in lysis buffer (10% sucrose; 0.5 mM EGTA, pH 8.0; 15 mM NaCl; 60 mM KCl; 15 mM HEPES; 0.5% Triton; 0.5 mM PMSF; 1 mM DTT; 5 mM NaF; 5 mM Na3VO4; 5 mM Na-butyrate, cocktail of
protease inhibitors (Sigma)). Nuclei were separated from the cytoplasm by cen-trifugation on sucrose cushions, washed in cold PBS, and then extracted in 0.4 N HCl overnight (o.n.) at 4 °C. Core histones, together with linker histones protein, were dialyzed against 100 mM ice-cold acetic acid. The concentration of purified samples was measured using the Bradford protein assay. Approximately 10µg were separated on SDS-PAGE and bands corresponding to the histones H3 were excised and in-gel digested43. Briefly, gel bands were cut in pieces and destained with repeated washes in 50% acetonitrile (ACN) in H2O, alternated with dehydration
steps in 100% ACN. Gel pieces were then in-gel chemically alkylated by incubation with D6-acetic anhydride (Sigma 175641) in 1 M NH4HCO3and CH3COONa
solution as catalyzer. After 3 h at 37 °C with high shaking in a thermomixer, chemically modified gel slices were washed with NH4HCO3, alternated with ACN
Fig. 5 H3K18cr and H3K18ac ChIP-seq on MS275-treated HCT116 cells. a Probe trendplot over TSS (±10 kbp) of reads from H3K18ac and H3K18cr ChIP-seq on HCT116 cells with and without MS275 treatment;b H3K18cr and H3K18ac ChIP-seq analysis shows a relative decrease in these marks over TSS upon MS275 treatment, error bars are SEM,n = 3, p < 0.05, paired t-test; c aligned probe plots over TSS (±5 kbp) of reads from H3K18ac and H3K18cr ChIP-seq with and without MS275 treatment, aligned probes were ranked according to read counts in the H3K18cr/MS275 ChIP-seq.d Scatterplot of read counts of H3K18ac versus H3K18cr MACS peaks of control (vehicle treated) cells ande of H3K18ac versus H3K18cr MACS peaks of MS275-treated cells. f Read counts in H3K18cr MACS peaks from control cells versus MS275-treated cells. MACS peaks close (+2 kbp) and within upregulated genes are in red.g Read counts in H3K18ac MACS peaks from control cells versus H3K18ac, MACS peaks of MS275-treated cells, MACS peaks close (+2 kbp) and within upregulated genes are in red. MACS peaks that show an increase in H3K18cr (f) or H3K18ac (g) on MS275 treatment are in blue. For both H3K18cr and H3K18ac, there is a disproportionate larger number of MACS peaks linked to MS275-upregulated genes that also show an increase in H3K18cr (f) or H3K18ac (g) on MS275 treatment compared to those that show a decrease in these modifications (p < 0.0001, χ2test)
at increasing percent (from 50 to 100%). In-gel digestion was performed with 100 ng/µl trypsin (Promega V5113) in 50 mM NH4HCO3at 37 °C overnight. Chemical
acetylation occurs on unmodified and monomethylated lysines and prevents trypsin digestion at these residues, thus producing a pattern of digestion similar to that obtained with the Arg-C protease (the so-called“Arg-C like” in-gel digestion pattern). The resulting histone peptides display an optimal length for MS detection and enhanced hydrophobicity that increases their separation at ultra-pressure chromatographic regimes.
Finally, digested peptides were collected and extracted using 5% formic acid alternated with ACN 100%. Digested peptides were desalted and concentrated using a combination of reverse-phase C18/C“sandwich” system and strong cation exchange (SCX) chromatography on hand-made micro-columns (StageTips44,45). Eluted peptides were lyophilized, suspended in 1% TFA in H2O, and then subjected
to LC-MS/MS.
LC-MS/MS. The peptide mixtures were analyzed by online nano-flow LC-MS/MS using an EASY-nLC 1000 (Thermo Fisher Scientic) connected to a QExactive (Thermo Fisher Scientific) through a nano-electrospray ion source. The nano-LC system was operated in one column setup with a 25-cm analytical column (75µm inner diameter, 350µm outer diameter) packed with C18 resin (ReproSil, Pur C18AQ 1.9 m, Dr. Maisch, Germany) configuration. Solvent A was 0.1% formic acid (FA) in ddH2O and solvent B was 80% ACN with 0.1% FA. Samples were
injected in an aqueous 1% TFA solution at aflow rate of 500 nl/min. Peptides were
separated with a gradient of 0–40% solvent B for 100 min, followed by a gradient of 40–60% in 5 min, and 60–95% over 5 min at a flow rate of 250 nl/min. The Q-Exactive instrument was operated in the data-dependent acquisition (DDA) to automatically switch between full scan MS and MS/MS acquisition. Survey full scan MS spectra (from m/z 300–1150) were analyzed in the Orbitrap detector with resolution R= 60,000 at m/z 200. The 10 most intense peptides were sequentially isolated to a target value of 3 × 10⁶and fragmented by high-energy collisional
dissociation (HCD) with a normalized collision energy setting of 27%. The max-imum allowed ion accumulation times were 20 ms for full scans and 50 ms for MS/ MS and the target value for MS/MS was set to 1 × 10⁶. Standard mass spectrometric conditions for all experiments were as follows: spray voltage, 2.4 kV; no sheath and auxiliary gasflow.
MS data analysis and relative abundance profiling. Acquired RAW data were analyzed by MaxQuant(MQ) software v1.5.2.8, using the Andromeda search engine46. Uniprot Mouse database (70,902 entries) was used for peptide identifi-cation. Enzyme specificity was set to Arg-C. Estimated false discovery rate of all peptide identifications was set at a maximum of 1% (Decoy database-based approach). Mass tolerance for searches was set to a maximum of 6 parts per million (ppm) for peptide masses and 20 ppm for HCD fragment ion masses. A maximum of three missed cleavages was allowed. In the search, we focused on lysine methylation and acylation, including as variable modifications: D3-acetylation (+45.0294 Da), D3-acetylation (+45.0294 Da) plus monomethylation (+14.016 Da),
0 20 40 60 80 100
% cells in cell cycle phase
G2/M S G1 DMSO
Hours after abemaciclib release DMSO
+ MS275
Hours after abemaciclib release 8 8 0 1 2 3 4 5 6
Relative band intensity
Kcr H3K18cr H3K18ac 6 10 0 12 24 32 0 6 10 12 24 32 H3 H4 1 2 3 4 5 6 7 8 9 10 11 12 13 14 15 16 Anti-Kcr Anti-H3K18cr Anti-H3K18ac Anti-H3 15 kDa 15 kDa 15 kDa 25 KDa
Fig. 6 Histone crotonylation is cell cycle regulated by class I HDACs. Cell cycle block and release experiment on HCT116 cells using CDK4/6 inhibitor abemaciclib with and without MS275. Lanes 1 and 9: asynchronous cells, lane 2: G1 arrested cells, lanes 3–8: increase in histone crotonylation (Kcr), H3K18cr and H3K18ac upon release into S phase. Lanes 10–16: histone crotonylation, H3K18cr and H3K18ac are upregulated during a G1 arrest and S phase when class I HDACs are inhibited with MS275. For the experiments in lanes 9–16, cells were blocked in G1 using 15 nM abemaciclib in the presence of 5 μM MS275 and released into S phase in the presence of 1μM MS275. Cell cycle profiles are shown at the top, western blots in the middle, and quantifications of those, as calculated relative to H3 and normalized to the DMSO (vehicle) sample, at the bottom. Representative of two experiments is shown
dimethylation (+28.031 Da), trimethylation (+42.046 Da), acetylation (+42.010 Da), and crotonylation (+68.074 Da). The use of high-accuracy criteria for HCD fragment ions tolerance (20 ppm) guarantee the capability to discriminate among other possible forms of acylation (e.g., lysine butyrylation (70.0418 Da) and β-hydroxybutyrylation (86.0367 Da)), therefore they were not included in the search. MaxQuant search results were exported and peptides with Andromeda score<60 and localization probability score<0.75 were removed. Filtered data were subjected
to manual inspection and validation using the viewer.exe module integrated in MQ software47. Extracted ion chromatograms were constructed for each precursor based on the m/z value, using a mass tolerance of 10 ppm with a mass precision up to four decimals. For each histone-modified peptide, the relative abundance per-centage (RA%) was estimated by dividing the area under the curve (AUC) of each modified peptide over the sum of the areas corresponding to all observed isoforms of that peptide, including the unmodified forms48. Significant changes among crypt
Anti-H3K18ac
Anti-H3K18cr HDAC1 HDAC2 HDAC3-NCoR1
15 KDa 15 KDa 15 KDa Anti-H3K18bt Anti-H3 15 KDa -200 100 50 25 12.5 6.25 0 0 50 25 12.5 6.25 3.13 1.56 0 0 10 5 2.5 1.25 0.625 0 0 25 kDa HDAC1 TSA (nM) 25 kDa Crotonate (mM) 200 100 50 25 12.5 6.25 0 0 50 25 12.5 6.25 3.13 1.560 0 10 7.5 5 2.5 1.250.6250 0 26 kDa Butyrate (mM) 25 kDa HDAC1 25 kDa 25 kDa Anti-Pan-crotonyllysine Anti-H3K18-acetyllysine Crotonylated H3 Acetylated H3 15 kDa Crotonate (mM) HDAC1 No HDAC1 Anti-H3K18cr 0.0 0.5 1.0 1.5 0.0 0.5 1.0 1.5 2.0 Acetyl-H3 (µM) Butyrate (mM) Anti-H3K18bt Acetate (mM) Anti-H3K18ac 0.0 0.5 1.0 1.5 0.0 0.2 0.4 0.6 0.8 1.0 Crotonyl-H3 (µM) Vmax: 3.1 ± 0.4 µM/min Km: 1.5 ± 0.3 µM Kcat: 103.4 ± 11.7 min–1 15 kDa 15 kDa Rate ( µ M/min) Rate ( µ M/min) Kcat: 38.1 ± 6.7 min–1 Km: 0.4 ± 0.2 µM Vmax: 1.1 ± 0.2 µM/min 50 25 12.5 6.250 50 25 12.5 6.25 0 50 25 12.5 6.250 50 25 12.5 6.25 0 50 25 12.5 6.250 50 25 12.5 6.25 0
a
b
c
d
Fig. 7 Class I HDACs are histone decrotonylases. a Histone H3 decrotonylation and deacetylation in vitro by HDAC1, HDAC2, or HDAC3/Ncor1 complex; 5.65μM histones were crotonylated or acetylated in vitro and then subjected to removal of the modification by the indicated HDACs. HDAC1 was 0.25, 0.12, 0.06, and 0.03μM. HDAC2 was 0.18, 0.09, 0.05, and 0.02 μM. HDAC3/Ncor1 complex was 0.45, 0.23, 0.11, and 0.06 μM. b Comparative kinetics of HDAC1 decrotonylation and deacetylation; 5.65µM histones were crotonylated or acetylated and then subjected to removal of the modification by 0.03 µM HDAC1 for different lengths of time. Samples were analyzed by dot blotting and initial rates of reaction were determined by plotting substrate removal over time. Kinetic parametersVmax,Km, andKcat, error bars are SEM,n = 3. c Effect of HDAC inhibitors TSA, crotonate, and butyrate on deacetylation and
decrotonylation by HDAC1 in vitro. Representative blots of two repeat experiments are shown.d Histone crotonylation by HDAC1 using crotonate in vitro. Incubation of crotonate, acetate, or butyrate with or without HDAC1 followed by western blotting analysis with anti-H3K18ac/bt/cr. Western blot of HDAC1 and crotonate assay is representative of two western blots
and colon versus small intestine fraction have been calculated with a two-way ANOVA test using the Perseus software49. p-Value< 0.01 (1% FDR) were
con-sidered as significant.
Antibodies and western blot analysis. Anti-lysine crotonyl antibody (PTM-501, 1:5000), anti-crotonyl-histone H3 lys18 (anti-H3K18cr, PTM-517, 1:5000), and anti-butyryl-histone H3 lys18 (anti-H3K18bt, PTM-306, 1:5000) were from PTM BIOLABS; anti-tri-methyl H3 lys4 antibody was from Active Motif (anti-H3K4me3, Cat.39159); anti-crotonyl-histone H4 lys8 antibody (anti-H4K8cr, ab201075), acetyl-histone H3 lys18 (H3K18ac, ab1191, 1:10000), histone H4 (ab31827, 1:40000) histone H3 (ab1791, 1:40000), and anti-LaminB1 (ab16048, 1:5000) were from Abcam; mouse monoclonal anti-HDAC1 (Clone 2E10, 1:5000) from Millipore, monoclonal anti-HDAC2 (C-8) (sc9959, 1:5000) from SantaCruz, and mouse polyclonal HDAC3 (BD61124, 1:5000) from BD biosciences.
Western blots were washed with tris-borate-sodium-0.05% Tween-20 (TBS-T) and developed using enhanced chemiluminescence (ECL); uncropped western blots are shown in Supplementary Figures12–14.
Cryosections and immunofluorescence staining. Cryosections were prepared from adult murine tissue,fixed for 90 min at RT with 4% formaldehyde in phos-phate buffered saline (PBS). After 2 × 5 min washes with 1× PBS, samples were incubated in 30% sucrose overnight at 4 °C and embedded in Cryomatrix (Ther-moFisher 6769006). Frozen blocks were cut with the Leica CM1860 cryotome to 8 μm sections and attached to Superfrost Plus slides (ThermoFisher 4951PLUS4). Before staining, sections were brought to RT, dried for 3 min at 60 °C, permeabi-lized for 20 min at RT in 1% Triton-X-100/PBS, and unmasked for 30 min at 95 °C in a citrate based-unmasking buffer (VECTOR H3300) followed by 3 × 5 min washes in PBS. Slides were blocked for 1 h in 5% FBS/PBS (FBS: fetal bovine serum) at RT followed by primary antibody (pan-crotonyl PTM Biolabs Inc. #PTM501, 1µg/ml final conc.) incubation in blocking solution for 1 h at RT. After 4 × 5 min washes in 1× PBS, secondary antibody (AlexaFluor 488 Invitrogen A11008, 1µg/ml final conc.) was applied for 1 h at RT in blocking solution sup-plemented with DAPI. After 4 × 5 min washes in 1× PBS, samples were mounted in Vectashield H-1000 and sealed. Controls without the primary antibody were processed accordingly. Imaging was performed with the Zeiss780 confocal microscope using 20× air and 63× oil immersion objectives at optimal resolution settings. Z-stacks of whole sections were imaged and further processed to max-imum projections with ImageJ software. For optimal print results background correction and contrast enhancement with up to 3% pixel saturation were per-formed with ImageJ.
Cell culture and cell cycle analysis. Human colon carcinoma cells (HCT116) were a gift from Simon Cook's lab (Babraham Institute) who obtained them from Bert Vogelstein, John Hopkins University, Baltimore. This cell line is not in the database of commonly misidentified cell lines (ICLAC). They were grown in DMEM media containing glucose and pyruvate, 10% FBS, 2 mM L-glutamine, 100 units/ml penicillin, and 100µg/ml streptomycin. For the cell cycle analysis, HCT116 cells were blocked at G1 with 15 nM of abemaciclib (LY2835219, Seleck Chemicals) for 48 h and released by washing 2× with PBS and adding fresh medium. Class I HDAC inhibition was with 5μM MS275 for 48 h. Cells were
washed 2× with PBS and fresh medium supplemented with 1μM MS275 was added. Cells were harvested at indicated intervals after release and one half was analyzed by western blotting. The remainder were used to determine cell cycle profiles with propidium iodide staining using the BD Pharmingen PI/RNAse staining buffer on LSRII Flow Cytometer (BD Biosciences) and Cell Cycle tool on FlowJo 10.0.8. HDAC1 over-expression was performed by transfecting HCT116 cells using Lipofectamine® 2000 Transfection Reagent following manufacturer's protocol using 50μL of reagent and 12 μg of p181 pK7-HDAC1 (GFP) plasmid DNA (gift from Ramesh Shivdasani, Addgene plasmid # 1105450) or an N-terminal deletion mutant in a 60-mm dish for 16 h.
Whole cell extract preparations. For whole cell extract preparation, cells were detached with trypsin, washed in PBS, and boiled in Laemmli sample buffer (Biorad) for 5 min. The extracts were briefly sonicated to remove high molecular weight DNA before loading on an SDS-polyacrylamide gel for electrophoresis. Intestinal organoid seeding and cultures. Small intestinal crypts were derived from wildtype C57BL/6 mice using a slightly modified protocol from reference51.
In brief, collected small intestines were opened longitudinally and the majority of villi removed by gentle scraping with a coverslip. The tissue was cut to 3–5 mm pieces, washedfive times with cold PBS, and vigorous shaking. After 30 min incubation on ice with 2 mM EDTA/ PBS, the remaining villi were removed with short shaking and tissue pieces were incubated for additional 30 min in 5 mM EDTA/PBS on ice. After another short shake, crypts were passed through a 40-μm cell strainer and pelleted at 425×g 1500 rpm at 4 °C for 10 min. The pellet was washed with cold PBS and 100–200 crypts were suspended in 50 μl Red-phenol-free Matrigel (BD Biosciences) droplets. After polymerization, complete medium containing advanced DMEM/F12 (Sigma), 2 mM Glutamax (Invitrogen), 10 mM HEPES (Gibco), 100 U/ml penicillin/streptomycin (Invitrogen), 1 mM N-acetyl-cysteine (Sigma), 1× B27 supplement (Invitrogen), 1× N2supplement (Invitrogen),
50 ng/ml mouse EGF (Peprotech), 100 ng/ml mouse Noggin (Peprotech), and 10% human R-spondin-1-conditioned medium from R-spondin-1-transfected HEK293T cells (Cultrex) was added to the cultures. Medium was changed every 3 days and organoids passaged after 7–10 days.
ChIP-seq of extracted colon epithelium. The colon epithelium cell pellet was resuspended in 10 ml of PBS-1% formaldehyde andfixation was carried out for 10 min, at RT with gentle agitation. The reaction was quenched by the addition of glycine (0.125 Mfinal concentration) and the cells were pelleted at 475×g at 4 °C for 10 min, washed once with PBS, re-pelleted and either snap-frozen in liquid nitrogen for storage at−80 °C or processed further immediately. The cell pellet was resuspended and incubated for 10 min in 500μl 50 mM Tris-HCl, pH 8.0, 10 mM EDTA 1% SDS (ChIP lysis buffer) on ice. Sonication of the chromatin to 100–500 bp fragment size range in polystyrene tubes was performed with a water-cooled Bioruptor (Diagenode), high power, 4 °C, 12 cycles, 30 s on, 30 s off. The sonicated material was transferred to a 1.5-ml tube, incubated for 30–45 min on ice, and pelleted at 20,800×g for 10 min, 4 °C to precipitate SDS. We pooled three colons to perform three ChIP experiments, using 20–25 μg equivalent of DNA for each experiment. For immunoprecipitation, the chromatin was diluted 1:10 with ChIP dilution buffer (16.7 mM Tris-HCl, pH 8.0, 1.2 mM EDTA, 167 mM NaCl, 1.1% Triton-X-100), 5μg anti-H3K18cr antibody (PTM-517) or H3K4me3 antibody (Active Motif Cat.39159) per 20μg DNA was added and this was incubated overnight on a rotating wheel at 4 °C. One percent input chromatin was collected and kept on ice. Immunoprecipitation of chromatin complexes was with Protein A-coated Dynabeads (Novex, Cat.10001D); 20–30 μl of bead suspension were washed two times with ChIP dilution buffer and the antibody–chromatin mix was added to the beads. Immunoprecipitation was for 2 h at 4 °C on a rotating wheel. Following this incubation, tubes were spun briefly and bound material was separated from unbound using a magnetic stand on ice.
All washes were performed at 4 °C for 5 min on a rotating wheel using 20× volumes with respect to the beads volume used. Beads were washed 1× with low-salt wash buffer (20 mM Tris-HCl, pH 8.0, 2 mM EDTA, 150 mM NaCl, 1% Triton-X-100, 0.1 % SDS), 2× with high-salt wash buffer (20 mM Tris-HCl, pH 8.0, 2 mM EDTA, 500 mM NaCl, 1% Triton-X-100, 0.1 % SDS), and 1× with 10 mM Tris-HCl, 1 mM EDTA (1× TE). Elution of DNA from beads was with 200μl of freshly prepared elution buffer (0.1 M NaHCO3, 1% SDS) at 65 °C for 30 min in a
thermomixer at 1000 rpm. Supernatant was separated using a magnetic stand and transferred to a fresh tube. After bringing all inputs to 200μl with elution buffer, both chromatin and input samples were reverse cross-linked by adding 8μl of 5 M NaCl followed by an incubation at 65 °C overnight at 300 rpm in a thermomixer. Proteinase K Solution (Ambion, Cat:AM2548) was added to samples to afinal concentration of 0.25 mg/ml and incubated for 2 h at 65 °C, 300 rpm. Chipped DNA was purified with QIAquick PCR purification kit (Qiagen, Cat.28104) and quantified using QubitTM3.0fluorimeter. Library preparation was performed from
5 ng of purified DNA using the NEBNext® UltraTMII DNA Library Prep Kit for
Illumina® with the following modifications: Illumina Tru-Seq adaptors were used and library amplification was performed with the KAPA PCR Amplification kit (KAPA, Cat. KK2501) using 11 cycles. Libraries were sequenced on a HiSeq2500 sequencer (Illumina) according to manufacturer's instructions.
20 40 60 80 100 120 140 0.8 mM HDAC1 BOC-Lys(Ac)-AMC BOC-Lys(Cr)-AMC + + – + + + – + +
Relative fluorescence intensity
(HDAC activity)
Fig. 8 BOC-Lys(crotonyl)-AMC inhibits deacetylation by HDAC1. A fluorometric in vitro assay showing that HDAC1 efficiently deacetylates the BOC-Lys(acetyl)-AMC substrate alone, but not in the presence of same amounts of BOC-Lys(crotonyl)-AMC. Performed in triplicate, error bars are standard deviation
ChIP-seq and ChIP-qPCR of HCT116 cell extracts. HCT116 cells were treated with either 5µM MS275 or DMSO for 18 h. Cells were trypsinized and fixed as indicated in the ChIP-seq section above. Fixed cells were re-suspended in Soni-cation buffer (150 mM NaCl, 25 mM Tris pH 7.4, 5 mM EDTA, 0.1% Triton, 1% SDS complemented with 10 mM sodium butyrate and protease inhibitor cocktail (P8340, Sigma)) and sonicated as described above for 15 cycles. After centrifuga-tion at 14,000×g for 10 min, supernatant was diluted 10× in ChIP dilucentrifuga-tion buffer; 1% input chromatin was collected and kept on ice and 30µg equivalent of DNA per sample was incubated overnight on a rotating wheel at 4 °C with 5µg of anti-H3K18cr antibody (PTM-517, PTM Biolabs) or 0.3µg of anti-H3K18ac antibody (ab1191, Abcam). Twenty microliters of Magnetic ProtA/G Beads (Millipore) were added to the samples and incubated on a rotating wheel for 3 h at 4 °C. Antibody-bound beads were washed as described above. Chip DNA was eluted at 65 °C for 30 min in 200µl of elution buffer. De-crosslinking and DNA elution of both ChIP and input samples was performed as described in the ChIP-seq section. Real time qPCR analysis was carried out on input and ChIP DNA samples using the SYBR® Green PCR Master Mix (Applied Biosystems) and run on a BioRad CFX96 qPCR system. Each experiment has been carried out two times (biological repli-cates) and each sample has been run in triplicate (technical replicate). One percent of starting chromatin was used as input and data were analyzed accordingly. Primers were used at afinal concentration of 250 nM with 62 °C as annealing/ extension temperature and are listed in Table2.
RNA-seq. RNA was extracted from both HCT116 cells (four biological replicates) and mouse colon epithelium (three mice as biological replicates) using the RNeasy Plus Mini Kit (Qiagen), following the manufacturer's instructions. Extracted RNA was quantified with Nanodrop and the quality assessed on a Bioanalyzer (Agilent). Library preparation was performed from 500 ng of RNA using the NEB Next® UltraTMDirectional RNA Library Prep Kit for Illumina® and the NEBNext® Poly (A) mRNA magnetic isolation module. Illumina Tru-Seq adaptors were used and library amplification was performed with the KAPA PCR Amplification kit (KAPA, Cat. KK2501) using 14 cycles. Libraries were sequenced on a HiSeq2500 sequencer (Illumina) according to the manufacturer's instructions.
Bioinformatic analysis. RNA-seq: Sequencing reads were adaptor trimmed using Trim Galore! (version 0.4.2) and mapped to the mouse (GRCm38/mm10) refer-ence genome with HiSat2 (version 2.0.5). Analysis of RNA-seq data was performed with SEQMONK version 1.36.0 onfiltered reads with a MAPQ score of >60 for uniquely mapped reads. Read counts were quantified using the RNA-seq quanti-tation pipeline implemented in Seqmonk, quantifying only probes with at least one read. Probe read values were corrected for transcript length and divided into percentile bins according to their average expression levels of three replicates.
ChIP-seq analysis: For mouse colon and HCT116 H3K18cr, two replicates and for H3K4me3 three biological replicates were used. Sequencing reads were adaptor trimmed using Trim Galore! (version 0.3.8 and 0.4.2) and mapped to the mouse (GRCm38/mm10) or human (GRCh38) reference genomes with Bowtie2 (version 2.0.4.). Analysis of ChIP-seq data was performed with SEQMONK version 1.36.0 onfiltered reads with a MAPQ score of >42, duplicate reads were always removed. For Fig.2b, the genome was segmented in 1000 bp non-overlapping 'probes' and read counts were quantified for each probe and normalized to the largest datastore. For Fig.2c, H3K4me3 peaks were identified using the MACS peak finder embedded in the SEQMONK program with the ChIP-seq data of H3K4me3 from colon epithelial cells and INPUT as reference. Selected fragment size was 300 bp and p-value significance threshold was 10−5. Reads were quantitated in and±5 kbp
around the MACS peaks. For Fig.2d, read counts were quantified over the TSS
(using a window of±1 kb upstream of genes) and probes that had more than 100 reads in input were removed in both input and ChIP. For Fig.2e, read counts were quantified over the TSS (using a window of ±0.5 kb upstream of transcripts) and were overlapped with RNA-seq data. KEGG pathway analysis was with DAVID 6.8 with electronic annotations excluded.
ChIP-qPCR data analysis. Prior to analysis, a logarithmic transformation of the data was carried out. Subsequently, we carried out a two-way ANOVA test fol-lowed by Holm-Sidak's multiple comparison test. Data were analyzed using the Graphpad Prism Software.
In vitro enzymatic assays of histone decrotonylation and deacetylation. Recombinant human histone H3.1 (NEB) was acetylated or crotonylated in vitro using the recombinant catalytic domain of p300 (human, ENZO) in presence of acetyl-CoA or crotonyl-CoA (Sigma-Aldrich), respectively. The reaction was car-ried out with 5.65μM histone H3.1 and 0.66 μM P300 catalytic domain in 50 mM Tris-HCL pH 8, 50 mM KCl, 0.1 mM EDTA, 0.01 % Tween-20, 10% glycerol, 1 mM DTT, and 87μM crotonyl-CoA or acetyl-CoA at 30 °C for 2 h. The reaction was stopped by heating at 65 °C for 5 min and the histones were diluted with two volumes of HDAC buffer (25 mM Tris-HCl, pH 7.5, 50 mM KCl, 1 mM MgCl2, 1
μM ZnSO4) for either decrotonylation or deacetylation reactions. Decrotonylation/
deacetylation was typically performed with 1.75μM modified histones and 0.12 μM HDAC1 (recombinant, human, Active Motif) or 0.18μM HDAC2 (recombinant, human, ABCAM) at 30 °C for 2 h. Recombinant HDAC3/Ncor1 complex was from ENZO Life Sciences. All HDACs were produced in insect cells and purified. After the reaction, the histone modifications were identified by western blot. The pixel intensities of the western blot bands were quantified with the Image J software.
For the enzyme kinetic analysis, histone H3 was acetylated or crotonylated in vitro as described above. Dot blot western analysis with synthetic H3 peptides that were specifically crotonylated or acetylated at K18 indicated full crotonylation and acetylation of the histone H3 at K18 under these conditions, therefore, we assume that the histone had been fully crotonylated or acetylated. Different dilutions of modified histones were prepared in HDAC buffer (25 mM Tris-HCl, pH 7.5, 50 mM KCl, 1 mM MgCl2, 1μM ZnSO4) for either decrotonylation or
deacetylation reactions. Decrotonylation/deacetylation was performed with 1.41 to 0.19μM modified histone H3 and 0.03 μM HDAC1 (recombinant, human, Active Motif) at 30 °C and stopped at 95 °C for 1 min. Five different modified histone concentrations andfive different time points were performed in triplicate for the decrotonylation and deacetylation reactions.
Each reaction was spotted in quadruplicate and left to dry before being rinsed with transfer buffer and TBS-T. Western blot was performed using anti-H3K18ac and anti-H3K18cr antibodies. Spots were quantified using image J and spot intensity was converted to substrate concentration by multiplying each relative value by the concentration of modified histone in the reaction mix. Substrate concentration against time were plotted for each histone concentration and a linear regression wasfitted for the first 30 s to 1 min of the reaction, as appropriate. The rate of each reaction set was plotted as replicates against substrate concentration. GraphPad Prism Version 7 software was used to calculate Km, Vmax, and Kcat.
Colorimetric deacetylation assay. Synthesis of Lys(acetyl)-AMC and BOC-Lys(crotonyl)-AMC and the colorimetric assay was essentially as in ref.2with some modifications: for the synthesis of crotonyl-N-hydroxysuccinimide, N-hydro-xysuccinimide (149 mg, 6 equivalents, eq) was dissolved in 2.5 ml anhydrous dichloromethane to which diisopropylethylamine (167 mg, 6 eq) was added. The solution was cooled in an ice bath and trans-crotonoyl chloride (135 mg, 6 eq) was added and the reaction stirred at 20 °C for 3 h. Ethyl acetate (5 ml) was added and the solution washed with 5 ml brine, dried over magnesium sulfate and con-centrated. The crude product was dissolved in 3 ml dry ACN and the appropriate amount used in the next step. Acetyl-N-hydroxysuccinimide was prepared in the same way but using acetyl chloride rather than crotonoyl chloride. For the synthesis of BOC-Lys (crotonyl)-AMC, Boc-Lys-AMC acetate salt (100 mg, 1 eq) purchased from Bachem AG was dissolved in 4 ml water:ACN (1:1). Sodium bicarbonate (19.95 mg, 1.1 eq) was added in 1 ml water followed by trans-crotonyl-N-hydroxysuccinimide ester (2 eq) in 2 ml ACN. The reaction was left for 18 h and then concentrated to remove the ACN. The product was extracted into ethyl acetate, dried over anhydrous magnesium sulfate and concentrated. The product was purified on silica in dichloromethane:methanol (15:1). BOC-Lys(acetyl)-AMC
Table 2 Primers used in ChIP-qPCR
Name Feature Forward (5′→3′) Reverse (5′→3′)
up PUMA Intergenic GTTGCCAGTTACCACACCCT CCCAACTGTCCTTGCTGCTA ADAD1 TSS of not expressed gene GCTTCAGGACGTGTGAGGTA TACCTGCGTGAGGGTTGTTT CLDN7 TSS of expressed gene ACTCTAAGGGAGGGGAACGAT CCACTGGGACCTAAAGCCG p21 TSS of expressed gene AGCAGGCTGTGGCTCTGATT CAAAATAGCCACCAGCCTCTTCT PUMA TSS of expressed gene GTGTGTGTGTCCGACTGTCCCG AAGGAGGACCCAGGCGCTGT Chr1 SAT Repetitive region TCATTCCCACAAACTGCGTTG TCCAACGAAGGCCACAAGA Chr4 SAT Repetitive region CTGCACTACCTGAAGAGGAC GATGGTTCAACACTCTTACA SAT1 Repetitive region GAACCTGTGTTGCTGCTTTG TTCAAAGGTACTCTGCTTGGTACA SAT2 Repetitive region TGAATGGAATCGTCATCGAA CCATTCGATAATTCCGCTTG NBL2 Repetitive region TCCCACAGCAGTTGGTGTTA TTGGCAGAAACCTCTTTGCT