HAL Id: inserm-00620920
https://www.hal.inserm.fr/inserm-00620920
Submitted on 19 Sep 2011HAL is a multi-disciplinary open access archive for the deposit and dissemination of sci-entific research documents, whether they are pub-lished or not. The documents may come from teaching and research institutions in France or abroad, or from public or private research centers.
L’archive ouverte pluridisciplinaire HAL, est destinée au dépôt et à la diffusion de documents scientifiques de niveau recherche, publiés ou non, émanant des établissements d’enseignement et de recherche français ou étrangers, des laboratoires publics ou privés.
Differential role for CD277 as a co-regulator of the
immune signal in T and NK cells.
Nassima Messal, Emilie Mamessier, Aude Sylvain, Javier Celis Gutierrez,
Marie-Laure Thibult, Bruno Chetaille, Guylène Firaguay, Sonia Pastor, Yves
Guillaume, Qian Wang, et al.
To cite this version:
Nassima Messal, Emilie Mamessier, Aude Sylvain, Javier Celis Gutierrez, Marie-Laure Thibult, et al.. Differential role for CD277 as a co-regulator of the immune signal in T and NK cells.. European Journal of Immunology, Wiley-VCH Verlag, 2011, 41 (12), pp.3443-54. �10.1002/eji.201141404�. �inserm-00620920�
Differential role for CD277 as co-regulator of the immune signal in T and NK cells
Nassima Messal1,2,3
, Emilie Mamessier1,2,3, *,**
, Aude Sylvain1,2,3, *,***
, Javier
Celis-Gutierrez1,2,3, Marie-Laure Thibult1,2,3, Bruno Chetaille1,2,3, Guylène Firaguay1,2,3, Sonia
Pastor1,2,3 , Yves Guillaume1,2,3 , Qian Wang1,2,3 , Ivan Hirsch1,2,3 , Jacques A. Nunès1,2,3 and Daniel Olive1,2,3 .
1Institut National de la Santé et de la Recherche Médicale, Unité 891, Centre de Recherche en
Cancérologie de Marseille, F-13009, Marseille, France ; 2Institut Paoli-Calmettes, F-13009,
Marseille, France ; 3Aix-Marseille Univ, F-13284, Marseille, France.
Key words: T cells, cell activation, costimulatory molecules, Butyrophilin
Address correspondence and reprint requests to Dr. Jacques Nunès or Pr. Daniel Olive, Centre de Recherche en Cancérologie de Marseille, IBiSA Cancer Immunomonitoring
Platform, 27 Bd Leï Roure, BP 30059, 13273 Marseille, FRANCE.
jacques.nunes@inserm.fr (Tel +33 491 75 84 14 / FAX +33 491 26 03 64) or daniel.olive@inserm.fr (Tel +33 491 75 84 15 / FAX +33 491 26 03 64)
List of abbreviations: BTN3, butyrophilin 3 ; MFI, mean fluorescence intensity ; aAPC,
artificial APC
* EM and AS: these authors contributed equally to this work.
** Present address: Centre d’Immunologie Marseille-Luminy (CIML), Parc Scientifique de
Luminy, 13288 Marseille, France.
*** Present address: Monash Immunology and Stem Cell Laboratories (MISCL), Monash
Summary
The human butyrophilin 3 (BTN3 or CD277) molecules belong to the B7 family members and
are expressed in various immune cells such as T cells and NK cells. Here, we show that
CD277 triggering considerably enhances TCR-induced cytokine production and cell
proliferation, even when another costimulatory molecule, CD28 is engaged. These
CD277-induced additive functional effects are in accordance with the detection of early T-cell
activation events such as TCR-induced cell signaling increased upon CD277 engagement.
However, we found that CD277 triggering is not involved in CD16 or NKp46-induced NK
cell activation. BTN3/CD277 comprises three structurally related members, BTN3A1,
BTN3A2 and BTN3A3. CD277 antibodies recognize all isoforms and we describe a
differential expression of BTN3 isoforms between T cells and NK cells that could explain
differential CD277 functions between T and NK cells. Our results show that while T cells
express all BTN3 / CD277 transcripts, NK cells express mostly BTN3A2, which lacks the
B30.2 intracellular domain. Furthermore, NKp30-induced cytokine production is decreased
by the specific engagement of BTN3A2, but not by BTN3A1 triggering. Thus, we provide
new insights into CD277 costimulatory pathway that may differentially participate in the
Introduction
The human butyrophilin (BTN) 3 (also known as CD277) molecules belong to the B7 family
members and are expressed in various immune cells such as T cells and NK cells [1]. The
molecules comprise three structurally related members, BTN3A1, BTN3A2 and BTN3A3 [2,
3]. Structurally, the butyrophilins are composed of an extracellular IgV-like domain, followed
by an IgC-like domain and a heptad repeated sequence [2-7]. Some BTNs harbor an
intracellular domain of 166 amino acids, named B30.2, presumably involved in intracellular
signal transduction, notably the BTN implied in the regulation of superoxide concentrations
[8, 9]. BTN3A1, 3A2 and 3A3 exhibit 95% identity and form a mono-phylogenetic group
along with the B7/BTN-related members [1]. However, only BTN3A1 and BTN3A3 display
the B30.2 signal transducing domain, whereas the BTN3A2 is a decoy receptor that does not
contain any intracellular domain.
High expression levels of BTN3 transcripts could be found in human lymphoid tissues,
mainly spleen, lymph node (LN) and peripheral blood lymphocytes (PBLs) [1]. Using
anti-CD277 monoclonal antibody, it was also demonstrated that BTN3A was expressed on most of
immune cells, including T and B lymphocytes, but also NK cells, monocytes, dendritic cells,
as well as hematopoietic precursors and some tumor cell lines [1]. Research on the
counter-receptor of BTN3A showed that neither CD28, CTLA-4, ICOS, PD-1 nor BTLA were
involved, and, except from some (but not all) acute T leukemia cell lines, was absent from
both resting and activated T cells.
Similar experiments were performed with BTN2A and showed that BTN2A mRNA was
expressed in most human tissues, but protein expression was significantly lower in
leukocytes. These experiments also revealed that a particular glycosylated-form of BTN2A1
involvement of the butyrophilin family as co-regulators of the immune system [10].
Furthermore, the binding of human BTN2A1 to DC-SIGN was also dependent on heavy
glycosylation of the receptor when expressed by tumor cells. In two recent studies, the
recombinant murine BTNL2 protein bound an unidentified receptor on B cells and T cells
[11], distinct from the known receptors of the B7 molecules [12]. Both groups demonstrated
that the activation of mouse T cells, through TCR engagement, was inhibited by the ligation
of BTNL2 with its putative receptor on T cells. Recently, a report proposed that BTN3A1 is
an additional coinhibitor receptor of T-cell activation [13]. However, the expression of
BTN3A1 on lymphocytes as well as on NK cells prompted us to investigate whether BTN3A1
was involved in the regulation of innate effectors (NK) as well as T lymphocytes ant to
explore the potential role of BTN3 (CD277) on the regulation of T lymphocyte and NK
activation. Our results show that CD277-triggering in CD4+
T cells considerably enhances
TCR-induced signaling, cytokine production and CD4+
T-cell proliferation. In contrast,
CD277 triggering is not involved in CD16 or NKp46-induced NK-cell activation. The
differential behaviour of CD277 in these two immune cell types prompt us to investigate the
Results
The CD277 co-engagement up-regulates TCR-induced cytokine production, but not NK
activating receptor-induced NK cell functions.
To identify possible differences at the protein level, the detection of CD277 surface
expression was performed on several T and NK differentiation subsets from healthy donors (n
= 4). Using multi-parametric flow cytometry, CD3+
CD4+
, CD3+
CD8+
and NK cell
populations were analyzed (see online supplemental informations, Fig. S1 & S2). The CD277
mAb staining with the CD277 mAb reveals a strong expression of CD277 in all cell types
CD4+
helper T cells, cytolytic CD8+
T cells and NK cells (Fig. S1B & S2B). Taken together,
CD277 is expressed on all subtypes of T cells in the peripheral blood as well as in lymph
nodes and also in NK cells, and its expression is not modulated after cell activation (Fig. S1 &
S2). This relative stability of the CD277 surface expression prompted us to further investigate
the potential action of the CD277 engagement in immune cells.
The role of CD277 engagement was investigated on TCR-induced cytokine production.
Purified CD4+
T cells from healthy donors were cultured during 24 to 72 h with CD3 + CD28
mAbs or CD3 + CD277 mAbs or CD3 mAb + IgG1 (control condition). After 24 h of culture,
IL-2 and IFN-! production by CD4+
T cells were measured by ELISA. As expected, these two
cytokines were secreted in large amounts after CD3 + CD28 stimulation by comparison with
the control condition (Fig. 1A: IL-2, 120 pg/ml, p = 0.0079, Fig. 1B: IFN-!, 7000 pg/ml, p =
0.0317). Although the IL-2 levels produced by the CD3 + CD277 co-activated CD4+
T cells
were lower than the 2 levels obtained with CD3 + CD28 co-stimulation, the quantity of
IL-2 induced by CD3 + CDIL-277 co-activation was significantly higher than that induced with the
enhanced by CD3 + CD277 co-activation (Fig. 1B: IFN-!, 9000 pg/ml, p = 0.0159) compared
to the control situation, and surprisingly, the production was even greater than that obtained
after CD3 + CD28 co-activation. A similar effect was obtained regarding the expression
profile of the activation marker CD25 under CD3 + CD277 co-stimulation (Fig. 1C).
Altogether, these results suggest that the CD277 molecule acts as a T cell costimulatory
molecule for cytokine production.
To investigate whether similar costimulatory effects are obtained in NK cells, CD107
expression under P815 redirected cytotoxicity (Fig. 1D) and IFN-! assays (Fig. 1E) were
performed. The NK cells are stimulated via two different activation receptors, CD16 or
NKp46 using specific mAbs, in presence of isotypic control, CD277 mAb, anti-DNAM
(positive control for a co-stimulation of the activation receptors) or anti-NKG2A (positive
control for a co-inhibition of the activation receptors). The CD277 triggering alone did not
induce any effect on NK cell stimulation. Moreover, at the contrary of DNAM
(co-stimulation) or NKG2A (co-inhibition), the CD277 engagement fails to modulate CD16 or
NKp46-induced NK cell activation, both for degranulation as evaluated by CD107 a&b
staining and IFN-! secretion. These results show that CD277 is not involved in the regulation
of NK cell activation, contrary to what was observed with T cells.
The CD277 co-engagement up-regulates TCR-induced early signaling events in CD4+
T
cells.
These BTN3/CD277-mediated positive signals shown in T cell cytokine production (Fig.
1A&B) are not in accordance with a previous work where another CD277 mAb clone has
been used [13]. To further test the robustness of our results, we investigate the capacity of the
CD277 triggering to regulate TCR-induced early T cell events such as signaling pathways.
signaling pathways such as PI3K/Akt and MAP kinases (ERK-1/2) involved in T cell
functions including cytokine production, proliferation and regulation of apoptosis [14]. To
investigate the co-stimulatory role of CD277 in T cell signaling, CD3 mAb versus CD3 +
CD277 mAbs coated beads were used to stimulate CD4+
T cells and phosphoflow analysis
was performed. CD4+
T cells were stimulated with mAbs coated beads for various periods of
time (Fig. 2). An induction of Akt and ERK-1/2 phosphorylation using CD3 mAb coated
beads was detected specially at late time points such as 30 min (Fig. 2A&B). These
TCR-induced phosphorylation events were enhanced when a combination of CD3 plus CD277
mAbs were used. Moreover, this CD277 costimulation revealed phosphorylation events as
early as 2 min after stimulation (Fig. 2B). These results show that CD277 stimulation is
involved in the regulation of T cell signaling induced by the TCR-CD3 complex.
As the CD28 molecule is known to be a potent costimulator of TCR-induced signaling events
in primary T cells [15], the role of CD277 was analyzed in the modulation of an optimal (CD3
+ CD28)-induced T cell stimulation. Purified CD4+
T cells were stimulated with various
concentrations of mAbs against CD277 (from 5 to 17 µg/ml) or isotype control IgG1, together
with anti-CD3 plus anti-CD28 for different periods of time (2, 5, 10 and 30 min) (Fig. 2). The
CD277 cross-linking strongly increases the phosphorylation of Akt and ERK-1/2 induced by
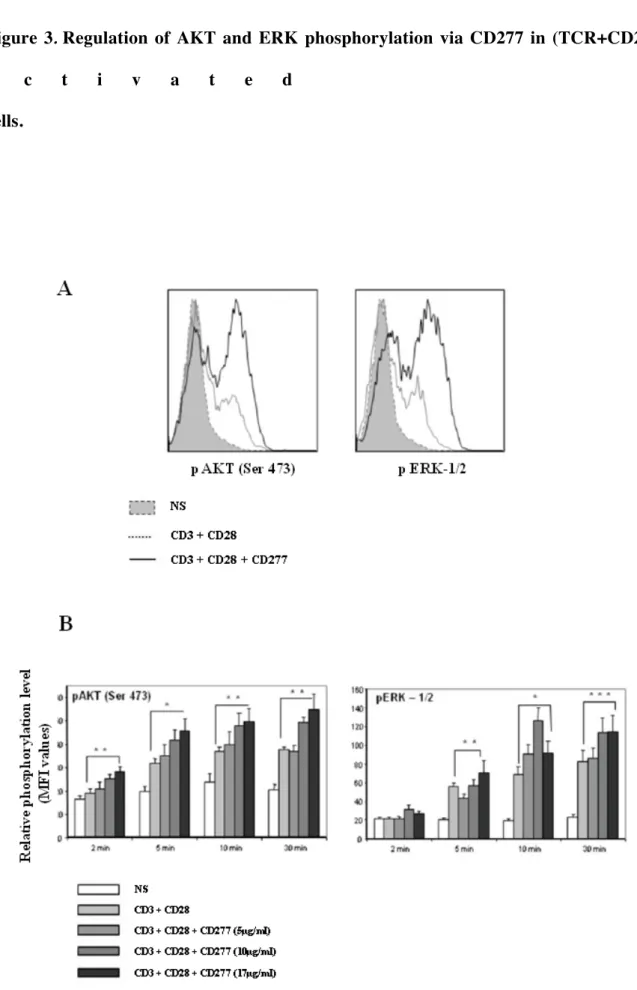
CD3 + CD28 stimulation (Fig. 3A&B). This effect was dose and time dependent (Fig. 3B).
Hence, we thus demonstrated that CD277 triggering potentialize the TCR signal as expected
for a costimulatory signal and that it further enhanced the cosignals provided by CD28. We
next decided to investigate the functional consequences of the activation of these signaling
The CD277 engagement further enhances CD3+CD28 costimulation to enhance T cell
proliferation and cytokine production.
To investigate the CD277 cosignaling effects on T cell proliferation and cytokine production
induced by CD3 + CD28 costimulation, CD4+
T cells were stimulated with various
concentrations of CD277 mAb (from 5 to 17 µg/ml), together with CD3 plus CD28 mAbs
(Fig. 4). The amount of mAbs able to bind on the beads stays equal along the stimulation
conditions by adding IgG1 isotype control and anti-MHC classI (MHC I). The proliferation
was evaluated by measuring the dilution of CFSE cytosolic dye in stimulated CD4+
T cells
(Fig. 4A). The CD277 cross-linking on CD4+
T cells strongly activates CD4+
T cell
proliferation mediated by CD3 plus CD28 mAbs in a dose-dependent manner. Among the
CD3+CD28 stimulated, only 60% of these cells are divided at day 5 (Fig. 4C). The CD277
mAb cross-linking strongly enhances CD4+
T cell division already induced by CD3 plus
CD28 mAbs in a dose-dependent manner, such as 90% of cells are divided (Fig. 4C). In
parallel, our results also showed that the engagement of CD277 increased the proliferation
(Fig. 4B) and the secretion of cytokines induced by CD3 + CD28 stimulation in a
dose-dependent manner (Fig. 4D). Altogether, these data support a role of costimulatory molecule
for CD277 even after optimal costimulation provided by CD28.
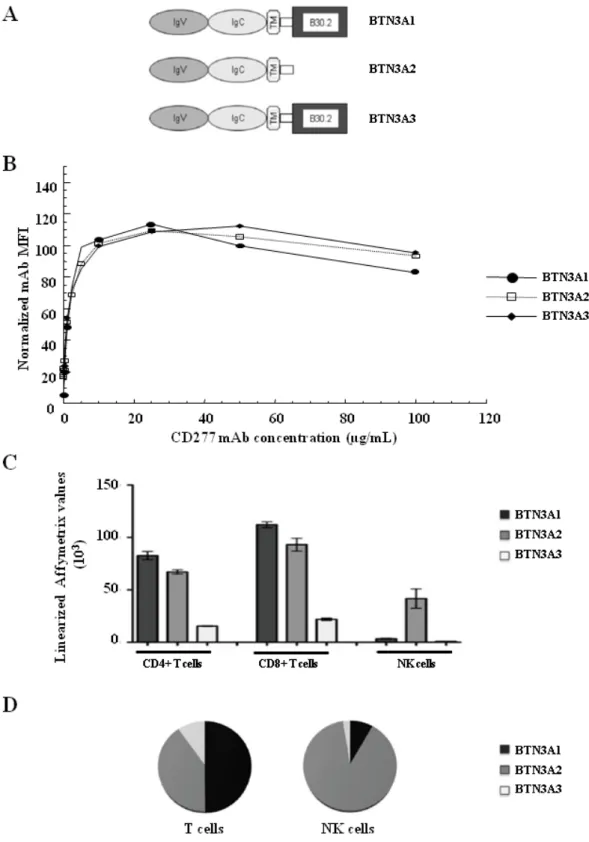
CD277 transcripts are differentially expressed in T and NK cells.
The CD277 molecule is expressed in both T and NK cells [1, 13] (Fig. S1&S2). CD277 has
three isoforms btn3a1, btn3a2 and btn3a3, with (btn3a1 and btn3a3), or without (btn3a2) the
B30.2 domain in their cytoplasmic part [5] (Fig. 5A). The used mAb (clone 20.1) does not
discriminate between the Ig domains of the three btn3a isoforms, which share a very high
different isoforms expressed in an ectopic cellular model (Fig. 5B). Quantitative PCRs were
performed to determine the different relative levels of mRNA expression for each isoform in
T and NK cells isolated from human PBMCs (Fig. 5C). Both btn3a1 and btn3a2 represented
the main forms expressed by CD4+
and CD8+
T-cell subsets whereas the decoy form, btn3a2
was the unique form strongly expressed on NK cells (Fig. 5C&D). Btn3a3 is poorly expressed
in these immune cells. These results are further confirmed using available data from GEO
omnibus (data not shown).
The two CD277 isoforms, BTN3A1 and BTN3A2 regulate differentially the
NKp30-induced IFN-! production in a NK cell line.
To identify a role for these two major CD277 isoforms (Fig. 5D), the KGHYG-1 NK cell line
has been nucleofected with constructs encoding for FLAG epitope tagged-BTN3A1 or
BTN3A2. This cell line is expressing the Natural Cytotixicity Receptor, NKp30 and a
stimulation of this receptor by specific antibodies is able to induce an IFN-! production in this
NK cell line (data not shown). The overexpression of the BTN3 isoforms is monitored by an
anti-FLAG mAb cell surface staining (Fig. 6A). The transiently transfected NK cells were
stimulated by anti-NKp30 and/or anti-FLAG mAbs, and the IFN-! production is assessed by
FACS analysis (Fig. 6B). The NKp30 stimulation, but not BTN3A1 or BTN3A2 triggering
alone, induces IFN-! production. However, a co-engagement of NKp30 with a CD277
isoform, modulates the NKp30-induced IFN-! production. BTN3A1 stimulation seems to
increase this cytokine production, whereas BTN3A2 stimulation decreases the
NKp30-induced IFN-! production. These results suggest a differential functional role of these two
Discussion
In this study, we describe differential effects of the CD277 molecule as a co-regulator of the
immune signal in T cells but not in NK cells (Fig. 1). There is no effect noted on NK cells
consistent with the selective expression of the BTN3A2 isoform that lacks much of the
cytosolic domain (Fig. 5). However, in the context where only the BTN3A2 isoform is
co-engaged, this molecule could induce some negative signals in NK cells (Fig. 6).
CD277 cross-linking elicits a robust costimulation of T cell proliferation, cytokine production
and CD25 expression. We showed that the stimulation of BTN3/CD277 proteins with a
home-made mAb (clone 20.1, [1]) increases in a dose-dependent manner, the rates of early and late
T-cell activation events induced by a combination of CD3 plus CD28 mAbs (Fig. 3 & 4). The
experiments were performed using both mAbs coated on microplates or on epoxy beads
together with CD3 +/- CD28 mAbs. This protocol has been calibrated in our hands to be very
efficient for analyzing costimulation and coinhibition properties. For instance, we reported a
strong coinhibition function of PD-1/CD279 and BTLA/CD272 molecules in CD4+
human T
cells via similar experiments [16]. To exclude the possible artifact that the CD277 mAbs are
acting as adhesion molecules, facilitating T cell -aAPCs (mAb-coated beads) interactions,
anti-MHC class I mAbs have been used as control (Fig. 4C) showing that CD277-mediated T
cell division enhancement is not due to a simple adhesion process.
A negative regulation of T-cell activation using another mAb against BTN3 proteins (clone
232-5), has been reported [13]. Both mAbs (20.1 and 232-5) recognize overlapping but not
identical epitope of BTN3 molecule and belong to the different murine IgG classes [13].
While 20.1 exhibits an equal binding to the three BTN3 isoforms (Fig. 5B), recognition of
BTN3A1 and BTN3A2 by 232-5 mAb is not known. An additonal difference might stand at
using CD277 mAbs coated on beads together with CD3 +/-CD28 mAbs. These bead-based
aAPCs enable the most efficient reported growth of human CD4+
T cells and permit to
develop a useful tool to monitor the receptor signaling pathways for T cell activation [17].
Slightly different conditions used by Yamashiro et al. [13] might be less optimal to provide
costimulation. Moreover, CD277 has been recently reported to be a cosignaling molecule in
another immune cell type, the dendritic cells, by using the CD277 mAb (clone 20.1) [18].
Recently, CD277 expression at the surface of aAPCs (K32 cell line) has been reported to
induce an impaired TCR-induced cell proliferation, suggesting that a counter-receptor at the T
cell surface will act as an inhibitory receptor [19]. Altogether, the identification of the
putative BTN3 ligand(s) will help to further investigate the biology of the CD277 molecule in
the immune system. Using BTN3A1-Fc fusion proteins, we found that a BTN3 ligand is
expressed on various tumor cell lines and endothelial cells [1]. However, we do not know if
the BTN3A1-Fc protein binds one or multiple ligands that might upon BTN3 binding elicit
distinct signals.
In order to understand the differences observed in our study between T cells and NK cells, we
compared the mRNA isoforms of btn3 expressed by T cells and NK cells. We found that
btn3a1 is the main form expressed by T cells whereas the decoy form, btn3a2 is mostly
expressed on NK cells (Fig. 5). This result can explain the absence of co-stimulation in
response to CD277 stimulation of NK cells. The three genes are expressed in most tissues
including cancer cells (http://ist.genesapiens.org) indicating that numerous subsets of cells
that might be regulated by CD277. Surprisingly, when we compared the expression on
immune cells, most expressed the three isoforms except NK cells in which the btn3a2 isoform
was almost exclusively detected (Fig. 5 and data not shown). The three CD277 isoforms
share more than 95% identity in their extra-cellular domain but differ dramatically in the
and BTN3A3 correspond to 242, 65 and 315 amino acid respectively. BTN3A1 and BTN3A3
possess a B30.2 (or PRY/SPRY) domain, a module that mediates diverse functions in at least
11 categories of human molecules/receptors by binding to targets through an interface
resembling that of an antibody [9]. The presence of a B30.2 domain on the tripartite motif
(TRIM) proteins, including TRIM5", is important for the antiviral activity of these proteins
[20]. By contrast, the B30.2 domain is not present in the BTN3A2 isoform. Based on our data obtained in NK cells (Fig. 1), BTN3A2 could be a putative decoy receptor, devoid of
cosignaling function in NK cells, when compared to two well know costimulatory (DNAM-1)
and coinhibitory (NKG2A) molecules. However, when NKp30 is co-engaged with BTN3A2
(but not the other isoforms), BTN3A2 is able to induce some negative signals in NK cells
(Fig. 6). The cytoplasmic part of BTN3A2 contains 65 amino acids, but no identified
signaling motif is found in this peptide sequence. For BTN3A1, it is possible to investigate
intracellular signalling as the cytoplasmic part of BTN3A1 contains a B30.2 domain. Some
intracellular proteins have been described to interact with the B30.2 domain of a BTN family
member, such as the xanthine oxidoreductase that binds to the B30.2 domain of BTN1A1.
These interactions are involved in the BTN1A1 functions in the mammary gland and it has
been speculated that these interactions could occur in immune cells [21]. Actually, the
potential partners of the B30.2 domain of BTN3A1 and/or BTN3A3 are still unknown. The
identification of these B30.2 interactors will be necessary to dissect the immunoregulatory
mechanims associated with the engagement of BTN3/CD277 molecule at the surface of T
cells versus NK cells.
Smith et al. demonstrated that BTN1A1 and BTN2A2 –Fc fusion proteins bound to activated
T cells [22]. Immobilized BTN1A1 and BTN2A2 –Fc fusion proteins inhibit the proliferation
of murine CD4+
and CD8+
T cells activated by CD3 mAbs. Hence, they bind to ligands that
molecules should act as ligand for receptors(s) present on activated T cells that will regulate
their function. In addition to our results, there is a growing body of literature on these BTN
family members that suggests that when the BTN counter-receptors are discovered, they may
constitute a huge immunoregulatory network such as the CD28/B7 family. These pathways
are likely to be major receptors in immune responses and also the inflammatory reaction.
In conclusion, CD277/BTN3 proteins should be also considered as positive
immunomodulators in T-cell responses. An elegant mechanism to directly modulate these
effects for an immune cell would be to differentially regulate the expression of the BTN3
isoforms. Altogether, these results are the basis of new investigations on defining the nature
of extracellular and intracellular ligands of the CD277 molecule.
Materials and Methods
Human T cell isolation
Peripheral blood mononuclear cells (PBMCs) wereobtained from healthy volunteer donors
provided by the “Etablissement Français du Sang” (EFS, Marseilles, France) and isolated by
fractionation over adensitygradient of Lymphoprep© (Abcys). Human CD4+
T cells were
negatively selected from isolated PBMCs by depletion of non-CD4+
T cells with magnetic
beads using the T cell isolation kit II from Miltenyi Biotec®. Isolated CD4 cells were used for
further experiments when purity was superior to 90%.
Expression profile of CD277 on T cells subpopulations
PBMCs from healthy donors were stained with 5 µl of the following mouse anti-human mAbs
per million of cells: ECD-conjugated anti-CD3, PC5-conjugated anti-CD14, PC5-conjugated
anti-CD19 (to select CD3+
CD14-
CD19
cells) (all from Beckman Coulter, Marseilles,
Pharmingen, San Diego, CA, USA), APC-Alexa750-conjugated anti-CD27 (Caltag,
Invitrogen, USA), PC7-conjugated anti-CD45RA (BD Biosciences), Alexa647-conjugated
anti-CD277 (clone 20.1, IgG1) [1]. The CD277 mAb (clone 20.1) was labeled with Alexa
Fluor 647 using a commercial kit (Invitrogen, Paisley, UK). APC-conjugated IgG1 (Beckman
Coulter) was used as negative control and LIVE/DEAD Fixable Dead Cell Stain Kit was used
for viability. Cells were incubated 20 min at 4°C, then washed twice in PBS fixed with 2%
paraformaldehyde, and analyzed by a FACSAria flow cytometer (BD Biosciences). Data were
analyzed using FlowJo Software (TreeStar, Ashland, OR).
Kinetics of CD277’s expression profile on naive CD4+
T cells
Purified CD4+
T cells (2 # 105
cells/well) from thawed human PBMCs were cultured during 96
h in RPMI 1640 10% FBS in flat bottom 96-well plates (MicrotestTM
96, Becton Dickinson)
which have been previously incubated with CD3 mAb (clone OKT3) plus CD28 mAb (clone
CD28.2) [23] or isotypic control (IgG1). Anti-CD3 (and anti-CD28 mAbs were used at 0.3
µg/ml and 10 µg/ml respectively. Cells were placed into an atmosphere of 5% CO2 at 37°C in
a humidified incubator. Every 24 h, cells were transferred in a conic bottom 96-well plate
(NuncTM
, Denmark) and stained for 30 min at 4°C with 3 µl of purified anti-1 (clone
PD-1.3.1) [24] , washed 3 times in PBS- FBS 0.2%- NaN3 0.02%, then stained with
PE-conjugated goat anti-mouse (1/80, Beckman Coulter), washed and stained with 3 µl of each of
PC7-conjugated anti-CD4, FITC-conjugated anti-CD3 (all from BD Biosciences)
Alexa647-conjugated anti-CD277 and 6 µl of 7-AAD (BD Biosciences) for 30 min at 4°C. Purified
IgG1 and APC-conjugated IgG1 were used as controls. Immunostained cell samples fixed
with 2% paraformaldehyde were analyzed on a BD FACS Canto (BD Biosciences). Data were
Expression of CD277 in lymph nodes
Mononuclear cells were obtained from lymph nodes by crushing fresh tissue samples in
RPMI 1640 10% FBS. Detection of Follicular T Helper (TFH) cells was performed by
incubation for 20 min at 4°C with PE-conjugated anti–ICOS, biotinylated anti–CXCR5 (all
from BD Biosciences), PC5-conjugated anti-CD14, Pacific blue-conjugated anti–CD4 (all
from Beckman Coulter) and LIVE/DEAD Fixable Dead Cell Stain Kit©. Cells were then
washed in PBS and incubated with anti–biotin–allophycocyanin–Alexa Fluor 750 (Invitrogen,
Carlsbad, CA) for 20 min at 4°C. After staining, each cell preparation was washed twice in
PBS, fixed with 2% paraformaldehyde, BD FACS Canto (BD Biosciences). Data were
analyzed using FlowJo Software (TreeStar, Ashland, OR).
Functional assays on CD4+ T cells using plate-immobilized mAbs
Purified CD4+
T cells (2 # 105
cells/well) from thawed human PBMCs were cultured in RPMI
1640 10% FBS in flat bottom 96-well plates (MicrotestTM
96, BD Biosciences), which had
been previously incubated with mouse anti-human CD3 (clone OKT3)/CD28 (clone CD28.2)
[23] or CD3/CD277 (clone 20.1) or CD3/isotypic control (IgG1). Purified
anti-CD3 was used at 0.3 µg/ml. Anti-CD28, anti-CD277 and isotypic control were used at 10
µg/ml. Cells were placed into an atmosphere of 5% CO2 at 37°C in a humidified incubator.
After 2 days of culture, cytokine production (IL-2 and IFN-!) was measured by ELISA assay
according to the manufacturer’s protocol (OptEIA, human IFN-! or IL-2 Set, BD
Pharmingen). After 5 days, cells were stained with 3 µl of PE-conjugated anti-CD25 (BD
Biosciences), and 5 µl of 7-AAD for 30 min at 4°C then washed twice in PBS, fixed with 2%
paraformaldehyde and analyzed on a BD FACS Canto (BD Biosciences). Data were analyzed
Functional assay on CD4+ T cells with artificial APCs (aAPCs) and carboxyfluorescein
diacetate succinimidyl diester (CFSE) labeling
Human CD4+ T cells were purified by negative selection from PBMCs using magnetic beads
(Miltenyi Biotec) according to the manufacturer’s protocol. CD4 T cells were routinely more
than 97% pureCD4+ T cells were labeled with 0.5 µM CFSE (Invitrogen) for 10 min at 37°C,
washed and stimulated (1.5 # 105
cells/well) with aAPCs at a ratio of 1:1 (cells to beads) in
triplicate in 96-well round-bottom plates (Falcon; BD Biosciences). As described previously
[16], magnetic beads (Dynabeads M-450 Epoxy, Dynal Biotech) were coated with the
following mAbs : anti-CD3 (clone OKT3), anti-CD28 (clone CD28.2), and/or various
concentrations of anti-CD277 (clone 20.1) or anti-MHC class I (MHC I) (clone YJ4) or IgG1
control. These aAPCs were coated with suboptimal CD3 mAb (5%), suboptimal levels of
CD28 mAb (10%), and either IgG1 Ab (CD3/CD28/IgG1), CD277 mAb (CD3/CD28/CD277
+ IgG1) or anti-MHC class I (CD3/28/MHC I + IgG1), constituting the remaining 85% of
protein added to the bead. The amount of protein was kept constant at 20 µg/ml by the
addition of control IgG1. Cultures were incubated at 37°C, 5% CO2 for 5 days and then
proliferation of CFSE labeled CD4+
T cells were measured by flow cytometry (FACS Canto,
Beckman Coulter).
Functional assay on NK cells, cytolytic activity
Fresh NK cells were sorted with Easy Sep® negative selection kit and incubated over night in
medium completed with sub-optimal concentrations of IL-2 (100 U/ml) and IL-15 (10 ng/ml).
NK cell receptors functions were tested in re-directed cytolytic experiments against the
FcR!-positive P815 mastocytoma murine cell line. Briefly, effector cells were incubated with P815
cells pre-coated for 30 minutes with the mAb of interest (irrelevant mouse IgG1: 11 µg/ml,
Biosciences): 5 µg/ml, anti-NKG2A (clone 131411, R&D Systems): 5 µg/ml, anti-CD277
20.1: 10 µg/ml) according to a 1:1 effector:target (E/T) ratio. Similar stimulation conditions
have been used with the CD16 mAb (clone 3G8, BD Biosciences). Cytotoxic tests were
performed in 4-hours assays in the presence of GolgiStop® and soluble FITC-labeled CD107
(a&b) mAbs (both from BD Biosciences), then the cells were stained for surface markers
(PeCy7-CD56 (Beckman Coulter, Immunotech), fixed and permeabilized
(Cytofix/Cytoperm®) then stained with anti- IFN-! mAb (Beckman Coulter, Immunotech).
Cells were finally re-suspended in PBS 2% para-formaldehyde and extemporaneously
analyzed on a BD FACS Canto® (BD Biosciences, San Jose, CA). The degree of activation
of NK cells was measured based on the percentage of cells positive for CD107 a&b
(degranulation) and/or the production of inflammatory cytokine (IFN-!).
Measurements of cytokine production
To determine the production of cytokines, cell-free supernatants were collected at 48 h and
assayed for IL-2 and IFN-! by ELISA using OptEIA kits (BD Pharmingen) according to the
manufacturer’s instructions. After 8 h of transfection, KGHYG-1 cells were incubated with
plate-bound mAbs in a 96-well plate. For NKp30 and/or CD277 isoform stimulation,
anti-FLAG mAb was preadsorbed at 4 µg/100 µl/well and anti-NKp30 mAb at 1 µg/100 µl/well.
Upon 4 h of stimulation, intracellular IFN-! stainings are performed with a PE-labelled
specific Ab (Beckman Coulter).
Plasmid contructs and cell line tranfections
The construct p3XFlagBTN3A1 (BTN3A1) corresponding to the wild-type full-length human
BTN3A1 cDNA deleted from its signal peptide sequence and tagged with 3x Flag epitope in
(cDNA clone IRCMp5012H1242D, Source BioScience LifeSciences, Nottingham, UK) into
the p3xFLAG-myc-CMV-25™ vector (SIGMA Life Science), using the restriction sites
EcoRI/XbaI. The construct p3XFlagBTN3A2 (BTN3A2) corresponding to the wild-type
full-length human BTN3A2 cDNA deleted from its signal peptide sequence and tagged with 3x
FLAG epitope in the 5’ end, was generated by subcloning of pOBT7 vector containing
BTN3A2 (cDNA clone IRAUp969E0222D, Source BioScience LifeSciences, Nottingham,
UK) into the p3xFLAG-myc-CMV-25™ vector, using the restriction sites EcoRI/XbaI. The
construct p3XFlagBTN3A3 (BTN3A3) corresponding to the wild-type full-length human
BTN3A3 cDNA deleted from its signal peptide sequence and tagged with 3x FLAG epitope
in the 5’ end, was generated by subcloning of pOTB7 vector containing BTN3A1 (cDNA
clone IRAUp969E1250D, Source BioScience LifeSciences, Nottingham, UK) into the
p3xFLAG-myc-CMV-25™ vector, using the restriction sites EcoRI/XbaI. To exclude the
Myc tag expression at the carboxy-terminal part of BTN3 isoforms, a stop codon has been
introduced at the 3' end of BTN3Ax sequences.
2 x 10⁶
COS-7 cells seeded in 100-mm plates were transfected with 5 µg p3xFlagBTN3Ax
contructs using 15 µl of FuGENE 6 Transfection Reagent (Roche). The human NK cell line,
KHYG-1 is growing in RPMI 1640 medium supplemented with 20% FCS and 450 UI/ml
rIL-2 [rIL-25]. 5 x 10⁶
KHYG-1 cells were transfected with 2 µg p3xFlagBTN3Ax contructs using the
Amaxa™ Nucleofector™ Technology (Solution T, program Y-001) (Lonza Cologne AG).
Screening of the different btn3a isoforms transcripts in PBMC from healthy subjects.
Public and home-made Affymetrix U133+2 data sets of purified CD4, CD8 and, NK cells
were collected. CD8 and CD4 data were retrieved from the public GEO datasets [26]
(http://www.ncbi.nlm.nih.gov/gds), while NK sets were personal. We used Robust Multichip
RMA was applied to the raw data collected from the various series. Quantile normalization
and Loess’ correction were done in R using Bioconductor and associated packages. The probe
set corresponding to the three isoforms of BTN3A was retrieved from the normalized data
sets and the corresponding log values were linearized for graphical representation. We used
the respective Affymetrix probesets corresponding to BTN3A1, BTN3A2 and BTN3A3
isoforms : STP201623_s_at, 213282_at, 204171_at.
Phosphoflow by FACS analysis
Human CD4+
T cells were purified by negative selection fromPBMCs using magnetic beads
(Miltenyi Biotec) according to the manufacturer’sprotocol. CD4+
T cells were routinely more
than 97% pure. Cells were incubated 24 h in RPMI 1640 10% FBS at 37°C. CD4+
T cells
were washed with PBS 1% FCS and stimulated with aAPC at a ratio of 1:3 (cells to beads)
comprised of magneticbeads (Dynabeads M-450 Epoxy, Dynal Biotech) coated with
anti-CD3, anti-CD28 and/or anti-CD277 mAbs as described above. The contacts between cells
(106
in 50 µl) and beads (3 x 10⁶
in 30 µl) are performed at 37°C in water bath for different
times (2, 5, 10 and 30 min) in PBS 1% FCS.
Phosphoflow analysis was performed by cytometry as previously described [27]. Briefly, cells
were fixed and permeabilized, incubated with anti-phospho-Akt S473 (# 4058, Cell Signaling
Technology) or anti-phospho-ERK-1/2 T202/Y204 (# 4377, Cell Signaling Technology)
antibodies and appropriate biotinylated secondary antibodies. Finally, revelation was
performed using Streptavidin-phycoerythrin solution (#IM3325, Beckman Coulter).FACS
data were acquired on a FACSCanto flow cytometer (BD Biosciences) using Diva software.
FACS data were analyzed using Flowjo software (TreeStar, Ashland, OR).
All data were analyzed using GraphPad Prism version 5.00 for (GraphPad, San Diego, CA)
and Microsoft Excel (Microsoft Office). The Mann-Whitney test matched nonparametric test
was used to examine: the variations of CD277 and PD-1 expression from lymphoid tissue on
living T lymphocyte subsets (in Fig. 1, Fig. S1 & S2), the variation of Akt and ERK
phosphorylation levels on CD277 stimulated T lymphocyte cells (in Fig. 2-3), and the
difference of secretion of cytokines on T cells (in Fig. 1 & 4). The comparisons were made
between different conditions of stimulation. The Wilcoxon paired test was used to compare
between different conditions of stimulation on NK cells (in Fig. 1). Differences were
Acknowledgements
We would like to thank Pr. Eric Vivier for providing some NK cell reagents, Eloïse Perrot and
Florence Orlanducci for their technical help. This work was supported by grants from Institut
National de la Santé et de la Recherche Médicale and the Institut National du Cancer (#
PL-06026 and # INCa/DHOS 2009) (to J.A. Nunès). N. Messal was supported by fellowships
from Bourse Franco-Algérienne and Ligue Nationale contre le Cancer. E. Mamessier was
supported by a fellowship from the Association pour la Recherche contre le Cancer. J. Celis
Gutierrez was supported by a fellowship from a joined program FUNDAYACUCHO
(Bolivarian Republic of Venezuela) / CNOUS (France). M-L. Thibult was supported by
fellowships from the Ministère de l'Enseignement Supérieur et de la Recherche and the Ligue
Nationale contre le Cancer. Y. Guillaume was supported by a fellowship from the Institut
National du Cancer. Q. Wang was supported by a postdoctoral fellowship from the Fondation
Infectiopole Sud.
Bibliography
1 Compte, E., Pontarotti, P., Collette, Y., Lopez, M. and Olive, D., Frontline:
Characterization of BT3 molecules belonging to the B7 family expressed on immune
cells. Eur J Immunol 2004. 34: 2089-2099.
2 Henry, J., Ribouchon, M., Depetris, D., Mattei, M., Offer, C., Tazi-Ahnini, R. and
Pontarotti, P., Cloning, structural analysis, and mapping of the B30 and B7 multigenic families to the major histocompatibility complex (MHC) and other
chromosomal regions. Immunogenetics 1997. 46: 383-395.
3 Tazi-Ahnini, R., Henry, J., Offer, C., Bouissou-Bouchouata, C., Mather, I. H. and
Pontarotti, P., Cloning, localization, and structure of new members of the butyrophilin gene family in the juxta-telomeric region of the major histocompatibility
complex. Immunogenetics 1997. 47: 55-63.
4 Henry, J., Ribouchon, M. T., Offer, C. and Pontarotti, P., B30.2-like domain
proteins: a growing family. Biochem Biophys Res Commun 1997. 235: 162-165.
5 Rhodes, D. A., Stammers, M., Malcherek, G., Beck, S. and Trowsdale, J., The
cluster of BTN genes in the extended major histocompatibility complex. Genomics
2001. 71: 351-362.
6 Ogg, S. L., Weldon, A. K., Dobbie, L., Smith, A. J. and Mather, I. H., Expression
of butyrophilin (Btn1a1) in lactating mammary gland is essential for the regulated
secretion of milk-lipid droplets. Proc Natl Acad Sci U S A 2004. 101: 10084-10089.
7 Robenek, H., Hofnagel, O., Buers, I., Lorkowski, S., Schnoor, M., Robenek, M. J.,
Heid, H. et al., Butyrophilin controls milk fat globule secretion. Proc Natl Acad Sci
U S A 2006. 103: 10385-10390.
8 Ishii, T., Aoki, N., Noda, A., Adachi, T., Nakamura, R. and Matsuda, T.,
150-kDa protein of mammary epithelial cells and milk fat globule membrane. Biochim
Biophys Acta 1995. 1245: 285-292.
9 Henry, J., Mather, I. H., McDermott, M. F. and Pontarotti, P., B30.2-like domain
proteins: update and new insights into a rapidly expanding family of proteins. Mol
Biol Evol 1998. 15: 1696-1705.
10 Malcherek, G., Mayr, L., Roda-Navarro, P., Rhodes, D., Miller, N. and
Trowsdale, J., The B7 homolog butyrophilin BTN2A1 is a novel ligand for DC-SIGN. J Immunol 2007. 179: 3804-3811.
11 Nguyen, T., Liu, X. K., Zhang, Y. and Dong, C., BTNL2, a butyrophilin-like
molecule that functions to inhibit T cell activation. J Immunol 2006. 176: 7354-7360.
12 Arnett, H. A., Escobar, S. S., Gonzalez-Suarez, E., Budelsky, A. L., Steffen, L. A.,
Boiani, N., Zhang, M. et al., BTNL2, a butyrophilin/B7-like molecule, is a negative costimulatory molecule modulated in intestinal inflammation. J Immunol 2007. 178:
1523-1533.
13 Yamashiro, H., Yoshizaki, S., Tadaki, T., Egawa, K. and Seo, N., Stimulation of
human butyrophilin 3 molecules results in negative regulation of cellular immunity. J
Leukoc Biol 2010. 88: 757-767.
14 Acuto, O. and Cantrell, D., T cell activation and the cytoskeleton. Annu Rev
Immunol 2000. 18: 165-184.
15 Appleman, L. J., van Puijenbroek, A. A., Shu, K. M., Nadler, L. M. and
Boussiotis, V. A., CD28 costimulation mediates down-regulation of p27kip1 and cell cycle progression by activation of the PI3K/PKB signaling pathway in primary human
T cells. J Immunol 2002. 168: 2729-2736.
16 Serriari, N. E., Gondois-Rey, F., Guillaume, Y., Remmerswaal, E. B., Pastor, S.,
CMV-specific T cells during infection and regulates their function. J Immunol 2010.
185: 3140-3148.
17 Levine, B. L., Bernstein, W. B., Connors, M., Craighead, N., Lindsten, T.,
Thompson, C. B. and June, C. H., Effects of CD28 costimulation on long-term proliferation of CD4+ T cells in the absence of exogenous feeder cells. J Immunol
1997. 159: 5921-5930.
18 Simone, R., Barbarat, B., Rabellino, A., Icardi, G., Bagnasco, M., Pesce, G.,
Olive, D. and Saverino, D., Ligation of the BT3 molecules, members of the B7 family, enhance the proinflammatory responses of human monocytes and
monocyte-derived dendritic cells. Mol Immunol 2010.
19 Cubillos-Ruiz, J. R., Martinez, D., Scarlett, U. K., Rutkowski, M. R., Nesbeth, Y.
C., Camposeco-Jacobs, A. L. and Conejo-Garcia, J. R., cd277 is a Negative Co-stimulatory Molecule Universally Expressed by Ovarian Cancer Microenvironmental
Cells. Oncotarget 2010. 1: 329-338.
20 Stremlau, M., Perron, M., Welikala, S. and Sodroski, J., Species-specific variation
in the B30.2(SPRY) domain of TRIM5alpha determines the potency of human
immunodeficiency virus restriction. J Virol 2005. 79: 3139-3145.
21 Jeong, J., Rao, A. U., Xu, J., Ogg, S. L., Hathout, Y., Fenselau, C. and Mather, I.
H., The PRY/SPRY/B30.2 domain of butyrophilin 1A1 (BTN1A1) binds to xanthine oxidoreductase: implications for the function of BTN1A1 in the mammary gland and
other tissues. J Biol Chem 2009. 284: 22444-22456.
22 Smith, I. A., Knezevic, B. R., Ammann, J. U., Rhodes, D. A., Aw, D., Palmer, D.
B., Mather, I. H. and Trowsdale, J., BTN1A1, the mammary gland butyrophilin, and BTN2A2 are both inhibitors of T cell activation. J Immunol 2010. 184: 3514-3525.
23 Nunes, J., Klasen, S., Ragueneau, M., Pavon, C., Couez, D., Mawas, C., Bagnasco,
M. and Olive, D., CD28 mAbs with distinct binding properties differ in their ability to induce T cell activation: analysis of early and late activation events. Int Immunol
1993. 5: 311-315.
24 Ghiotto, M., Gauthier, L., Serriari, N., Pastor, S., Truneh, A., Nunes, J. A. and
Olive, D., PD-L1 and PD-L2 differ in their molecular mechanisms of interaction with PD-1. Int Immunol 2010. 22: 651-660.
25 Yagita, M., Huang, C. L., Umehara, H., Matsuo, Y., Tabata, R., Miyake, M.,
Konaka, Y. and Takatsuki, K., A novel natural killer cell line (KHYG-1) from a patient with aggressive natural killer cell leukemia carrying a p53 point mutation.
Leukemia 2000. 14: 922-930.
26 Sharp, A. J., Hansen, S., Selzer, R. R., Cheng, Z., Regan, R., Hurst, J. A.,
Stewart, H. et al., Discovery of previously unidentified genomic disorders from the duplication architecture of the human genome. Nat Genet 2006. 38: 1038-1042.
27 Firaguay, G. and Nunes, J. A., Analysis of signaling events by dynamic
Figure legends
(A and B) CD4+
T cells were stimulated by plate-immobilized anti-CD3 (0.3 µg/ml), together
with 10 µg/ml of anti-CD28 or anti-CD277 mAbs, or isotypic control (IgG1). After 48 h of
culture, supernatants were collected and (A) IL-2 or (B) IFN-! levels were analyzed by
ELISA. (C) After 72 h, cells were collected and expression of CD25 was analyzed by flow
cytometry. Data are shown as mean + SEM of 4 donors. * p < 0.05; ** 0.001< p <0.01; *** p
< 0.001, Mann-Whitney test. The comparisons were made between CD3+CD28 and
CD3+CD277 stimulation conditions or between CD3+CD277 and CD3+isotype control
stimulation conditions.
(D and E) NK cells were isolated from the peripheral blood of healthy donors, and maintained
in IL-2 + IL-15 overnight. The NK cells were then used in a direct cytotoxic assay against the
K562 leukemia cell line (positive control for NK-cell activation). NK cells were also used in a
redirected cytotoxic experiment after coculture with the P815 mastocytoma cell line coated
with anti-CD277, anti-NKp46 or anti-CD16 mAbs. Co-stimulatory effects were also tested
with P815 coated with anti-NKp46 or anti-CD16 mAb plus mouse isotypic controls (IgG1),
anti-DNAM (activating co-receptor), anti-NKG2A (inhibitory receptor) or anti-CD277 mAb.
Histograms represent (D) the percentage of NK cells positive for CD107 a&b and (E) the
percentage of NK cells positive for IFN-!. Data are shown as mean + SEM of 4 donors. The p
values were calculated between both stimulation conditions using the the Wilcoxon paired
Figure 2. Regulation of AKT and ERK phosphorylation via CD277 in TCR-activated T
(A) Histograms depict representative AKT and ERK-1/2 phosphorylation in non-stimulated
(NS) CD4+
T cells (dotted gray histogram) and CD4+
T cells stimulated for 30 min with
antibody-coated Epoxy dynabeads (1µg/ml of anti-CD3 plus 17µg/ml of IgG1 control mAbs,
dotted open histogram!; 1µg/ml of anti-CD3 plus 17µg/ml of anti-CD277 mAbs, solid line
histogram). (B) Purified CD4+
T cells from healthy donors were stimulated or not with
antibody-coated Epoxy dynabeads (1 µg/ml of anti-CD3 plus anti-CD277 mAb or IgG1
(isotype control). Every 2, 5, 10 and 30 min, the intracellular phosphorylation of AKT and
ERK-1/2 on CD4+
T cells were detected by flow cytometry and MFI values (mean + SEM)
are shown. Four independent studies were performed. The p values were calculated between
non-stimulated (NS) T cells and CD3+CD277 stimulated T cells using the Mann-Whitney
Figure 3. Regulation of AKT and ERK phosphorylation via CD277 in
(TCR+CD28)-a c t i v a t e d T
(A) Histograms depict representative AKT and ERK-1/2 phosphorylation in non-stimulated
(NS) CD4+
T cells (dotted gray histogram) and CD4+
T cells stimulated for 30 min with
antibody-coated Epoxy dynabeads (1 µg/ml of anti-CD3 and 2 µg/ml of anti-CD28 plus 17
µg/ml of IgG1 (isotype control), solid gray line!; 1 µg/ml of CD3 and 2 µg/ml of
anti-CD28 plus 17 µg/ml of anti-CD277 mAb, solid black line. (B) Purified CD4+
T cells from
thawed PBMCs of 4 healthy donors stimulated or not with antibody-coated Epoxy dynabeads
(1 µg/ml of anti-CD3 and 2 µg/ml of anti-CD28 plus various concentrations of anti-CD277
mAb or IgG1 (isotype control). Every 2, 5, 10 and 30 min, the intracellular phosphorylation
of AKT and ERK-1/2 on CD4+
T cells was detected by flow cytometry. Results are presented
as MFI (mean fluorescence intensity expression) on CD4+
T cells at different time points after
treatment from 2 to 30 min and are mean + SEM of N=4 samples. The p values were
calculated between both stimulation conditions using the Mann-Whitney test. * p < 0.05; **
Figure 4. CD277 is a costimulatory molecule for CD4+
T cells.
(A) CD4+
T cells were purified from PBMCs from healthy donors (n=4). CFSE-stained
purified CD4+
anti-CD3 plus 2 µg/ml of anti-CD28 mAbs and with various concentrations of CD277 mAb
or IgG1 (isotype control) for 5 days, and proliferation was analyzed by CFSE dilution.
Anti-MHC I (clone YJ4) mAbs were added in a dose-dependent manner in parallel with CD277
mAbs. CFSE-stained T-cell proliferation is shown as (A) the percentage of divided cells as
determined on a representative histogram and (B) the percentage of divided cells. Data are
representative of three independent experiments. (C) The division index is calculated as the
ratio between the total number of divisions and the number of cells included into the tissue
culture well. Data were analyzed using Flowjo software (TreeStar, Ashland, OR). (D) CD4+
T
cells were purified from PBMCs from healthy donors and stimulated with antibody-coated
Epoxy dynabeads (1 µg/ml of anti-CD3 plus 2 µg/ml of anti-CD28 mAb plus various
concentrations of anti-CD277 mAb or IgG1 (isotype control). Supernatants were collected on
day 2 of culture for IFN-! and IL-2 detection by ELISA. Data shown are mean + SEM of n=4
donors. The p values were calculated between CD3+CD28+IgG1 stimulated T cells and
CD3+CD28+CD277 stimulated T cells using the Mann-Whitney test. * p < 0.05; ** 0.001< p
Figure 5. The three CD277 isoforms are differentially expressed in NK cell and T cell
(A) Schematic representation of the three different human butyrophilin 3 (BTN3) / CD277
isoforms containing a stretch of IgV and IgC domain in their extracytoplasmic part and a
transmembrane domain (TM). Only two isoforms (BTN3A1 and BTN3A3) contain a large
intracytoplasmic part encoding for a B30.2 domain. (B) CD277 antibody titration. COS cells
were transfected 24 h with each of the three BTN3 isoforms. 2 x 10⁵
transfected cells were
incubated with increasing amounts of CD277 mAb (0.01 to 100 µg/ml). The stained samples
were analysed by flow cytometry and the mean fluorescence intensity (MFI) was determined
and normalized with an internal antibody control of transfection. The normalized mAb
fluorescence intensity of the positively stained cell populations is plotted against
concentration. The binding activity of the CD277 mAb on COS transfected cells is the same
for the three isoforms. ((Please indicate the number experiments the data are representative
of.)) (C) Quantitative PCRs were performed from purified human NK cells or CD4+
/CD8+
T
cell subsets. Linerarized Affymetrix values are representated corresponding to the mean value
of 4 donors and micro-arrays + SEM. BTNA3A2 is the main isoform expressed by NK cells,
while CD4+
and CD8+
T cells also express high level of BTNA3A1. (D) Representative
expression of the three CD277 isoforms in NK cells or in T cells (both CD4+ and CD8+ values
Figure 6. The two CD277 isoforms, BTN3A1 and BTN3A2, differentially regulate
The NK cell line, KGHYG-1 was nucleofected with constructs encoding for FLAG epitope
tagged-BTN3A1 (right) or BTN3A2 (left). (A) The overexpression of the BTN3 isoforms was
monitored by FLAG mAb cell surface staining. (B) NK cells were stimulated by
anti-NKp30 (1 µg/ml, clone 210847) and/or anti-FLAG (4 µg/ml, clone M2) mAbs for 4 h, and
IFN-! production was assessed by flow cytometric analysis. Upon gating the FLAG-tagged
positive cells, the MFI of IFN-! producing cells was measured. The MFI ratio values were
calculated using the MFI of IFN-! staining on non-treated (NT) cells. Data presented are
Supplemental information
Expression profile of CD277 on T and NK peripheral cell subsets
It has been shown that T and NK cells are expressing the CD277 molecule [1, 2]. Here, we
deeply screen the different T and NK cell subsets for their CD277 surface expression. The
detection of CD277 surface expression was performed on several T and NK differentiation
subsets from healthy donors (n = 4). Using multi-parametric flow cytometry and based on the
differential expression of CD27 and CD45RA molecules, the CD277 expression level on
naïve and memory T cell populations was analyzed (Fig. S1A). Any significant difference
between the different T-cell subsets was detected (Fig. S1B). In parallel, the CD277
expression on the NK cells was monitored by analyzing CD56+
CD3
cells (Fig. S2A). Thawed
alive NK cells (Live dead© negative cells) were selected based on the expression of CD56+
CD3
from healthy human PBMCs after 20 min incubation at 4°C with the
anti-CD277-Alexa647 (clone 20.1). Cells were further washed twice in PBS (PBS, Lonza), then fixed with
2% formaldehyde and analyzed on a BD FACS Canto (BD Biosciences). Data were analyzed
using FlowJo Software (TreeStar, Ashland, OR). Independently of their CD56Bright (helper) or
CD56Dim
(cytotoxic) phenotype, all NK cells also expressed high level of CD277 (Fig. S2B),
showing that CD277 molecules are similarly found on the two major circulating subsets of
NK cells.
Expression profile of CD277 on CD4 TFH cells in lymph nodes
Multiple immune T cell populations are found in lymphoid organs where they play
specialized functions. Among them we particularly analyzed T follicular helper (TFH) cells,
which are present in the germinal centers and required for proper B cell responses. TFH cells
previously described [4], the CXCR5+
ICOSHigh
TFH cells obtained from reactive lymph nodes
expressed high levels of the programmed death-1 (PD-1) molecule (Fig. S1D, left panel).
Based on the differential expression of CXCR5 and ICOS molecules, the CD277 expression
level on TFH cells was analyzed (Fig. S1D, right panel). These results show that CD277 is
expressed on TFH cells at similar levels as other T-cell subsets. Hyperplasic lymph nodes were
collected from patients presenting with enlarged lymph nodes clinically suspicious for
lymphoma. In all cases, routine histology and immunochemistry showed features of
non-specific lymphoid hyperplasia and ruled out the diagnosis of lymphoma.The CD277
immunostainings were performed on total frozen sections of reactive lymph nodes as
previously described [5]. The final concentration for CD277 mAb (clone 20.1) was 1.5 µg/ml.
Negative control samples were prepared by omitting the primary mAb. To visualize CD277
expression in T cells present in the interfollicular T cell zone, total frozen sections of reactive
lymph nodes were stained with CD277 mAbs (Fig. S1E). The results of immunohistochemical
analysis show a strong positivity on both interfollicular T-cell area and mantle B-cell zone,
indicating that CD277 is express on T cells but also on B cells in the lymph nodes.
Surprisingly, the pattern of staining was totally different in the germinal center (GC). Most of
the GC zone is negative suggesting that B cells are loosing the expression of CD277 during
the differentiation process. However, few scattered cells are harboring a positive staining that
could correspond to TFH cells, as these cells (CXCR5 +
ICOS+
PD-1+
) are expressing CD277
(Fig. S1D), confirmed by performing a flow cytometry analysis (data not shown). The TFH
cells (CXCR5+
ICOS+
PD-1+
) were positive for CD277. Thus, CD277 was equally present on
the TFH cells and the CXCR5
conventional T cells, whereas there is no significant staining in
GC resident B cells. Taken together, CD277 is expressed on all subtypes of T cells in the
peripheral blood as well as in lymph nodes and also in NK cells. The expression of the
regulated under conventional stimuli. The regulation of CD277 expression should be also
assessed under lymphocyte activation.
Modulation of CD277 on activated T cells and NK cells
As the expression of co-signaling molecules like PD-1 and their ligands could be regulated
after TCR stimulation [6], we were wondering whether CD277 could be also modulated under
T cell activation. To test this hypothesis, we compared the expression profile of CD277 and
PD-1 at the surface of activated CD4+
T cells. Purified CD4+
T cells from healthy donors were
thus incubated from 24 to 96 h with CD3 and CD28 mAbs or with the respective isotype
controls. As expected, the CD3+CD28 costimulation resulted in a seven-fold increase of PD-1
expression after 72 h of culture, whereas CD277 expression was not modified at any time
point (Fig. S1C). Similar results were obtained on CD8+
T cells (data not shown).
In parallel, the regulation of CD277 expression was analyzed upon IL-2 and IL-15-induced
NK cell activation (Fig. S2C). The HVEM molecule expression is down-regulated during
lymphoid activation [7]. HVEM is highly expressed on NK cells and decreased upon NK cell
stimulation. However, the CD277 expression was not modulated after NK cell activation (Fig.
S2C). Altogether, these results demonstrated that T and NK cells constitutively express the
CD277 molecule, but its expression is not modulated after cell activation.
This set of experiments on CD277 expression profiles (Fig. S1 & S2) using CD277 mAb
(clone 20.1) showed that the CD277 molecule appears to be stably expressed in T and NK
References
1 Compte, E., Pontarotti, P., Collette, Y., Lopez, M. and Olive, D., Frontline:
Characterization of BT3 molecules belonging to the B7 family expressed on immune
cells. Eur J Immunol 2004. 34: 2089-2099.
2 Yamashiro, H., Yoshizaki, S., Tadaki, T., Egawa, K. and Seo, N., Stimulation of
human butyrophilin 3 molecules results in negative regulation of cellular immunity. J
Leukoc Biol 2010. 88: 757-767.
3 Breitfeld, D., Ohl, L., Kremmer, E., Ellwart, J., Sallusto, F., Lipp, M. and
Forster, R., Follicular B helper T cells express CXC chemokine receptor 5, localize to
B cell follicles, and support immunoglobulin production. J Exp Med 2000. 192:
1545-1552.
4 Chtanova, T., Tangye, S. G., Newton, R., Frank, N., Hodge, M. R., Rolph, M. S.
and Mackay, C. R., T follicular helper cells express a distinctive transcriptional
profile, reflecting their role as non-Th1/Th2 effector cells that provide help for B cells.
J Immunol 2004. 173: 68-78.
5 Xerri, L., Devilard, E., Hassoun, J., Olive, D. and Birg, F., In vivo expression of
the CTLA4 inhibitory receptor in malignant and reactive cells from human
lymphomas. J Pathol 1997. 183: 182-187.
6 Greenwald, R. J., Freeman, G. J. and Sharpe, A. H., The B7 family revisited. Annu
Rev Immunol 2005. 23: 515-548.
7 Morel, Y., Schiano de Colella, J. M., Harrop, J., Deen, K. C., Holmes, S. D.,
Wattam, T. A., Khandekar, S. et al., Reciprocal expression of the TNF family
receptor herpes virus entry mediator and its ligand LIGHT on activated T cells:
Supplemental Figures
(A) CD4+
and CD8+
T cell subsets were subdivided based on differential CD27 and CD45RA
expression into CD27+ CD45RA+ , Naive (N) ; CD27+ CD45RA -, Central Memory (CM) ; CD27 CD45RA+
, Effectors (E) ; and CD27
CD45RA
-, Effector Memory (EM). (B) MFI of
CD277 among these cell subsets is plotted + SEM.
(C) Expression of the CD277 and PD-1 molecules represented as fold induction over the
unstimulated condition. Expression as determined by fold induction ± SEM of CD277 and
PD-1 on purified CD4+
T cells from PBMCs stimulated or not with plate-immobilized
anti-CD3 (0.3 µg/mL) and anti-CD28 (10 µg/mL) mAbs during 96 h. Every 24 h, CD4+
T cells are
stained with anti-PD-1 and anti-CD277 Alexa 647-coupled mAbs as described in the material
and methods section. Data are representative of 4 independent experiments.
(D) Expression profile of CD277 and PD-1 in lymphoid organs. Living cells from lymphoid
tissue were identified as Vivid negative. T follicular Helper cells were further gated using
staining with CD4, ICOS and CXCR5 mAbs. Results are provided as MFI values (n = 7,
mean + SEM). Data are representative of 7 independent studies. The p values were calculated
using the Mann-Witney paired test to compare differences between CD277 or PD-1
expression on T cells subsets. * p < 0.05; ** 0.001< p <0.01; *** p < 0.001.
(E) CD277 immunohistochemical pattern on reactive lymph nodes. Cells teased from lymph
nodes were collected from patients who had given informed consent according with the
Institutional Review Board of the Institut Paoli-Calmettes (Marseille, France). Only a few
positive small lymphocytes were present scattered within the Germinal Center (GC). The
CD277 expression was found on both interfollicular T-cells area and mantle zone (MZ)
Figure S2. CD277 expression in NK cells.
(A) Gating strategy of CD3
CD56+
expression of on CD56Bright
and CD56Dim
NK cells isolated from a representative donor. 4
donors have been analyzed.
(C) Expression of the CD277 and HVEM molecules on cytokine-activated NK cells. Fresh
NK cells were sorted with the Easy Sep® negative selection kit and incubated overnight in
medium completed with IL-2 (100 U/ml) and IL-15 (10 ng/ml) for 24 h. Cells were analyzed
for CD277 expression as described in the material and methods section, data are