A Cis-Regulatory Map of the Drosophila Genome
The MIT Faculty has made this article openly available.
Please share
how this access benefits you. Your story matters.
Citation
Nègre, Nicolas et al. “A Cis-regulatory Map of the Drosophila
Genome.” Nature 471.7339 (2011): 527–531.
As Published
http://dx.doi.org/10.1038/nature09990
Publisher
Nature Publishing Group
Version
Author's final manuscript
Citable link
http://hdl.handle.net/1721.1/72980
Terms of Use
Creative Commons Attribution-Noncommercial-Share Alike 3.0
A Cis-Regulatory Map of the Drosophila Genome
Nicolas Nègre1,*, Christopher D. Brown1,*, Lijia Ma1,*, Christopher Aaron Bristow2,*, Steven
W. Miller3,*, Ulrich Wagner5,*, Pouya Kheradpour2, Matthew L. Eaton14, Paul Loriaux4,
Rachel Sealfon2, Zirong Li5, Haruhiko Ishii3, Rebecca F. Spokony1, Jia Chen6, Lindsay
Hwang5, Chao Cheng14,15,16,17, Richard P. Auburn7, Melissa B. Davis1, Marc Domanus1,
Parantu K. Shah8, Carolyn A. Morrison1, Jennifer Zieba1, Sarah Suchy1, Lionel
Senderowicz1, Alec Victorsen1, Nicholas A. Bild1, A. Jason Grundstad1, David Hanley6,
David M. MacAlpine14, Mattias Mannervik9, Koen Venken10, Hugo Bellen10, Robert White11,
Steven Russell7, Robert L. Grossman1,6,12, Bing Ren5,13, Mark Gerstein14,15,16, James W.
Posakony3, Manolis Kellis2, and Kevin P. White1
1Institute for Genomics & Systems Biology, Department of Human Genetics, The University of Chicago, 900 East 57th Street, Chicago, IL 60637, USA
2Massachusetts Institute of Technology, Computer Science and Artificial Intelligence Laboratory, Broad Institute of MIT and Harvard, Cambridge MA 02139, USA
3Division of Biological Sciences/CDB, University of California San Diego, La Jolla, CA 92093, USA
4Signaling Systems Laboratory, Department of Chemistry and Biochemistry, University of California, San Diego, 9500 Gilman Drive, La Jolla, CA 92093, USA
5Ludwig Institute for Cancer Research, 9500 Gilman Drive, La Jolla, CA 92093-0653
6National Center for Data Mining, University of Illinois at Chicago, 851 S. Morgan Street, Chicago IL 60607, USA
7Department of Genetics and Cambridge Systems Biology Centre, University of Cambridge, Cambridge, CB2 3EH, UK
8Department of Biostatistics & Computational Biology, Dana-Farber Cancer Institute, Harvard School of Public Health, Boston MA 02115, USA
9Department of Developmental Biology, Wenner-Gren Institute, Arrhenius Laboratories E3, Stockholm University, S-106 91 Stockholm, Sweden
10Department of Molecular and Human Genetics, BCM, Houston, TX, 77030
*Corresponding authors: (KPW, project director, kpwhite@uchicago.edu; MK, data analysis, manoli@mit.edu; JWP, biological validation, jposakony@ucsd.edu; BR, chromatin, biren@ucsd.edu; RLG, informatics, grossman@labcomputing.org; SR, silencer/ insulator analysis, sr120@cam.ac.uk).
*These authors contributed equally to this work
Supplementary Information is linked to the online version of the paper at www.nature.com/nature.
Author Contributions
NN, LS and KPW designed and produced modENCODE antibodies; NN, ZL, HI, RFS, MBD, CAM, JZ, SS and MD performed the ChIP-chip and ChIP-seq experiments; RFS, KV, HB, AV produced the GFP-tagged-TF Drosophila lines; SWM, HI, LH, RPA performed the validation experiments of promoters, enhancers and insulators; NN, PKS, NAB, AJG, DH and RLG performed the primary analysis and organized the data of ChIP-chip and ChIP-seq experiments; NN, CDB, LM, CAB, UW, PK, MLE, PL, RS, JC, CC, PKS, DMM and MG analysed the data; MM contributed to reagents; NN, CDB, LM, CAB, SWM, RPA, RW, SR, BR, MG, JWP, MK and KPW wrote the paper; HB, RW, SR, RLG, BR, JWP, MK and KPW supervised the work.
Author Information
NIH Public Access
Author Manuscript
Nature. Author manuscript; available in PMC 2011 September 23.
Published in final edited form as:
Nature. 2011 March 24; 471(7339): 527–531. doi:10.1038/nature09990.
NIH-PA Author Manuscript
NIH-PA Author Manuscript
11Department of Physiology, Development and Neuroscience, University of Cambridge, Cambridge, CB2 3DY, UK
12Department of Medicine, University of Chicago 5841 South Maryland Avenue, Chicago, IL 60637
13Department of Cellular and Molecular Medicine, Institute of Genomic Medicine and Moores Cancer Center, 9500 Gilman Drive, La Jolla, CA 92093
14Department of Pharmacology and Cancer Biology, Duke University Medical Center, Durham, NC 27710 USA
15Program in Computational Biology and Bioinformatics, Yale University, 266 Whitney Avenue, New Haven, CT 06520
16Department of Molecular Biophysics and Biochemistry, Yale University, 266 Whitney Avenue, New Haven, CT 06520
17Department of Computer Science, Yale University, Bass 432, 266 Whitney Avenue, New Haven, CT 06520
Abstract
Systematic annotation of gene regulatory elements is a major challenge in genome science. Direct mapping of chromatin modification marks and transcriptional factor binding sites genome-wide 1,2 has successfully identified specific subtypes of regulatory elements 3. In Drosophila several pioneering studies have provided genome-wide identification of Polycomb-Response Elements 4, chromatin states 5, transcription factor binding sites (TFBS) 6–9, PolII regulation 8, and insulator elements 10; however, comprehensive annotation of the regulatory genome remains a significant challenge. Here we describe results from the modENCODE cis-regulatory annotation project. We produced a map of the Drosophila melanogaster regulatory genome based on more than 300 chromatin immuno-precipitation (ChIP) datasets for eight chromatin features, five histone deacetylases (HDACs) and thirty-eight site-specific transcription factors (TFs) at different stages of development. Using these data we inferred more than 20,000 candidate regulatory elements and we validated a subset of predictions for promoters, enhancers, and insulators in vivo. We also identified nearly 2,000 genomic regions of dense TF binding associated with chromatin activity and accessibility. We discovered hundreds of new TF co-binding relationships and defined a TF network with over 800 potential regulatory relationships.
To reveal chromatin, promoter, and enhancer domains in the genome, we performed a developmental time course of six histone modifications, the Drosophila CREB Binding Protein (CBP) and RNA Polymerase II (PolII) across twelve stages of embryonic, larval, pupal and adult development (Table 1, Supplementary Table 1; Supplemental Fig 1–2; see Supplementary Methods). We used whole animals to generate the maximum number of chromatin marks across the genome. We identified 506,001 chromatin-associated features covering 101 MB (86.99%) of the non-repetitive genome. To relate these chromatin features to gene activity, we quantified transcript levels by high-throughput cDNA sequencing (RNA-seq) with the same biological samples used for ChIP. Additionally, we mapped 38 functionally diverse TFs in different developmental stages and cell types. A total of 155,048 TF binding sites (TFBS) were identified, including 35,096 unique TFBS. Of these, 93.76% overlap at least one chromatin feature. We noted that while the majority of factors are bound in discrete regions, several are distributed in larger domains (Table1, Supplementary Fig.3). We also characterized the binding distributions of 5 Histone Deacetylases (HDACs), identifying a total of 19,937 HDAC binding sites mapping to 7,692 unique genomic
locations. Of these, 99.25% overlap with at least one chromatin feature, and 94.58% overlap
NIH-PA Author Manuscript
NIH-PA Author Manuscript
with at least one TFBS. All data from this study are available at www.modencode.org and www.cistrack.org.
For each chromatin mark, very few target genes displayed either repressive or activating marks across all of development; most genes were within dynamically marked regions (Supplementary Fig. 4a). We observed three major patterns of chromatin mark distributions, corresponding to active promoters (H3K4me3, H3K9Ac, H3K27Ac), repressive states and silencers (H3K27me3, PHO/PREs), and enhancers (CBP, H3K4me1) (Supplementary Fig. 4b).
The first pattern, represented by the activating histone modifications H3K4me3, H3K9Ac, and H3K27Ac, was strongly associated with Transcription Start Sites (TSSs) and was positively correlated with gene expression levels (Supplementary Figs. 4b, 5a,
Supplementary Fig 7) 11. While the enrichment of activating histone modifications was quite striking, we note that a substantial fraction of genes (34%) were expressed but lacked H3K4me3 marks at their annotated TSS (Supplemental Figs. 8–12). Regions marked by each activating modification also significantly overlapped with class I insulators, PolII binding sites, and a large fraction of TFBS (Supplemental Fig 1).
The second type of pattern, repressive chromatin marks H3K9me3 and H3K27me3, showed a distribution of large domains throughout development (Supplementary Figs 2, 6, and 13). As expected based on polytene chromosomes in situ data, H3K9me3 marks localized to ~20 developmentally stable domains primarily at centromeres 12. H3K27me3 marks, in contrast, were remarkably dynamic (Fig 1a). Dynamic domains may be due to changes in specific cell populations during development or the active addition and removal of H3K27me3 marks. Previous studies have implicated H3K27me3 dynamics in the regulation of homeotic genes, in the differentiation of stem cells, and in developmental processes in vertebrates 13. We found between 123 and 438 discrete domains present at the developmental stages assayed, each with an average length of ~70kb (Supplementary Fig. 13a; Supplementary Table 2). 1,264 genes were associated with H3K27me3 in at least one stage of development, with 397 genes (31%) in domains present in all stages of development and 867 genes (69%) in dynamic domains (Fig. 1a). Stable H3K27me3 domains corresponded to those reported in embryos and tissue culture cells 4, and were enriched for genes involved in development, transcription and segmentation. However, identification of stage-specific H3K27me3 domains revealed previously unappreciated H3K27me3 targets, including genes that control apoptosis, regulation of growth, and neurotransmitter transport (Supplementary Fig. 14). We found that stable H3K27me3 domains are highly enriched for genes that exhibit stage and tissue-specific expression, and are depleted for ubiquitously expressed genes
(Supplementary Fig 15).
H3K4me1-marked and CBP/p300-bound regions form a third, intermediate class of genomic elements known to be associated with active enhancers (Supplementary Fig. 4b and 1c) 3,14. They were also associated with active promoters, activating histone marks, and transcription factor binding sites (Supplementary Fig. 1). H3K4me1 and CBP were bound broadly across TSSs, typically positioned 1–2 kb upstream and downstream of the TSS, consistent with previous observations (Supplementary Fig. 4a and Supplementary Fig 8) 11. Accordingly, these patterns were very dynamic across development (Supplementary Fig. 4a).
To characterize the regulators of chromatin mark dynamics, we determined the genome-wide distribution pattern of all five known Drosophila HDACs (HDAC1/Rpd3, HDAC3, HDAC4a, HDAC6 and HDACX/11). All five HDACs are enriched at active promoters, and enrichment is correlated with target gene expression level (Supplementary Fig. 16).
HDAC4a and HDAC1/Rpd3 binding sites also mark Polycomb-group responsive elements
NIH-PA Author Manuscript
NIH-PA Author Manuscript
(PREs). HDAC1 and 4a binding sites are frequently found within H3K27me3 repressive domains (Supplementary Figs. 17 and 18), and are significantly enriched at embryonic PHO (a PcG recruiter protein)-bound regions (Supplementary Fig. 16f). Of the 537 HDAC1 and 4a binding sites that overlap H3K27me3 but not H3K4me3 (Supplementary Fig 16), 149 overlap with 350 previously described15 embryonic PHO sites (Supplementary Fig 17 and 18). HDAC3 is primarily associated with transcribed, H3K36me3 marked exons 16 (Supplementary Fig. 16a, d).
Using the dynamic chromatin signatures and RNA-seq data, we next sought to
systematically annotate cis-regulatory elements. To identify novel promoters, we identified coincident H3K4me3, PolII, and RNA signals at least 1,000 base pairs away from any annotated TSS (see Supplemental Methods). In each developmental stage we found several hundred such regions (average, 485; range, 179–885), resulting in a total of 2,307 novel promoter predictions; 1,117 of which are supported by modENCODE cap analysis of gene expression (CAGE) data from embryos 17 (Supplementary Fig. 4a). We subjected 110 novel promoter predictions to biological validation using a luciferase reporter assay in Kc167 cells. 75 of these 110 predicted promoters (68%) yielded significant luciferase activity in at least one orientation, with 26 displaying bi-directionality (Supplementary Fig. 4b;
Supplementary Table 3). Together, the CAGE and reporter assay data indicate that a high proportion of these novel promoter predictions indeed correspond to previously un-annotated TSSs.
In order to identify additional putative cis-regulatory elements on a genome-wide scale, we examined two signatures of enhancers, H3K4Me1 and CBP/p300 11,14. CBP and H3K4me1 are significantly enriched within several classes of known enhancers from the CRM Activity Database (CAD)9. For example, we found a 15-fold (z-score of 26) and 5.9-fold (z-score of 10) enrichment for CBP and H3K4me1 overlap, respectively, with blastoderm-specific enhancers, indicating that our dynamic chromatin map successfully recovers previously annotated enhancers (Supplementary Fig. 19). Given that CBP can be recruited to enhancers by bound TFs, we sought to further support the functional relevance of CBP-bound regions by examining clusters of co-occupancy with other TFs. Several CBP clusters are bound by TFs known to interact physically with CBP, such as Bicoid, Dorsal (DL), and Trithorax-like (TRL/GAF); while other clusters are enriched for known enhancers (Fig. 1e) and are strongly enriched in K3K4me1 and the repressive mark H3K27me3 (Supplementary Fig. 20f). In total, 14,450 distinct putative CBP-bound cis-regulatory elements were identified across the genome (Supplementary Table 18).
To validate the ability of CBP binding data to accurately identify cis-regulatory elements, we tested 33 putative enhancer sequences using reporter assays in transgenic animals. We focused on putative enhancers that have dynamic CBP association during embryogenesis (Supplementary Table 4). Thirty of the 33 predicted enhancers produce specific reporter expression patterns (Fig 1f; Supplementary Fig 21). We also selected a set of putative insulator elements 10, and we tested their activity in an enhancer-blocking assay based on the eve stripe 2 and 3 enhancers. We assayed a set of 15 genomic fragments associated with the binding of Centrosomal protein 190kd (CP190) + CTCF (class I), CP190 + suppressor of Hairy wing (Su(Hw)) (class II) and TRL 10. We found that five of eight CTCF sites showed strong enhancer-blocking activity and the remaining three showed weak or variable activity. In contrast, neither of the TRL sites nor any of the five Su(Hw) sites we tested blocked enhancer-promoter interactions in this assay (Supplementary Fig 22). These results support a role for CTCF in insulator activity in vivo, but suggest that other proteins that have
classically been associated with insulator activity are not strictly linked to this function.
NIH-PA Author Manuscript
NIH-PA Author Manuscript
To further annotate predicted enhancers and to determine whether dynamics of chromatin and gene expression from whole animals can be associated with specific factors, we analyzed the patters of 38 diverse TFs we mapped at various developmental stages. We compared our data with the CAD database (Fig. 1g) and observed that many factors are specifically enriched in particular enhancer classes. For example, Engrailed (EN) binding sites are enriched within mesothoracic disc enhancers, while Knirps (KNI), Tailless, and Schnurri (SHN) are enriched within blastoderm enhancers. Indeed, enhancers are usually characterised by multiple TFs binding in concert to target genomic DNA. We used a Gaussian kernel density estimation across the binding profiles of 38 TFs mapped in early embryos in this and two previously published studies 7,9, to define a ‘TF complexity’ score based on the number and proximity of contributing TFs (see Supplemental Methods). Of 38,562 unique binding sites mapped by the 38 TFs, 38.3% are bound by more than two factors. 5.2% sites (1,962) are bound by more than eight factors (Supplementary Table 5, Supplemental Figs. 23–24) and are considered High Occupancy Target (HOT) regions. While HOT regions have been observed in C. elegans18 and human (ENCODE project, unpublished results), their function in gene regulation is unknown 7,19.
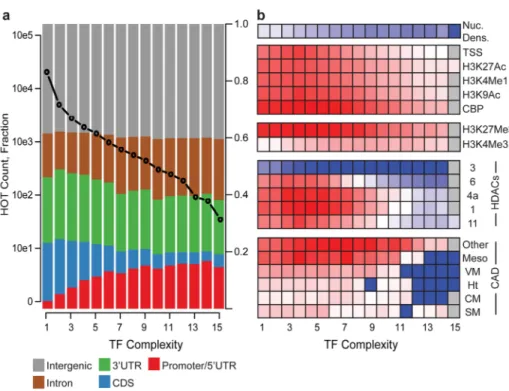
Regions of higher complexity are weakly associated with more highly expressed genes (r2 = 0.19), suggesting that low-complexity binding sites are associated with more restricted expression patterns. Interestingly, annotated enhancers, CBP, activating histone marks including H3K4me1, and HDACs 1, 4a, 6, and 11 are most significantly enriched within low-to moderate- complexity category (CC) regions (CC2-CC8) (Fig 2b). These
enrichments consistently decrease at regions of high complexity (CC8-16). In contrast, we found that coding exons and HDAC3, which marks actively transcribed exons (Fig 2b, Supplemental Fig. 24 16), are depleted from moderate- to high-complexity regions (>CC4). As expected, TF complexity is inversely correlated with nucleosome enrichment 20 (Fig. 2b). Interestingly, when compared to our enhancer validations and negative controls that were selected independent of HOT region determination, there appears to be no obvious relationship between enhancer activity and HOT regions; thirteen validated enhancers overlap with HOT regions but so did several sequences that give no enhancer activity (Fig. 1f; Supplementary Table 4 and data not shown). Taken together, these results indicate HOT regions are primarily associated with open chromatin but they do not always demarcate cis-regulatory elements.
The existence of HOT regions complicates the interpretation of TF co-occurance. For example, pair-wise clustering of TFBS resulted in very large groups of co-occurring TFs, revealing few specific relationships (Supplemental Fig. 23). However, TFBS clustering performed on HOT subtracted TFBS reveals structure that is otherwise obscured when HOT regions are included (Fig. 3). For example, binding sites from different stages assayed for the same TF [e.g. TRL, Ultrabithorax (UBX), Ecdysone receptor (ECR)], known interactors [e.g. Tinman (TIN) with Twist (TWI) and Biniou (BIN) with Bagpipe (BAP)], and technical replicates [e.g. GRO] are more tightly clustered in the HOT-subtracted data. TFs known to physically interact with one another at specific enhancers were significantly associated throughout the genome. For example, the co-repressor complex of GRO and EN and the
Drosophila SWI/SNF chromatin remodeling complex components Brahma (BRM) and
Snf5-related 1 (SNR1) show significant co-binding (z > 20). Co-binding enrichment genome-wide was also observed for TFs that are known to bind independently to particular enhancers, such as UBX and EN that each bind to the DMX enhancer of the distalless (dll) gene, and each independently contribute to dll repression in different embryonic
segments 21. DLL was itself enriched for co-binding with EN, GRO, and UBX, indicating common regulation of target genes. Interestingly, such previously undescribed interactions were seen at significance levels equal to or greater than those of known interactions. For example, while the previously reported mesodermal TF dataset9 (TIN, TWI, BIN, BAM,
NIH-PA Author Manuscript
NIH-PA Author Manuscript
MEF2) all have high overlap with one another as expected, these factors also all show highly significant overlap with GRO, CAD and EN. Many other notable overlap pairs were identified, including the Ecdysone Receptor with TRL, the peripheral nervous system (PNS) master regulator Senseless (SENS) 22 with the axon guidance TF Disconnected, and the Jak/ Stat signaling pathway TF Stat92E with the chromatin remodeling complex factors BRM and SNR1 - all potential new connections between well-studied regulatory pathways or mechanisms. In total there are 831 highly significant positive pair-wise co-binding
interactions in Supplementary Fig 25 (Z score > 20; bright red in Fig. 4c), most of which are previously undescribed.
While most significantly associated TF pairs did show positive overlaps, we observed a few instances of highly significant negative associations (shown in blue, Fig. 3). One of the most anti-correlated pairs of TFs is Brakeless (BKS) and CAD. BKS is a co-repressor that has been implicated in gap gene regulation, for example acting to restrict the expression of
knirps (kni) and giant (gt) in the posterior blastoderm 23. In contrast, CAD activates kni and
gt in the same embryonic domain 24. Even when BKS and CAD have multiple binding sites nearby one another, they appear to be non-overlapping and in different putative cis-regulatory elements (Supplemental Fig 26). The biologically opposing roles of these two TFs appear to have led to the evolution of a very strong repulsion for occupying the same regulatory elements. To our knowledge this genome-wide aversion in terms of TFs co-occupancy has not previously been observed in a metazoan genome.
To visualize the regulatory interactions among TFs, we built an intuitive hierarchy representing TF regulatory associations (Supplemental Figs 24–25, see Supplementary Methods). This network was constructed using 61 TFs datasets generated by the
modENCODE project (pink nodes) and 20 TFs from recently published work 6,7,9 (green and yellow nodes). Specifically, we built a core hierarchy using a breadth-first search algorithm in a bottom-up fashion. TFs that regulate fewer than five TFs formed the bottom layer while TFs that directly regulated the bottom layer factors form the second layer. In total, the network model characterized 835 interactions; 686 were established by TFs mapped in this study (blue edges), 125 were derived from previously published data (grey edges), and 24 were auto-regulatory6,7,9 (Supplemental Fig 27). Components of the network derived from modENCODE mapped TFs capture many known regulatory interactions; for example, EVE regulates ftz and prd. However, the vast majority of the 686 TF interactions represent new putative regulatory relationships.
TFs involved in widespread target co-binding and feed-forward loops are also likely to be involved in regulating common patterns of expression. To better understand how
combinatorial TF binding regulates developmentally dynamic gene expression, we analyzed gene expression data from our RNA-seq time-course and an independently performed 64-stage-developmental microarray expression time course. We partitioned the expression datasets into 18 and 64 k-means clusters, respectively, which resulted in gene sets with widely varying temporal specificity (Supplemental Fig 25). For each cluster of genes, we then quantified the enrichment of promoter-proximal binding sites for 90 modENCODE and previously published TF datasets. From the microarray timecourse clustering, five
metaclusters were identified. Genes within these metaclusters are most highly expressed at third instar through adulthood (I), first instar through pupal-adult ecdysone pulse (II), early embryos (III), embryogenesis and larval life (IV), and late embryos (V). In both the microarray and RNA-seq timecourses, most clusters are significantly associated with a core set of TFs including SIN3A, UBX, CAD, SENS and TRL. Interestingly, all metaclusters are enriched for TRL binding sites except V, which is enriched for SNR1, another Trithorax group gene; consistent with reports that SNR1 has specialized functions 25. Metacluster II is most highly expressed during adult central nervous system development 26 and enriched for
NIH-PA Author Manuscript
NIH-PA Author Manuscript
several neuronal differentiation factors (Kruppel, KNI and Jumeau) 27. Metacluster III uniquely is associated with embryonic patterning and organogenesis TFs (e.g. Runt, Hunchback, TWI). Notably, many of the TF co-enrichments within gene expression clusters correspond to binding site and regulatory co-enrichments (Fig. 3 and Supplemental Fig 25), indicating that many of the co-associations of TFs with developmental expression patterns reflect co-binding and coordinate regulation at target sites in the genome.
In summary, we generated a draft regulatory annotation map of the Drosophila genome from 313 genome-wide datasets that identify or predict thousands of regulatory elements, including 537 silencers, 2,307 newly annotated promoters, 14,450 candidate CBP-bound cis-regulatory elements, 7,685 putative insulators 10, and 35,000 unique TBFS that were bound by one or more TF (Supplementary Tables 6–16, Supplementary Fig. 28). The TF binding results defined HOT regions of increased TF complexity and their association with HDACs and open chromatin. Subsequent analysis of significantly co-bound TFs and TF networks with HOT-subtracted data greatly expands the existing view of regulatory interactions among TFs and associates specific sets of TFs with specific developmental gene expression patterns. Several unexpected results arose from this initial phase of the modENCODE Project. For example, we revealed a specific class of unmarked promoters, identified a surprising association of HDAC4a and HDAC1/rpd3 to PREs, and discovered pairs of TFs that systematically avoid binding near each other throughout the genome. We expect that the results from modENCODE will serve as launch points for many new investigations, and that additional novel insights about the functional consequences of the patterns we describe here will emerge as others in the community engage with these data.
Methods Summary
ChIP experiments were performed on whole Drosophila melanogaster animals from the following developmental stages: embryonic stages 0–4h, 4–8h, 12–16h, 16–20h, 20–24h, larval stages L1, L2, and L3, pupal stage and adult male. The biological material was homogenized in 1.8% of formaldehyde. The cross-linked chromatin was sonicated to an average size of 500bp. Pre-cleared chromatin extract was incubated overnight at 4C with the specific antibody and immunoprecipitated. ChIP material has been hybridized either on custom Agilent tiling microarrays or on Affymetrix Tiling arrays. For ChIP-seq, standard protocols for Illumina Genome Analyzers have been used. The softwares used for peak detection were MACS, Peakseq, HGGSEG, CisGenome, MAT and HMMseg when
appropriate. For RNAseq experiments, total RNA has been extracted from the same material used for ChIP and processed according to Illumina standard protocols. All methods and scripts used for the analysis of the data are described in the Supplementary Online Material and are available upon request. Transgenic assays for promoters, insulators and enhancers are described in the Supplementary Online Material.
Supplementary Material
Refer to Web version on PubMed Central for supplementary material.
Acknowledgments
This work was supported by U01HG004264 from the National Human Genome Research Institute to KPW and also funded by the Chicago Biomedical Consortium (CBC) with support from the Searle Funds at the Chicago Community Trust. The content is solely the responsibility of the authors and does not necessarily represent the official views of the National Human Genome Research Institute or the National Institutes of Health. CDB is supported by a Lilly-Life Sciences Research Foundation fellowship. CAB is supported by a NIH NRSA postdoctoral fellowship. RPA is in part supported by an Isaac Newton Trust award to RW. PL was supported by a grant from the Department of Energy Computational Sciences Graduate Fellowship (DOE CSGF). MEL and DMM work was supported by NHGRI grant U01 HG004279. We thank the FGF at the University of Chicago and the
NIH-PA Author Manuscript
NIH-PA Author Manuscript
HGAC at Argonne National Laboratory for processing of microarrays and of Illumina sequence. We thank Tong-Ruei Li, J. David Lambert, Scott Rifkin, Tine Herreman, Christopher Mason, Ling Sun and Zareen Gauhar for producing the developmental expression microarray data. We also thank the many members of the Drosophila community who generously contributed to this work by providing reagents. A complete list of community participants is included in the Supplementary Methods.
References
1. Ren B, et al. Genome-wide location and function of DNA binding proteins. Science. 2000; 290 (5500):2306–2309. [PubMed: 11125145]
2. Johnson DS, Mortazavi A, Myers RM, Wold B. Genome-wide mapping of in vivo protein-DNA interactions. Science. 2007; 316 (5830):1497–1502. [PubMed: 17540862]
3. Heintzman ND, et al. Histone modifications at human enhancers reflect global cell-type-specific gene expression. Nature. 2009; 459 (7243):108–112. [PubMed: 19295514]
4. Schuettengruber B, Chourrout D, Vervoort M, Leblanc B, Cavalli G. Genome regulation by polycomb and trithorax proteins. Cell. 2007; 128 (4):735–745. [PubMed: 17320510] 5. Filion GJ, et al. Systematic protein location mapping reveals five principal chromatin types in
Drosophila cells. Cell. 143(2):212–224. [PubMed: 20888037]
6. Li XY, et al. Transcription factors bind thousands of active and inactive regions in the Drosophila blastoderm. PLoS Biol. 2008; 6 (2):e27. [PubMed: 18271625]
7. MacArthur S, et al. Developmental roles of 21 Drosophila transcription factors are determined by quantitative differences in binding to an overlapping set of thousands of genomic regions. Genome Biol. 2009; 10 (7):R80. [PubMed: 19627575]
8. Zeitlinger J, et al. RNA polymerase stalling at developmental control genes in the Drosophila melanogaster embryo. Nat Genet. 2007; 39 (12):1512–1516. [PubMed: 17994019]
9. Zinzen RP, Girardot C, Gagneur J, Braun M, Furlong EE. Combinatorial binding predicts spatio-temporal cis-regulatory activity. Nature. 2009; 462 (7269):65–70. [PubMed: 19890324] 10. Negre N, et al. A comprehensive map of insulator elements for the Drosophila genome. PLoS
Genet. 6(1):e1000814. [PubMed: 20084099]
11. Heintzman ND, et al. Distinct and predictive chromatin signatures of transcriptional promoters and enhancers in the human genome. Nat Genet. 2007; 39 (3):311–318. [PubMed: 17277777] 12. Schotta G, et al. Central role of Drosophila SU(VAR)3–9 in histone H3-K9 methylation and
heterochromatic gene silencing. EMBO J. 2002; 21 (5):1121–1131. [PubMed: 11867540] 13. Agger K, Christensen J, Cloos PA, Helin K. The emerging functions of histone demethylases. Curr
Opin Genet Dev. 2008; 18 (2):159–168. [PubMed: 18281209]
14. Visel A, et al. ChIP-seq accurately predicts tissue-specific activity of enhancers. Nature. 2009; 457 (7231):854–858. [PubMed: 19212405]
15. Kwong C, et al. Stability and dynamics of polycomb target sites in Drosophila development. PLoS Genet. 2008; 4 (9):e1000178. [PubMed: 18773083]
16. Kolasinska-Zwierz P, et al. Differential chromatin marking of introns and expressed exons by H3K36me3. Nat Genet. 2009; 41 (3):376–381. [PubMed: 19182803]
17. Hoskins RA, et al. Genome-wide analysis of promoter architecture in Drosophila melanogaster. Genome Res.
18. Gerstein MB, et al. Integrative analysis of the Caenorhabditis elegans genome by the modENCODE project. Science. 330(6012):1775–1787. [PubMed: 21177976]
19. Moorman C, et al. Hotspots of transcription factor colocalization in the genome of Drosophila melanogaster. Proc Natl Acad Sci U S A. 2006; 103 (32):12027–12032. [PubMed: 16880385] 20. Henikoff S, Henikoff JG, Sakai A, Loeb GB, Ahmad K. Genome-wide profiling of salt fractions
maps physical properties of chromatin. Genome Res. 2009; 19 (3):460–469. [PubMed: 19088306] 21. Gebelein B, McKay DJ, Mann RS. Direct integration of Hox and segmentation gene inputs during
Drosophila development. Nature. 2004; 431 (7009):653–659. [PubMed: 15470419] 22. Nolo R, Abbott LA, Bellen HJ. Senseless, a Zn finger transcription factor, is necessary and
sufficient for sensory organ development in Drosophila. Cell. 2000; 102 (3):349–362. [PubMed: 10975525]
NIH-PA Author Manuscript
NIH-PA Author Manuscript
23. Haecker A, et al. Drosophila brakeless interacts with atrophin and is required for tailless-mediated transcriptional repression in early embryos. PLoS Biol. 2007; 5 (6):e145. [PubMed: 17503969] 24. Rivera-Pomar R, Lu X, Perrimon N, Taubert H, Jackle H. Activation of posterior gap gene
expression in the Drosophila blastoderm. Nature. 1995; 376 (6537):253–256. [PubMed: 7617036] 25. Zraly CB, et al. SNR1 is an essential subunit in a subset of Drosophila brm complexes, targeting
specific functions during development. Dev Biol. 2003; 253 (2):291–308. [PubMed: 12645932] 26. Truman JW. Metamorphosis of the central nervous system of Drosophila. J Neurobiol. 1990; 21
(7):1072–1084. [PubMed: 1979610]
27. Parrish JZ, Kim MD, Jan LY, Jan YN. Genome-wide analyses identify transcription factors required for proper morphogenesis of Drosophila sensory neuron dendrites. Genes Dev. 2006; 20 (7):820–835. [PubMed: 16547170]
28. Venken KJ, et al. Versatile P[acman] BAC libraries for transgenesis studies in Drosophila melanogaster. Nat Methods. 2009; 6 (6):431–434. [PubMed: 19465919]
NIH-PA Author Manuscript
NIH-PA Author Manuscript
Figure 1. Chromatin dynamics across Drosophila development
(A) Enrichment of CBP and H3K4me1 (rows) within regions marked by other chromatin modifications, factors, or annotated enhancers (columns). Note that (i) CBP is enriched within all active marks (H3K4me3, H3K27Ac, H3K9Ac, H3K4me1 and PolII) at all stages of development and (ii) early embryo (0–16h) CBP and H3K4me1 marked regions are enriched within H3K27me3 domains and annotated enhancers (right panel). (B) Heatmap depicting fold enrichment of CBP bound regions (columns) at different developmental stages for each of the 22 clusters of TSS-distal regions (rows) grouped by their protein binding profiles. A subset of the clusters shows significant enrichment for CBP at different developmental stages. (C) Enrichment of enhancer categories (columns) for each of the 22 clusters of TSS-distal regions (rows). Many clusters enriched for CBP binding in early development are also strongly enriched for enhancers (rows with *). (D) Embryo-specific CBP binding predicts unannotated enhancers. RNA in situs with a Gal4 probe were used to stain transgenic embryos representing five different enhancer predictions (rows), at four to five different stages (columns). EO044 overlaps the known expression pattern for the neighboring gene, CG8745 (FlyExpress Database). (E) Enrichment of enhancer annotations (rows) within the binding sites of each transcription factor (columns). For panels C and G gray boxes indicate no overlap. For panels D and E all values greater or less than zero are significant, FDR < 0.01.
NIH-PA Author Manuscript
NIH-PA Author Manuscript
Figure 2. Transcription factor binding site complexity
(A) Number of TFBS (left y-axis, black circles) and distribution of genomic annotation classes (right y-axis, colors) as a function of TFBS complexity (x-axis). (B) TFBS
enrichment (color scale, depleted in blue, enriched in red) of TFBS sorted by TF binding site complexity (x-axis) within annotated enhancers (CM: cardiac mesoderm, Ht: heart muscle, SM: somatic muscle; VM: visceral muscle.), HDAC binding sites, early embryo chromatin marks. At top is a heatmap depicting nucleosome density as a function of TFBS complexity.
NIH-PA Author Manuscript
NIH-PA Author Manuscript
Figure 3. Transcription factor binding site overlap
Pairwise TFBS enrichment/depletion (colour coded by Z-score). TFBS datasets labeled at left. Selected interactions described in the text are highlighted.