Publisher’s version / Version de l'éditeur:
Journal of the Acoustical Society of America, 80, 1, pp. 199-205, 1986-07
READ THESE TERMS AND CONDITIONS CAREFULLY BEFORE USING THIS WEBSITE. https://nrc-publications.canada.ca/eng/copyright
Vous avez des questions? Nous pouvons vous aider. Pour communiquer directement avec un auteur, consultez la première page de la revue dans laquelle son article a été publié afin de trouver ses coordonnées. Si vous n’arrivez pas à les repérer, communiquez avec nous à [email protected].
Questions? Contact the NRC Publications Archive team at
[email protected]. If you wish to email the authors directly, please see the first page of the publication for their contact information.
NRC Publications Archive
Archives des publications du CNRC
This publication could be one of several versions: author’s original, accepted manuscript or the publisher’s version. / La version de cette publication peut être l’une des suivantes : la version prépublication de l’auteur, la version acceptée du manuscrit ou la version de l’éditeur.
Access and use of this website and the material on it are subject to the Terms and Conditions set forth at
Auditorium acoustics measures from pistol shots
Bradley, J. S.
https://publications-cnrc.canada.ca/fra/droits
L’accès à ce site Web et l’utilisation de son contenu sont assujettis aux conditions présentées dans le site LISEZ CES CONDITIONS ATTENTIVEMENT AVANT D’UTILISER CE SITE WEB.
NRC Publications Record / Notice d'Archives des publications de CNRC:
https://nrc-publications.canada.ca/eng/view/object/?id=4685b394-ba03-48e0-b838-a71778b6db2e https://publications-cnrc.canada.ca/fra/voir/objet/?id=4685b394-ba03-48e0-b838-a71778b6db2eSer
THlN21d
National
Rescbarcll
Consel natlonal
no.
1395
I*
W u i C m a d a
der~t2he-C-
Institute for
lnstitut de
Research in
recherche
en
Construction
construction
Auditorium Acoustics Measures
from
Pistol Shots
by J.S. Bradley
Reprinted from
Journal of the Acoustical Society of America
Vol. 80, No.
1,July 1986
p. 199-205
(IRC Paper No. 1395)
Price $2.00
NRCC 26200
Ce document d6crit en detail une dthode de calcul precise de diverses mesures acoustiques de tir au pistolet dans des
auditoriums. Les rapports du son initial/final, les dudes
d'amortissement, le temps central, et lea fonctions de transfert de modulation sont calculis par octaves. Les mesures relevees dans des conditions acoustiques tr2s diverses sont
comparees aux simples predictions et l'on constate que
certaines valeurs trouvges sont fortement lides les unes aux autres.
~umtorium
acoustics
rnea~ul-es
from pistol shots
J. S . Bradley
Division of Building Research, National Research Council of Canada, Ottawa, Canada KIA OR Received 8 April 1985; accepted for publication 21 February 1986)
Jetails of a procedure for efficiently and accurately calculating various auditorium acoustics measures from pistol shots are described. EarlyAate sound ratios, decay times, center time, and modulation transfer functions are calculated in octave bands. Measurements for a wide range of acoustical conditions are compared with simple predictions, and various quantities are found to
strongly intercorrelated.
ACS numbers: 43.55.Br, 43.55.Gx, 43.85.Gn
JCTION
A number of auditorium acoustical measures not yet in :ommon use are known to relate to the acoustical quality of ipeech or music in rooms. There is now a need to establish practical and efficient procedures that will permit these quantities to be measured in a larger number of auditoria. This paper describes procedures to obtain a wide range of nonophonic quantities from pistol shot recordings in rooms. f i e first part describes the reasoning behind the experimen- a1 procedures that were developed, while the second part considers the results of a set of measurements in five rooms chosen specifically for their quite varied acoustical condi- tions.
Reverberation time (RT) has long been the major ob- jective parameter relating to acoustical conditions in large rooms. It is still a useful descriptor of the mean properties of a room and is easily estimated from knowledge of the room materials and geometry. The early part of the decay is now known to relate more closely to subjective evaluations,' and so it too should be considered. Early decay time (EDT), measured over the first 10 dB of decay and extrapolated to 60 dB, is thus a useful measure that relates to subjective judg- ments. EarlyAate sound ratios have been shown to relate to the degree of clarity or definition for music2 and also to speech intelligibility
score^.^
Cg0 (or Klarheitsmass) is the ratio of the early arriving sound energy in the first 0.08 s after the direct sound to the late sound energy arriving after 0.08 s. C,, is calculated as follows:wherep2(t) is the squared response to the pulse source. Other earlyAate ratios have been suggested with differ- ing early sound limits. Center time TS (or Schwerpunktzeit) has been proposed as an alternative to earlyAate ratios that would avoid the abrupt cutoff between early and late sound:4
The sound transmission index (STI), derived from mo- dulation transfer functions, has recently been demonstrated to relate to speech intelligibility test scores in
room^.^.^
--
Then the RT becomes increasingly large in relation to the
period of the modulation, the depth of the modulation is increasingly reduced by the acoustical properties of the room. With dominant speech modulation frequencies in the range of 3 to 4 Hz, there would be some reduction in the modulation depth in almost all real rooms. The reductions of the amplitude modulation of test signals at various acousti- cal frequencies as a function of speech modulation rate are combined to produce this one index STI.
All of these measures, except to a much lesser exten RT, vary throughout a room when either the source or re ceiver positions are changed. Thus, to evaluate a hall wit1 respect to one or more of these quantities, measurement must be made at a large number of sourc*receiver combina tions. Practical considerations suggest that to make larg numbers of measurements in a number of auditoria, a corn puterized system of data processing is almost essential. It i also important that all equipment used in the field be corn pact, portable, and function in a manner that will minimizi the time required for measurements in each hall. Withou complete consideration of these practical problems as well
a
other factors affecting the precision of the measurements results will be limited in both quantity and quality.I. PROCEDURES
It is well known that the impulse response between twc points of a linear system fully describes the properties of thc system between the points. All of the acoustical quantities o interest can be calculated from such impulse responses. Nor mally, one would want a source that produces an approxi mation to an infinitely short duration ideal impulse. Wher results are to be analyzed in octave bands, this leads to therc being much more energy in the higher frequency bands thar in the lower ones. As background noises are typically greater at lower frequencies, signal-to-noise problems can easily oc- cur at these frequencies when complete decays are required. A better optimization is to use an impulse that has acoustical energy more evenly distributed over all of the octave bands of interest, usually from 125 to 8000 Hz. It is also necessary that an impulse source be quite omnidirectional over all of these octave bands because it is impossible to correct for a directional source after impulses have been recorded.
After testing a number of sources, a 0.38 caliber blank pistol firing black powder blanks was found to best approxi-
Tate the ideal
requirement^.^
Figure 1 shows an octave bar, )ectrum of the gun in an anechoic room and the range of dues measured over all angles tested. Directional varia- ons of this source were no more than & 2.5 dB. Other guns ere found to be more directional, and smaller-caliber guns cked adequate low-frequency energy. Small details of ap- uently similar guns were found to influence the directional roperties. Spark sources, although adequately omnidirec- onal, tend to be lacking in low-frequency energy (see Fig. 5'
Ref. 8). Loudspeakers are frequently used as impulse Iurces in rooms, but they have serious disadvantages. Al- lough various techniques have been used to correct the on- cis frequency response of the lo~dspeaker,~ it is not possibleLU correct it for all angles of radiation. Generally, when the
loudspeaker is large enough to radiate enough power, it is at the point of becoming too directional. Satisfactory results can only be obtained by using loudspeakers for quite limited frequency ranges.'' They have the added disadvantage that they and the associated power amplifiers are quite bulky and hence much less convenient.
The accurate and reliable recording of impulses in rooms requires a high-quality tape recorder with a very large dynamic range. The new digital domestic stereo tape record- ers, such as the Technics SVP-100 that was used in this study, typically provide up to 86 dB of dynamic range with a nearly perfectly flat response from 2 to 20 kHz. With such instruments, the tape recorder is no longer a practical limit to the accuracy of the measurements.
The first step in processing the data requires filtering the puke responses into octave bands. This could be done using conventional analog filters or in software using digital filters. The use of seven parallel analog octave filters followed by rms circuits with time constants of a few milliseconds would require the digitizing of only a relatively small number of samples. The calculation of energy ratios and decay times could then be performed on a quite small computer." The original unfiltered pulse responses, however, would not then be available for other processing and visual display. For greater flexibility in this study, the recorded impulse re-
,,arises were digitized and the octave filtering performed in software.
To reproduce the very short pulses of the recorded pistol shots precisely, a very high sampling rate is required. As results in the 8-kHz octave band were desired, it was neces- sary to sample the recorded impulses at a rate such that there were at least two points per cycle at all frequencies up to the upper limit of this band. A sampling frequency of 22 627 Hz was used since it is double the upper comer frequency of the 8-kHz band. Sampling at such a high rate restricts the num- ber of data points that can be efficiently stored and pro- cessed. As this procedure was initially developed on a small minicomputer, each digitized pulse was limited to 24 000 samples corresponding to just over 1 s of data and a small pre-trigger portion to allow detection of background noise problems.
The digital filtering of the recorded signal into octave bands was performed using a combination of high- and low- pass filters, l 2 as shown in the flow chart of Fig. 2. By decima-
tion of the signal (reducing the number of points by a factor of 2 ) after each octave, the same sets of filter coefficients for the high- and low-pass filters can be used over again for each successive octave band. The program stores two different time records, labeled A and B on the flow chart. A contain! all frequencies up to and including the current octave band B contains only the frequencies of the current octave band On digitizing, the analog low-pass antialiasing filters serve! to limit the upper end of the 8-kHz band. After processin!
ANALOG ANTI-ALIASING FILTER CALCULATION OUTPUT DECIMATION I A
0
5
1 2 5 2 5 0 5 0 0 1 . O K 2 . O K 4 . O K 8 . O K AI "
TIME RECORD CONTAINING FREQUENCIES UP TO AND INCLUDING THE CURRENT BANDF R E Q U E N C Y . H z B TIME RECORD CONTAINING FREQUENCIES OF ONLY THE CURRENT
BAND
FIG. 1 . Octave band spectrum of 0.38 caliber gun in an anechoic room for 0"
incidence and range of values for other angles. FIG. 2. Computer processing flow chart.
wlth the high-pass filter routine, the B time record corre- sponding to the pulse response in the 8-kHz octave band is created. From this B time record, the acoustical measures for the octave band are calculated. Subsequently, time re- cord A is low-pass filtered to remove information at frequen- cies in the current octave band. This record is then deci- mated so that there are half as many data-points, and then the same high-pass filter effectively functions 1 oct lower in frequency than in the previous pass. A new record B is creat- ed and the next lower octave band results are calculated. The program continues to loop around until the results in all seven octave bands have been calculated.
Calculation of various earlyAate ratios is a straightfor- I
ward matter involving summing pressure squared values over various time periods. As each quantity is a ratio of ener- gy sums from different parts of the same decay, there is no
I
need to calibrate the records in terms of absolute sound pres-
I
I sures. EarlyAate ratios with 0.035, 0.050, and 0.080 s early
I sound interval limits were calculated and are referred to as C,,, C,,, and C,,, respectively. TS or center time was also calculated.
The Schroeder integrated impulse method13 was used to obtain decay curves from which RT and EDT values could be calculated. Using a least-squares best fit, RT values were calculated from the first 30 dB of decay and EDT values from the first 10 dB of decay. By the Schroeder method, the impulse response is integrated in reverse time to produce a smooth decay curve equivalent to the ensemble average de- cay curve. Because of the fixed approximately 1 s time win- dow of data, this procedure presents some programming problems. If the decay is much shorter than 1 s and there is a moderate amount of background noise, then the accumulat- ed effect of integrating the background noise seriously de- creases the available useful decay range by artificially in- creasing the levels in the later parts of the decays. If the reverberation time is much longer than the 1 s time window of data, the integrated impulse decay curve will curve down- ward towards the end of the 30 dB interval used to calculate RT values. To minimize such problems, a two-pass tech- nique was used where the first approximation of the EDT value was used only to choose an appropriate shorter time window for the data. Limiting the time window to about two-thirds of the reverberation time seemed to produce opti- mum results.
1
Schroeder14 has shown that the complex modulation transfer function can be calculated from an impulse responseI by the following equation:
where the first integral is the Fourier transform of the squared impulse response h 2(t). In performing the calcula- tions, the gun source is assumed to approximate an ideal impulse and h (t) is replaced by p2 ( t )
,
the squared pressure response to the gun pulses. If one takes the magnitude of each complex pair, one obtains modulation transfer function values ranging from 0 to 1.0 at each modulation frequency f (where f = o/2n) that are comparable to values obtained from steady-state methods. For each of the seven acousticaloctave bands, modulation transfer function values were cal- culated in 14 speech modulation 1/3 octave bands from 0.63 to 12.5 Hz. To convert the modulation transfer function val- ues at discrete o into 1/3-octave values, the frequency reso- lution of the discrete modulation frequencies must be small enough that there are several values in each of the 1/3 octave bands. The frequency resolution of a Fourier transform spectrum is given by
In the present case, the sampling frequencyf, is fixed at 22 627 Hz. Only the number of points n can be increased by adding zeroes to the pulse record. It is necessary, however, to increase the record length by a considerable amount to even approach an adequately small frequency resolution. For ex- ample, if the record is padded to a length of 128 k points
( 128
x
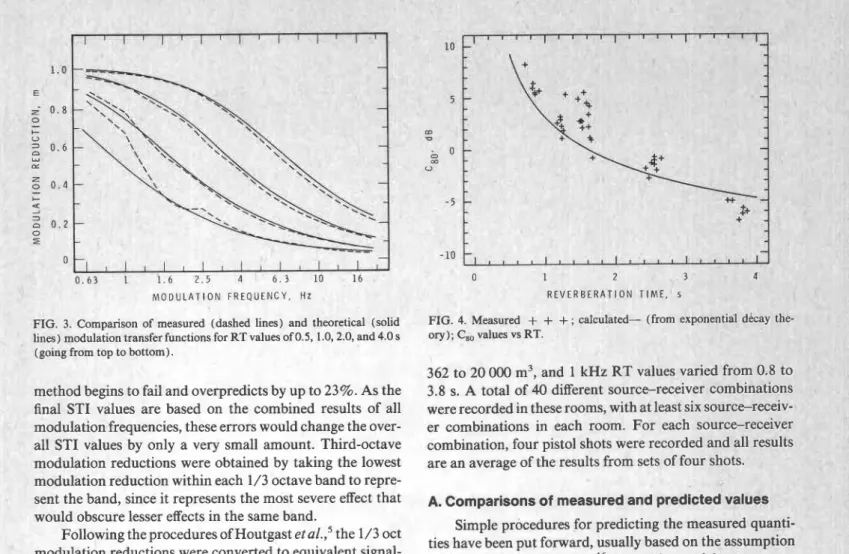
1024 points), then the resulting frequency resolution would be 0.173 Hz. Performing a 128-k transform requires a large computer and considerable computer time if large numbers of pulses are to be processed. A much more efficient approach is possible by using p technique demonstrated by Chu15 in which long transforms are performed in parts. With this method the first part yields the lowest frequency compo- nents. For the present problem, only the lowest frequency components are required. As a final compromise, this meth- od was used to obtain only the first 2-k point part of a 64-k point transform. A result equivalent to a 128-k transform was then obtained by interpolating between each pair of successive frequency components without requiring the cre- ation and storage of a 128-k point array. Even this approach incorporated into the same program with the octave band digital filters required a quite powerful 32-bit minicomputer. Alternatively, one could first modify the time record to pre- serve only the low-frequency information. For example, one could low-pass filter the record to 177 Hz ( 1 1 3 13/64) and effectively reduce the sampling rate by taking only each 64th point. If the resulting 375 points were padded with zeros to 2-k points, a frequency resolution of 0.173 Hz would again be achieved.To verify the success of the calculation method, com- parisons were made with published theoretical modulation transfer functions for ideal exponential decays. Figure 3 compares the results obtained from processing synthesized exponential decays with theoretical results (from Fig. 5 of Ref. 5) for RT values of 0.5, 1.0,2.0, and 4.0 s plotted as the modulation reduction versus modulation frequency. (Hout- gast et aL5 used modulation reduction to describe the reduc- tion in the amplitude modulation of a test signal. A value of 1.0 corresponds to no reduction; a value of 0.0 correspond- ing to complete reduction, so that there is no modulation left.) The agreement is excellent for all but the longest rever- beration time. For a 4.0-s RT, the 1 s of actual data (before padding with zeros) is not long enough for accurate deter- mination of modulation reductions at modulation frequen- cies of 1 Hz and lower. Modulations in speech are strongest at frequencies of 3 to 4 Hz. Therefore, the calculation proce- dure works very well in all typical situations. It is only for combinations of unusually long reverberation times and much lower than average modulation frequencies that the
1
201 J. Acoust. Soc. Am., Vol. 80, No. 1, July 1986 J. S. Bradley: Auditorium acoustics measures from pistol shots ,201M O D U L A T I O N F R E Q U E N C Y . HZ
FIG. 3. Comparison of measured (dashed lines) and theoretical (solid lines) modulation transfer functions for RT values of 0.5, 1.0,2.0, and 4.0 s
(going from top to bottom).
method begins to fail and overpredicts by up to 23%. As the final ST1 values are based on the combined results of all modulation frequencies, these errors would change the over- all ST1 values by only a very small amount. Third-octave modulation reductions were obtained by taking the lowest modulation reduction within each 1/3 octave band to repre- sent the band, since it represents the most severe effect that would obscure lesser effects in the same band.
Following the procedures of Houtgast et the 1/3 oct
modulation reductions were converted to equivalent signal-
to-noise ratios, limited to
+
15 dB, and averaged over all themodulation frequency bands. Finally, these mean limited signal-to-noise ratios were transformed to ST1 values rang- ing from 0 to 1.0, and the individual results of each of the octave bands from 125 to 8 kHz were weighted and assumed to an overall single ST1 value in a manner similar to the
calculation of articulation index ( AI) values.
1 2 3
R E V E R B E R A T I O N T I M E , S
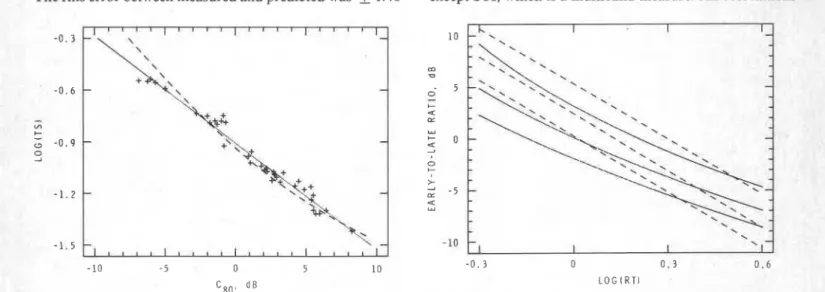
FIG. 4. Measured
+ +
+
; calculated- (from exponential dkcay tht ory); C,, values vs RT.362 to 20 000 m3, and 1 kHz RT values varied from 0.8 tc
3.8 s. A total of 40 different source-receiver combination
were recorded in these rooms, with at least six source-receiv er combinations in each room. For each source-receive combination, four pistol shots were recorded and all result are an average of the results from sets of four shots.
A. Comparisons of measured and prearctea values
Simple procedures for predicting the measured quanti ties have been put forward, usually based on the assumptio of ideal exponential decays.16 In practice, real decays are nc ideal exponential decays. The initial part of real decays i usually made up of a small number of discrete pulses; the fu decay may or may not closely follow an exponential curve. I is therefore useful to examine how closely such simple prt diction methods agree with the present measured value! One can derive analytical expressions for earlyAate arrivin sound ratios by the integration of an exponential decay of the
II. COMPARISONS OF MEASURES form
To ensure that the results of the comparisons of mea- p2(t) = Ae-'IT, (5)
sures are generally applicable, pulse measurements were where the time constant T = RTA3.8 15. Then for an early
made in five rooms chosen to cover a wide range of room time limit t, by substituting Eq. ( 5 ) in Eq. ( 1 ), the corre-
sizes and reverberation times. Room volumes ranged from sponding earlyflate arriving sound ratio is given by
TABLE I. Mean and rms differences between measured values and predictions based on ideal exponential decays. Mean differences Measure 125 Hz 250 Hz 500 Hz 1 kHz 2 kHz 4 kHz 8 kHz rms differences c 3 5 5.15 3.68 3.42 2.69 2.27 2.28 2.64 Cso 4.23 3.26 2.91 2.47 2.09 2.24 2.91 c80 2.47 3.07 2.74 2.21 1.88 2.03 2.80
1 2 3
R E V E R B E R A T I O N T I M E , s
- 1 0 - 5 0
C s O M E A S U R E D
FIG. 5. Measured
+
+ +
; calculated --- (from exponential decay the- FIG. 7. Predicted vs measured C,, values with Barron's equation. Mea- ory); and the best fit regression line to the measured values, -, of TS vs RT. sured values+
+ +
; best fit regression line-
; and line of equalitybetween measured and predicted ---.
tive in the 125-Hz octave band due to the seat dip effe~t""~ in at least some of the rooms. By this phenomenon, sound passing over the audience at near-grazing incidence is selec- tively attenuated at lower frequencies. This reduction in the early sound energy in the 125-Hz octave band causes the early/late ratios to tend to be lower than predicted by the simple ideal exponential decay predictions.
The rms differences in Table I are also smallest for the 2- kHz octave band, increasing in magnitude for higher and lower frequency bands. The rms differences also increase as the early time limit decreases. If these rms differences are considered as prediction errors, then at 1 kHz one would expect to predict the three earlyAate ratios with an error of
+
2 to 3 dB.Figure 5 compares measured and calculated TS values as a function of RT. Here the best fit regression line, the solid line, agrees quite closely with the calculated relation shown
by the dashed line. Table I indicates a tendency for the calcu-
lated values to underpredict the measured values, since the mean differences are negative. Although for TS there is again a minimum in the mean difference at 2 kHz, the 125- Hz values had a smaller mean difference. The rms differ- ences were smallest at 4 kHz for TS values and, at 1 kHz, measured values could be predicted with a prediction accu-
racy of 0.023 s. As the mean TS value at 1 kHz was 0.124,
this corresponds to an error of
+
18.5%.Similarly, one can derive an analytical expression for TS, assuming an ideal exponential decay of infinite duration and
time constant T by substituting Eq. (5) in Eq. (2)
TS = RT/13.815. ( 7 )
Figure 4 compares calculated and measured C,, values as a function of RT. It may be seen that there is a tendency for the measured values to be above the curve of calculated values, particularly for smaller RT values. Similar results were obtained for C,, and C,, values, with increasing scatter in the earlyAate ratios as the early time limit became shorter; Table I summarizes these comparisons for all octave bands. Both the mean and differences between measured and calcu- lated values are given. The mean difference at 1 kHz for C,, values was 1.28 dB, indicating that measured values tended to be greater than calculated values as observed for the same data in Fig. 4. Thus the mean differences indicate whether the calculated curves tend to under- or overpredict mea- sured values. The smallest mean differences occurred at 2 kHz for all three ratios. The mean differences became nega-
TABLE 11. Correlation coefficients for correlations between I-kHz ma-. sures N = 40. C3, C5, CgO TS EDT RT ST1 - - EDT - 0.866 - 0.913 - 0.952 0.986 RT - 0.871 - 0.908 - 0.943 0.983 0.992 ST1 0.902 0.941 0.960 - 0.909 - 0.936 - 0.938 0 1 2 3 4 R E V E R B E R A T I O N T I M E , s ( 1 k H z )
FIG. 6. Measured
+
+
+
; calculated - ; ST1 vs RT.TABLE 111. ,ession results for measured data. Interc rrelation :fficient itandard leviation lndepende variable Slope log (RT) log (RT) log ( RT) log (TS)
c,,
Houtgast et ~ 1 . ~ calculated ST1 as a function of reverber- ation time, assuming ideal exponential decays. Figure 6 compares measured and calculated ST1 values. The calculat- ed curve is from the no-noise case of Fig. 8 of Ref. 5. Of course, the calculations would assume identical RT values in all octave bands, which is not true for the measured values. Nevertheless, Fig. 6 indicates that ST1 values can be predict- ed approximately as well as the other measures and indicates that there is a tendency to underpredict the measured values. This would correspond to underpredicting the C,, values in Fig. 4. The rms differences indicate that one could predict ST1 values with an accuracy of
+
0.075 using the measured RT at 1 kHz.Since these newer acoustical measures are expected to vary from seat to seat in an auditorium, it is clear that predic- tions based only on RT values and an assumed ideal expo- nential decay cannot be completely satisfactory. In a recent paper, Barron16 has proposed a method for predicting C,, values which requires the room volume, the source-receiver distance, and the RT as input. Figure 7 plots measured C,, values versus predicted values using Barron's method [Eq.
(7), Ref. 161. Both the least-squares regression line (the solid line) and the line representing equality between mea- sured and calculated values (the dashed line) are shown. The rms error between measured and predicted was
+
1.48dB, which is slightly larger than the 1.4-dB rms error that Barron reported, but smaller than the 2.2 1 dB given in Table I for the simple exponential decay theory. Thus Barron's procedure is an improvement, but the results of Fig. 7 sug- gest that there still may be a small systematic error between measured and predicted values that might yet be included in some future prediction scheme.
In an attempt to achieve a more accurate prediction of
C,, values using the same parameters as Barron, a multiple linear regression analysis was performed regressing C,, val- ues on RT, room volume, and source-receiver distance. The following regression coefficients were obtained:
C,, = - 3.499
.
RT+
0.000 141 1.V- 0.082 04where V is the room volume in m3 and D is the source- receiver distances in m.
The rms prediction error was reduced to 1.05 dB using this equation.
B. Interrelations between measures
As was expected, many of the newer measures were quite highly correlated with each other. Table I1 gives the correlation coefficients between all the measures reported in this study. All correlations are for the 1-kHz octave band except STI, which is a multiband measure. All correlations
-1.5
- 1 0 - 5 0 5 1 0 - 0 . 3 0 0.3 0.6
C E O , d B L O G ( R T 1
FIG. 9. Early/late ratio values vs the logarithm of RT; solid lines from ex- FIG. 8. Logarithm of TS vs C,,; measured values
+
+ +
; best fit regres- ponential decay predictions; dashed lines from best fit regression lines to sion line - ; and exponential decay predictions ---. measured values. Curves are for C,,, C,,, and C,, from bottom to top.are highly significant. It is seen that ST1 is most highly corre- lated with C,,, and TS is most strongly correlated with C,,,
EDT, and RT. Although TS, EDT, and ST1 are each derived by quite different calculation procedures, they are all strong- ly correlated with the more established C,, (correlation co-
efficients >0.95). The various earlyAate ratios are most strongly correlated when the early time limits are most simi- lar.
With such strongly correlated measures, knowledge of one quantity suggests that one could approximately predict one of the other quantities. Table I11 give the results of fitting regression lines to a number of approximately linear rela- tionships. The slopes and intercepts of the regression lines are given along with the corresponding correlation coeffi- cients and the standard deviations of the results about the regression lines. As an example, Fig. 8 shows the approxi- mately linear relationship between C,, values and the loga- rithm of the TS values at 1 kHz. The solid line is the best fit regression line while the dashed line is the relationship de- rived from ideal exponential decays. If the exponential decay predictions are based on integration to 1.0 s rather than to
oo
,
there is improved agreement with measurements at thelowest C,, values.
For the relationships between earlyAate ratios and the logarithm of the reverberation time, the best fit regression lines (dashed lines in Fig. 9) and the curves derived from ideal exponential decays (solid lines) do not agree as closely. For shorter RT values, the exponential decay predictions tend to underpredict and the dashed lines are all several dB above the solid lines for an RT of 0.5 s. Very approximately, one can estimate C,, and C,, values for C,, values by sub- tracting 3 and 5 dB, respectively.
Ill. CONCLUSIONS
A method that allows the accurate and efficient calcula- tion of various newer auditorium acoustics measures has been demonstrated. As the source was approximately omni- directional over the octave bands from 125 to 8 kHz, results were obtained simultaneously in seven octave bands, and can be compared to predictions that assume an omnidirectional source or to other measurements made with an approximate- ly omnidirectional source. The efficiency of the data gather- ing and the resulting computer proces'sing make it possible to obtain results for a number of different sourc+receiver posi- tions in each auditorium. By completely processing the re- sults with software, the original pulse response is always available for other types of calculation. In this study it was possible to calculate decay times and early/late ratios, as well as modulation transfer functions from the same digi- tized pulses.
Comparisons between measured values and calculated -ralues based on ideal exponential decays showed that such redictions are not particularly accurate but give a rough
indication of the mean trends. A newer method by Barron was found to predict C,, values a little more accurately. All of the measures calculated were strongly correlated with each other. Thus measures with quite different derivations such as C,,, TS, EDT, and ST1 all measure similar aspects of the same physical properties of a room. It is necessary to consider how well each measure is related to subjective eval- uations or to speech intelligibility test scores to determine which is most appropriate in a particular situation.
ACKNOWLEDGMENTS
This paper is a contribution from the Division of Build- ing Research, National Research Council of Canada and is published with the approval of the Director of the Division. The author would like to thank Reina Larnothe for her considerable assistance with programming and processing of the data, and the National Arts Centre, in Ottawa, Canada for its cooperation and assistance.
'B. S. Atal, M. R. Schroeder, and G. M. Sessler, "Subjective reverberation time and its relation to sound decay," Proceedings of the 5th ICA, Liege, Paper G32 ( 1965).
'W. Reichardt and U. Lehman, "Optimierung von Raumeindruck und durchsichtigkeit von musikdarbietungen durch auswertung von impuls- shalltests," Acustica 48, 174-185 ( 1981).
'J. P. S. Lochner and J. F. Burger, "The influence of reflections on auditor- ium acoustics," J. Sound Vib. 1(4), 426454 ( 1964).
4S. StrQm, "Concert Hall Acoustics," University of Trondheim, Norway, ELAB Report STF44, A82006 ( 1982).
'T. Houtgast, H. J. M. Steeneken, and R. Plomp, "Predicting speechintelli- gibility in rooms from the modulation transfer function. I. General room acoustics," Acustica 46, 60-72 ( 1980).
6H. J. M. Steeneken and T. Houtgast, "A physical method for measuring speech transmission quality," J. Acoust. Soc. Am. 67, 318-326 (1980). 'M. J. R. Lamothe and J. S. Bradley, "Acoustical characteristics of gunsas
impulse sources," Can. Acoust. 13(2), 16-24 ( 1985).
'H. G. Latham, "The signal-to-noise ratio for speech intelligibility-An auditorium acoustics design index," Appl. Acoust. 12(4), 253-320 (1979).
9J. C. Davies, J. McIntosh, and K. A. Mulholland, "The generation of short duration acoustic signals," J. Sound Vib. 76( 1 ), 77-82 ( 1981 ).
'OM. Barron, "Impulse testing techniques for auditoria," Appl. Acoust. 17, 165-181 (1984).
'
'J. S. Bradley, "Experience with new auditorium acoustic measurements," J. Acoust. Soc. Am. 73,2051-2058 (1983).I2R. K. Otnes and L. Enochsen, Applied Timeseries Analysis (Wiley, New
York, 1978).
''M. R. Schroeder, "New method of measuring reverberation time," J. Acoust. Soc. Am. 37,409412 ( 1965).
I4M. R. Schroeder, "Modulation transfer functions: Definition and mea- surement," Acustica 49(3), 179-182 ( 198 l ) .
"W. T. Chu, "A technique for zoom transform and long-time signal analy- sis," Can. Acoust. 11(3), 45-50 (1983).
I6M. Barron and L-J. Lee, "Energy relations in concert auditoria. I," J. Acoust. Soc. Am. (submitted).
"T. J. Schultz and B. G. Watters, "Propagation of sound across audience seating," J. Acoust. Soc. Am. 36, 885-896 (1964).
18G. M. Sessler and J. E. West, "Sound transmission over theater seats," J. Acoust. Soc. Am. 36, 1725-1732 (1964).
T h i s paper
i s
being d i s t r i b u t e d i n r e p r i n t form by t h e I n s t i t u t e f o r Research i n Construction. A l i s t of b u i l d i n g p r a c t i c e and r e s e a r c h p u b l i c a t i o n s a v a i l a b l e from t h e I n s t i t u t e may be obtained by w r i t i n g t o t h e P u b l i c a t i o n s Section, I n s t i t u t e f o rResearch i n Construction, National Research
C o u n c i l of Canada, O t t a w a , O n t a r i o ,
K1A
OR6.Ce document e s t d i s t r i b u g sous forme de
t i r e - & p a r t p a r l V I n e t i t u t de recherche en
c o n s t r u c t i o n . On peut o b t e n i r une l i s t e
d e s p u b l i c a t i o n s de l l I n s t i t u t p o r t a n t s u r
les
techniques oules
recherches enmatiere
de bstiment en Bcrivant
3
l a Section d e sp u b l i c a t i o n s , I n s t i tu t de recherche en
c o n s t r u c t i o n , C o n s e i l n a t i o n a l d e
recherches du Canada, Ottawa (Ontario),