HAL Id: hal-03155461
https://hal.inrae.fr/hal-03155461
Submitted on 1 Mar 2021
HAL is a multi-disciplinary open access
archive for the deposit and dissemination of
sci-entific research documents, whether they are
pub-lished or not. The documents may come from
teaching and research institutions in France or
abroad, or from public or private research centers.
L’archive ouverte pluridisciplinaire HAL, est
destinée au dépôt et à la diffusion de documents
scientifiques de niveau recherche, publiés ou non,
émanant des établissements d’enseignement et de
recherche français ou étrangers, des laboratoires
publics ou privés.
Distributed under a Creative Commons Attribution| 4.0 International License
dairy cattle
Thierry Tribout, Pascal Croiseau, Rachel Lefebvre, Anne Barbat, Mekki
Boussaha, Sébastien Fritz, Didier Boichard, Chris Hoze, Marie-Pierre Sanchez
To cite this version:
Thierry Tribout, Pascal Croiseau, Rachel Lefebvre, Anne Barbat, Mekki Boussaha, et al..
Con-firmed effects of candidate variants for milk production, udder health, and udder morphology in dairy
cattle. Genetics Selection Evolution, BioMed Central, 2020, 52 (1), �10.1186/s12711-020-00575-1�.
�hal-03155461�
RESEARCH ARTICLE
Confirmed effects of candidate variants
for milk production, udder health, and udder
morphology in dairy cattle
Thierry Tribout
1, Pascal Croiseau
1, Rachel Lefebvre
1, Anne Barbat
1, Mekki Boussaha
1, Sébastien Fritz
1,2,
Didier Boichard
1, Chris Hoze
1,2and Marie‑Pierre Sanchez
1*Abstract
Background: Over the last years, genome‑wide association studies (GWAS) based on imputed whole‑genome sequences (WGS) have been used to detect quantitative trait loci (QTL) and highlight candidate genes for important traits. However, in general this approach does not allow to validate the effects of candidate mutations or determine if they are truly causative for the trait(s) in question. To address these questions, we applied a two‑step, within‑breed GWAS approach on 15 traits (5 linked with milk production, 2 with udder health, and 8 with udder morphology) in Montbéliarde (MON), Normande (NOR), and Holstein (HOL) cattle. We detected the most‑promising candidate variants (CV) using imputed WGS of 2515 MON, 2203 NOR, and 6321 HOL bulls, and validated their effects in three younger populations of 23,926 MON, 9400 NOR, and 51,977 HOL cows.
Results: Bull sequence‑based GWAS detected 84 QTL: 13, 10, and 30 for milk production traits; 3, 0, and 2 for somatic cell score (SCS); and 8, 2 and 16 for udder morphology traits, in MON, NOR, and HOL respectively. Five genomic regions with effects on milk production traits were shared among the three breeds whereas six (2 for production and 4 for udder morphology and health traits) had effects in two breeds. In 80 of these QTL, 855 CV were highlighted based on the significance of their effects and functional annotation. The subsequent GWAS on MON, NOR, and HOL cows validated 8, 9, and 23 QTL for production traits; 0, 0, and 1 for SCS; and 4, 1, and 8 for udder morphology traits, respectively. In 47 of the 54 confirmed QTL, the CV identified in bulls had more significant effects than single nucleo‑ tide polymorphisms (SNPs) from the standard 50K chip. The best CV for each validated QTL was located in a gene that was functionally related to production (36 QTL) or udder (9 QTL) traits.
Conclusions: Using this two‑step GWAS approach, we identified and validated 54 QTL that included CV mostly located within functional candidate genes and explained up to 6.3% (udder traits) and 37% (production traits) of the genetic variance of economically important dairy traits. These CV are now included in the chip used to evaluate French dairy cattle and can be integrated into routine genomic evaluation.
© The Author(s) 2020. This article is licensed under a Creative Commons Attribution 4.0 International License, which permits use, sharing, adaptation, distribution and reproduction in any medium or format, as long as you give appropriate credit to the original author(s) and the source, provide a link to the Creative Commons licence, and indicate if changes were made. The images or other third party material in this article are included in the article’s Creative Commons licence, unless indicated otherwise in a credit line to the material. If material is not included in the article’s Creative Commons licence and your intended use is not permitted by statutory regulation or exceeds the permitted use, you will need to obtain permission directly from the copyright holder. To view a copy of this licence, visit http://creat iveco
mmons .org/licen ses/by/4.0/. The Creative Commons Public Domain Dedication waiver (http://creat iveco mmons .org/publi cdoma in/
zero/1.0/) applies to the data made available in this article, unless otherwise stated in a credit line to the data.
Background
The increasing amount of whole-genome sequence (WGS) data for bovine species [1,2], combined with the
regular use of high-throughput genotyping for genomic selection in cattle, has made it possible to run genome-wide association studies (GWAS) directly on imputed sequence data in large cohorts of animals for complex traits of economic importance. Since the first GWAS on imputed WGS in dairy cattle published 6 years ago [2,3], several sequence-based GWAS have been conducted in dairy or beef cattle. However, in their review of the
Open Access
*Correspondence: marie‑pierre.sanchez@inrae.fr
1 Université Paris‑Saclay, INRAE, AgroParisTech, GABI, 78350 Jouy‑en‑Josas,
France
applications and outcomes of the “1000 Bull Genomes” project, Hayes and Daetwyler [4] noted that, even if the majority of polymorphisms within a cattle popula-tion can be tested using readily available whole-genome sequence data, the unambiguous identification of an indi-vidual mutation as causative for a complex trait remains the exception rather than the norm. GWAS on imputed WGS enables the targeting of small genomic regions such as genes, but the identification of causal polymor-phisms is much less straightforward. Difficulties in pin-pointing causal mutations arise from (i) the long-range linkage disequilibrium (LD) that exists in cattle breeds, which usually results in the detection of a set of variants in high LD rather than a single causal variant, (ii) vari-ability in imputation accuracy, which may favor a variant in LD with the causal mutation rather than the mutation itself, and (iii) poor annotation of the bovine genome, in particular in regulatory regions, which makes it difficult to distinguish the best functional candidate in a set of variants.
Beyond providing a better understanding of the under-lying biology of complex traits, the identification of causal mutations could be beneficial for genomic evalu-ation, especially across populations. The integration of causal mutations into genomic evaluation models could increase the accuracy of predictions and ensure the per-sistence of these models across generations or for dis-tantly related individuals [5]. Models that have been developed in major breeds might then be more easily transposed to smaller breeds, for which accurate genomic evaluation is difficult to implement. In addition, models with causal variants can account for interactions between genes more easily. However, to avoid the integration of false-positive candidate variants into models, their effects must first be validated in other populations that are as independent as possible. The Eurogenomics custom sin-gle nucleotide polymorphism (SNP) chip, which has been developed for bovine genomic selection, appears to be an ideal tool for this purpose. It contains an add-on fea-ture that can be updated once or twice a year, and it is widely used in multiple breeds [6], which makes it pos-sible to validate the effects of candidate variants detected by GWAS in different large populations.
In dairy cattle in particular, production traits are of major importance. First and foremost, high milk produc-tion is condiproduc-tioned by a good and healthy udder. Mastitis is the most important health problem in dairy cattle and has an unfavorable genetic correlation with milk yield [7,8]. Udder morphology is closely linked to sustain-able milk production and is also associated with mastitis resistance [8] and longevity [9]. Thus, there are great ben-efits to considering all of these traits in the same study.
In order to disentangle the biological relationship between these complex traits and propose candidate causative variants, the objectives of this study were to identify genes, and the polymorphisms within them, that are responsible for the genetic variation in traits related to milk production, udder health, and udder morphol-ogy in the three main French dairy cattle breeds: Hol-stein (HOL), Montbéliarde (MON), and Normande (NOR). First, we conducted within-breed GWAS using imputed WGS of bulls with performances (Part I); then, we validated the effects of the candidate causal variants highlighted in the initial detection by performing within-breed GWAS in statistically independent populations of cows (Part II).
Methods
This study comprised two parts. Part I consisted of iden-tifying QTL and candidate variants from sequence-based GWAS of three bull populations. Part II aimed at con-firming their effects by conducting a GWAS using the candidate variants from Part I and SNPs from the 50K SNP chip in three cow populations. For this study, we did not perform any experiments on animals; thus, no ethical approval was required.
Part I: Identification of candidate causative variants in bulls Animals, phenotypes, and genotypes
To identify QTL and candidate variants, GWAS were performed at the sequence level on populations of bulls from the three main French dairy cattle breeds, i.e. HOL, MON, and NOR, for which genotypes and data on daughters’ performance are available until 2014.
Bulls were genotyped with the Illumina Bovine SNP50 BeadChip (50K; Illumina Inc., San Diego, CA). Most key ancestors were genotyped at the high-density (HD) level (777k SNP, Illumina Bovine HD Beadchip; Illumina Inc., San Diego, CA) and the genome of some of them was sequenced (WGS), as shown in Table 1. We applied the following quality control filters to the 50K and HD geno-types: an individual call rate higher than 0.95, a SNP call rate higher than 0.90, a minor allele frequency (MAF)
Table 1 Number of bulls with 50k SNP (50K), 777k SNP (HD), or whole-genome sequence (WGS) genotypes in each breed
Breed 50K HD WGS Total
Holstein 6321 776 288 6321
Montbéliarde 2515 522 28 2515
higher than 0.01 in at least one breed, and genotype fre-quencies had to be in Hardy–Weinberg equilibrium with P > 10−4.
In total, we analyzed 16 (HOL and MON) or 15 (NOR) routinely collected traits:
• Five milk production traits: milk yield (MY), protein yield (PY), fat yield (FY), protein content (PC), and fat content (FC);
• Two udder health traits: somatic cell score (SCS) and clinical mastitis (CM). SCS was defined as SCS = 3 + log2(SCC/100,000) and averaged over monthly measures within lactation, with SCC being the number of somatic cells per ml of milk. CM was defined within lactation as a 0/1 trait with 1 corre-sponding to the occurrence of at least one clinical case before 150 days in milk;
• Eight udder morphology traits, recorded by a type classifier during a classification visit: udder sup-port (US), udder depth (UD), fore udder attachment (FUA), rear udder height (RUH), fore teat distance (FTD), udder balance (UB), and teat orientation (TO) in all breeds, teat length (TL) in MON and HOL. Scores, ranging from 1 to 9, were recorded only once per cow in first lactation;
• Milking speed score (MSS), a subjective appraisal ranging from 1 to 5, given by the farmer and recorded with morphology traits.
In this paper, for convenience, health traits, type traits and milking speed are referred to as udder traits.
For all traits, the phenotypes used in the analyses were the daughter yield deviations (DYD) of each bull, defined as the average value of daughters’ performance, adjusted for fixed and non-genetic random effects and for the breeding value of their dams [10]. DYD are produced by the French national genetic evaluation systems of HOL, MON, and NOR populations with the models described at https ://inter bull.org/ib/gefor ms [11]. Mean reliabili-ties for all traits, excluding CM, ranged from 0.74 to 0.94, depending on the breed and on the trait (Table 2). Mean reliabilities for CM were lower (0.40 for NOR, 0.43 for MON and HOL), which was a result of both the lower heritability (about 0.02) of this trait and the fact that it began being recorded on farms more recently than other traits.
Imputation to whole‑genome sequences
Using the UMD3.1 assembly, genotypes of all bulls were imputed to WGS with the FImpute software, which accu-rately and quickly processes large datasets [12]. A two-step process was performed in order to improve imputation accuracy: from 50K to HD, and then from HD to WGS [13]. All imputations were performed separately for each breed using either a breed-specific (from 50K to HD SNPs) or a multi-breed (from HD SNPs to WGS) reference panel depending on the targeted density [14]. In each breed, imputations to the HD SNP level were performed using a
Table 2 Number of bulls with genotypes and phenotypes (DYD) and average reliability of their phenotypes for each trait, in Montbéliarde (MON), Normande (NOR), and Holstein (HOL) cattle
Type of trait Trait and abbreviation Number of bulls with DYD Reliability of DYD mean (sd)
MON NOR HOL MON NOR HOL
Milk production Milk yield (kg) MY 2434 2175 6262 0.91 (0.09) 0.89 (0.11) 0.92 (0.05)
Fat content (%) FC 2434 2175 6262 0.93 (0.08) 0.92 (0.10) 0.94 (0.04)
Protein content (%) PC 2434 2175 6262 0.93 (0.08) 0.92 (0.10) 0.94 (0.04)
Fat yield (kg) FY 2434 2175 6262 0.91 (0.09) 0.89 (0.11) 0.92 (0.05)
Protein yield (kg) PY 2434 2175 6262 0.91 (0.09) 0.89 (0.11) 0.92 (0.05)
Udder health Clinical mastitis CM 1857 1427 4959 0.43 (0.21) 0.40 (0.22) 0.43 (0.21)
Somatic cell score SCS 2438 2203 6318 0.87 (0.07) 0.85 (0.07) 0.88 (0.06)
Udder morphology Udder support US 2494 2180 6311 0.83 (0.07) 0.87 (0.06) 0.82 (0.08)
Udder depth UD 2511 2020 6319 0.90 (0.05) 0.83 (0.07) 0.88 (0.06)
Fore udder attachment FUA 2500 2164 5959 0.86 (0.07) 0.82 (0.07) 0.83 (0.08)
Rear udder height RUH 2498 2147 6107 0.85 (0.07) 0.74 (0.10) 0.80 (0.09)
Teat length TL 2515 – 6321 0.92 (0.05) – 0.89 (0.05)
Fore teat distance FTD 2509 2032 6319 0.89 (0.06) 0.86 (0.07) 0.88 (0.06)
Udder balance UB 2478 2164 6275 0.77 (0.09) 0.81 (0.08) 0.81 (0.09)
Teat orientation TO 2500 2175 6318 0.86 (0.06) 0.85 (0.06) 0.85 (0.07)
within-breed reference population that included, respec-tively, 522 MON, 546 NOR, and 776 HOL bulls that had been genotyped with the Illumina BovineHD BeadChip (Illumina Inc., San Diego, CA). WGS variants were imputed from HD SNP genotypes using WGS variants of the 1147
Bos taurus bulls from Run4 of the 1000 Bull Genomes
Project [1]; these bulls represented 27 cattle breeds, and included 288 HOL, 28 MON, and 24 NOR individu-als. WGS variants were selected by applying the protocol defined by the 1000 Bull Genomes consortium [1,2]. First, short reads were filtered for quality and aligned to the UMD3.1 reference sequence [15], and small genomic vari-ations (SNPs and InDels) were detected using SAMtools 0.0.18 [16]. Raw variants were then filtered as described in Boussaha et al. [15] to produce a dataset of 26,738,438 autosomal variants. Finally, filtered variants were anno-tated using the Ensembl variant effect predictor pipeline v81 [17], and the effects of amino-acid changes were pre-dicted using the SIFT tool [18]. Imputation accuracies were estimated in the MON and HOL datasets by calculating genotypic concordance rates; these values reached 0.90 and 0.94, respectively [19]. Although the number of sequenced bulls was slightly lower in NOR than in MON, they con-tributed a higher proportion of the genes of the population and we assumed that imputation accuracy was similar in both breeds. Only variants with a MAF higher than 0.1% were retained for within-breed association analyses, i.e. around 12 million variants in each breed.
Whole‑genome sequence association analyses
We performed within-breed and single-trait associa-tion analyses between all 12 million polymorphic variants (MAF ≥ 0.001) and the traits described in Table 2. All asso-ciation analyses were performed using the mlma option of GCTA software (version 1.24), which applies a mixed lin-ear model that includes the variant to be tested [20]:
where y is the vector of DYD standardized by the genetic standard deviation of the trait in the considered breed ( σu_pop ); µ is the overall mean; b is the additive fixed
effect of the variant to be tested for association; x is the vector of imputed genotypes, coded 0, 1, or 2 (number of copies of the second allele); u ∼ N 0, Gσ2u is the vector of random polygenic effects, with G the genomic rela-tionship matrix (GRM) calculated using the HD SNP genotypes, and σ2
u the polygenic variance, estimated
based on the null model y = 1µ + u + e and then fixed while testing for the association between each variant and the trait of interest; and e ∼ N 0, Iσ2
e
is the vector of random residual effects, with I the identity matrix and (1)
y = 1µ + xb + u + e
σe2 the residual variance. Because the variability of DYD reliability was limited, residuals were assumed to have a homogeneous variance.
In order to account for multiple testing, the Bonferroni correction was applied to the thresholds by considering 8 million independent tests, after pruning for complete linkage disequilibrium. Therefore, the 5% genome-wide threshold of significance corresponded to a nominal
P-value of 6.3 × 10⁻⁹ (− log
10(P) = 8.2). When a given trait was significantly affected by multiple variants, the variants that were located less than 1 million base-pairs (Mbp) apart were grouped together. The bounds of the confidence intervals (CI) of each region were then deter-mined by considering the positions of variants that were included in the upper third of the peak (individual CI). For a given trait in a given breed, CI that overlapped or were less than 1 Mbp away from each other were grouped in a QTL region. For each QTL, we then defined two CI: (1) a TOP-CI determined by the bounds of the indi-vidual CI in which we found the most significant results in the region and (2) an EXT-CI with bounds deter-mined by the outermost positions after all overlapping individual CI were grouped. When only a single indi-vidual CI was present in a given region, TOP-CI and EXT-CI were identical. For each trait, the proportion of genetic variance explained by each QTL was estimated by σ2
g_QTL= 2pms(1 − pms) ˆb2ms , with pms and ˆbms the
frequency and the estimated allelic substitution effect in genetic standard deviation units, respectively, of the variant with the most significant effect ( ms ) in the QTL region.
Selection of candidate variants from sequence‑based GWAS results
Within each of the QTL regions detected in the sequence-based GWAS, we selected the most plausible variants (SNPs or small InDels) to explain the effects we observed. About 900 variants could be added on the cus-tom part of the chip. Variant selection was performed within breed, trait and individual QTL. A similar num-ber of variants was a priori allocated to each individual QTL. Consequently, due to the number of QTL finally detected, about 10 variants were selected for each indi-vidual QTL. Candidate variants with a MAF higher than 0.02 were chosen based first on the level of significance of their effect. For top variants with similar significance levels, the best candidates were discriminated based on their functional annotation with a priority for genic vari-ants in coding (missense and loss of function) and regu-latory regions. The selected variants, 855 in total, were then included on the custom part of version 6 of the Illu-mina EuroG10K BeadChip [6]. When these variants were
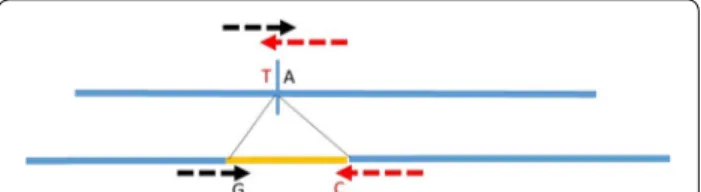
InDels, their breakpoints were tested as done for SNPs, as described in Fig. 1 [6].
Part II: Validation of the effects of candidate causative variant in cows
The second part of this study was dedicated to validat-ing the effects of these QTL regions and the candidate variants identified within them. To this end, we tested the effects of the candidate variants, as well as those of the 50K SNPs, on the performance of three statistically independent datasets of HOL, MON, and NOR cows. Genotyping and imputations
Of all the cows genotyped for the purpose of genomic selection in France, we found 51,977 HOL, 23,926 MON, and 9400 NOR cows, born from 2014, whose production and udder phenotypes were not included in the DYD calculations of bulls used in Part I. Thus, phe-notypes of bulls used in Part I and cows used in Part II were statistically independent. These cows were geno-typed using the BovineSNP50 BeadChip (Illumina Inc.) or the customized low-density EuroG10K BeadChip (versions 1 to 5; Illumina Inc.). Missing genotypes were imputed with the FImpute software [12] in a two-step procedure. Generic markers from the BovineSNP50 Beadchip were imputed using all 50K genotyped ani-mals as the reference, as per the routine procedure of the French evaluation system. Then, customized mark-ers were imputed using as a reference all males and females (with and without phenotypes) that had been genotyped using the EuroG10K BeadChip (versions 1 to 6), i.e. 52,630 HOL, 32,373 MON, and 12,316 NOR animals. After the imputation process, all cows with phenotypes had genotypes for the variants of both the 50K Beadchip and EuroG10K BeadChip version 6, including the candidate variants detected in Part I. The accuracy of imputation was assessed by calculat-ing mean squared correlations (R2) between imputed
and true genotypes in a validation set of variants with MAF ≥ 1%; these values were equivalent in the three breeds and reached on average 97% for the 50K SNPs and 96% for the CV.
GWAS analyses
Single-trait association analyses were performed between all of the polymorphic variants of the 50K and EuroG10K Beadchips with MAF ≥ 1% (46,753, 44,832, and 44,659 SNPs in HOL, MON and NOR, respectively) and the 16 (HOL and MON) or 15 (NOR) traits described in Table 2. The phenotypes considered were the yield deviations (YD) of each cow, as estimated in the French national genetic evaluation programs of the HOL, MON, and NOR populations. YD can be interpreted as a cow’s per-formance, adjusted for environmental effects; for traits with repeated measures, it is the weighted mean of the cow’s performance, adjusted for non-genetic effects. As for bulls DYD, YD are by-products of the French evalu-ation system [11]. As in Part I, we used GCTA [20] and applied model (1) on the vector y of the YD of the cows, considering G , the genomic relationship matrix (GRM), calculated with the 50K SNP genotypes. The SNP effect was considered significant if its −log10(P) value was higher than 6 (5% genome-wide threshold after Bonfer-roni correction, i.e. 10−6). As before, all variant positions were from the UMD3.1 assembly.
Results
Part I: Results from the bull sequence‑based GWAS
GWAS of imputed whole-genome sequences of MON, NOR, and HOL bulls revealed 24, 12, and 48 QTL, respectively, with significant effects (−log10(P) ≥ 8.2; Table 3) on production (Fig. 2) or udder morphology and udder health traits (Figs. 3 and 4). At least one QTL was identified for all traits in the HOL dataset with the excep-tion of CM, but no QTL was found for five traits in MON (PY, CM, TL, FTD, and TO) and nine traits in NOR (PY, CM, SCS, UD, FUA, FTD, UB, TO, and MSS). For the three breeds, we detected a larger number of QTL linked with milk production (13, 10, and 30 in MON, NOR and HOL, respectively), than with udder morphology (8, 2, and 16, respectively) or udder health traits (3, 0, and 2, respectively). Each QTL explained from 1.1 to 11.1% of the genetic variance of its associated trait in MON, 1.7 to 18.4% in NOR, and 0.3 to 26.8% in HOL. In each of the three breeds, the largest number of QTL was found for PC (6, 5, and 11 in MON, NOR, and HOL, respec-tively; Fig. 2), and their cumulative effects explained 17.2% (MON), 20.0% (NOR), and 27.7% (HOL) of the genetic variance of this trait. In each breed, the QTL that explained the largest percentage of the genetic variance of a trait was associated with FC, and the cumulative effects
Fig. 1 Design of the molecular test for a structural variant in a SNP
chip (example of an insertion). Using the black arrow as a primer, the
G allele reveals the insertion and the A allele the absence of insertion.
A confirmation can be obtained with a second test on the other side of the insertion (primers = red arrows). Allele C reveals the insertion and T the absence of insertion
of all the QTL detected for this trait accounted for 19.7%, 23.2%, and 37% of the total genetic variance in MON, NOR, and HOL, respectively. In the three breeds, both the number of QTL and their individual estimated effects were lower for udder traits than for production traits; consequently, the QTL that were identified for these traits explained a smaller part of their genetic variance. In addition, in contrast to the results for production traits, the udder morphology or health trait which had the larg-est percentage of genetic variance explained by QTL was different among breeds: SCS with 6.3% in MON, RUH with 5.2% in NOR, and UD with 6.3% in HOL.
As described in the “Methods” section, for each QTL we defined two confidence intervals (CI) using either the CI of the most significant individual QTL (TOP-CI) or by the inclusion of all individual CI of the QTL within the region (EXT-CI). Genomic annotations of the variants located in the 84 QTL regions (TOP-CI or EXT-CI) are summarized over all traits and breeds in Table 4. Con-sidering all QTL together, 11,696 and 20,798 distinct variants with significant effects were located within the TOP-CI and EXT-CI regions, respectively. These vari-ants were mainly located in intergenic regions (56.8 and 59.7% for TOP-CI and EXT-CI, respectively) or in introns of genes (28.1 and 29.2%, respectively) of the bovine genome. Only 50 (0.43%, TOP-CI) and 66 (0.32%, EXT-CI) of the variants were missense. The remaining variants were located in putative regulatory regions of the bovine genome: mainly, the upstream and downstream regions
and, to a lesser extent, the 3′ UTR, 5′ UTR, and splicing regions of genes.
Within a given breed, QTL for multiple production traits or udder traits were sometimes located in the same genomic region. When we grouped QTL based on their location on the genome, the 84 QTL corresponded to 61 distinct regions, referred to as QTL ID in the first column of Tables 5 and 6. Of these, 36 regions had effects on pro-duction traits and 25 had effects on udder morphology and/or health traits. With respect to production traits, the 36 distinct genomic regions corresponded to 53 QTL, which were located on Bos taurus (BTA) autosomes 3, 4, 5, 6, 11, 14, 15, 16, 19, 20, 22, 27, and 29 (Table 5). The 25 regions (31 QTL) with effects on udder morphology and health were found on BTA1, 2, 4, 5, 6, 8, 9, 14, 17, 19, 20, 24, 26, 28, and 29 (Table 6). The largest numbers of QTL were found on BTA5, 6, 14, 20, and 19. In addi-tion, 15 of the 61 genomic regions had effects on more than one trait (corresponding to 38 of the 84 QTL); how-ever, no genomic region had pleiotropic effects on both production and udder morphology or health traits (i.e. there was no overlap between the CI of QTL for produc-tion traits and any of the other traits). Instead, there were 10 regions that each affected from two to five different production traits and five regions that affected two to three different udder morphology or health traits. Within a breed, even if more than one trait could be linked to a single region, the specific variants with the most signifi-cant effects on each trait were largely different. However, Table 3 Number of QTL and total (TOT), lowest (Min), and largest (Max) percentages of genetic variance of the trait explained by the QTL detected in sequence-based GWAS performed on bulls in each breed
*For the description of the traits see Table 2
Trait* Montbéliarde Normande Holstein
#QTL TOT Min Max #QTL TOT Min Max #QTL TOT Min Max
MY 1 1.6 1.6 1.6 1 2.0 2.0 2.0 3 10.0 1.1 7.8 FC 5 19.7 1.8 11.1 3 23.2 1.7 18.4 8 37.0 0.5 26.8 PC 6 17.2 1.2 7.0 5 20.0 2.0 8.0 11 27.7 0.7 8.2 FY 1 1.1 1.1 1.1 1 3.0 3.0 3.0 4 13.8 0.6 10.9 PY 0 0 4 3.7 0.3 1.7 CM 0 0 0 0 0 0 SCS 3 6.3 1.9 2.2 0 2 2.6 0.8 1.8 US 1 4.3 4.3 4.3 1 2.5 2.5 2.5 1 1.6 1.6 1.6 UD 2 4.9 1.8 3.1 0 4 6.3 0.8 1.7 FUA 1 3.9 3.9 3.9 0 2 3.1 1.5 1.6 RUH 1 3.2 3.2 3.2 1 5.2 5.2 5.2 2 3.9 1.0 2.9 TL 0 – – – – 1 3.4 3.4 3.4 FTD 0 0 2 3.6 1.6 1.9 UB 1 5.1 5.1 5.1 0 1 1.2 1.2 1.2 TO 0 0 1 0.9 0.9 0.9 MSS 2 3.9 1.9 2.0 0 2 2.2 1.0 1.2
Fig. 2 Sequence‑based GWAS: – log10(P) plotted against the position on Bos taurus autosomes of variants linked with protein content in a Montbéliarde, b Normande, and c Holstein bulls
Fig. 3 Sequence‑based GWAS: – log10(P) plotted against the position on Bos taurus autosomes of variants linked with somatic cell score (SCS) in a Montbéliarde, b Normande, and c Holstein bulls
Fig. 4 Sequence‑based GWAS: –log10(P) plotted against the position on Bos taurus autosomes of variants linked with udder depth in a Montbéliarde, b Normande, and c Holstein bulls
there were some cases in which a single variant, always located within a gene, had significant effects on different traits, i.e. the variant with the most significant effects was the same for multiple traits.
We identified 15 QTL ID, all linked with production traits, that were shared among the three breeds; they were located in five genomic regions and affected PC on BTA3 (at ~ 15 Mbp) and BTA6 (at ~ 87 Mbp, Fig. 2) and FC on BTA5 (at ~ 94 Mbp), BTA14 (at ~ 1.8 Mbp), and BTA27 (at ~ 36.2 Mbp). Six other regions (two for pro-duction traits and four for udder traits) had effects in two different breeds: in HOL and NOR on BTA5 (at ~ 118 Mbp for PC); in HOL and MON on BTA6 (at ~ 88.8 Mbp for UD, Fig. 4; at ~ 93 Mbp for PC), BTA19 (at ~ 60 Mbp for MSS and UD), and BTA24 (at ~ 34 Mbp for UB and RUH) and in MON and NOR on BTA17 (at ~ 62.7 Mbp for FUA and US). Although regions were shared among breeds, the variants with the most significant effect were different in each breed, with one exception: in one region located on BTA19, the intergenic variant rs109603247 had the most significant effect on MSS in both HOL and MON.
In all the QTL detected, the size of the TOP-CI ranged from 36.7 kb (BTA4 in HOL for FTD) to 1.9 Mb (BTA24 in MON for UB), with mean and median values being equal to 931 and 700 kb, respectively. TOP-CI con-tained from 0 to 31 genes (mean = 6.1; median = 3). As expected, EXT-CI were often broader, up to 12.8 Mb (mean = 2.1 Mb; median = 1.0 Mb) with a larger number
of genes, up to 55 (mean = 8.5; median = 4). When we analyzed the EXT-CI of QTL, we observed that the majority contained at least a gene; only nine QTL (1 for production and 8 for udder morphology and/or health traits) were located entirely within intergenic regions. The variant with the most significant effect was located in an intergenic region for 19 out of 53 QTL identified for production traits and for 20 out of 31 QTL found for udder traits. All other variants presenting the most significant effects were located in intronic (28 for pro-duction traits and 9 for udder traits), upstream (4 for production traits and 1 for udder traits), downstream (2 for production traits and 1 for udder traits) or 5′UTR (1 for production trait) regions of genes. The genes in which these variants were located are indicated in Tables 5 and 6.
Part II: Confirmation results on cows’ performances
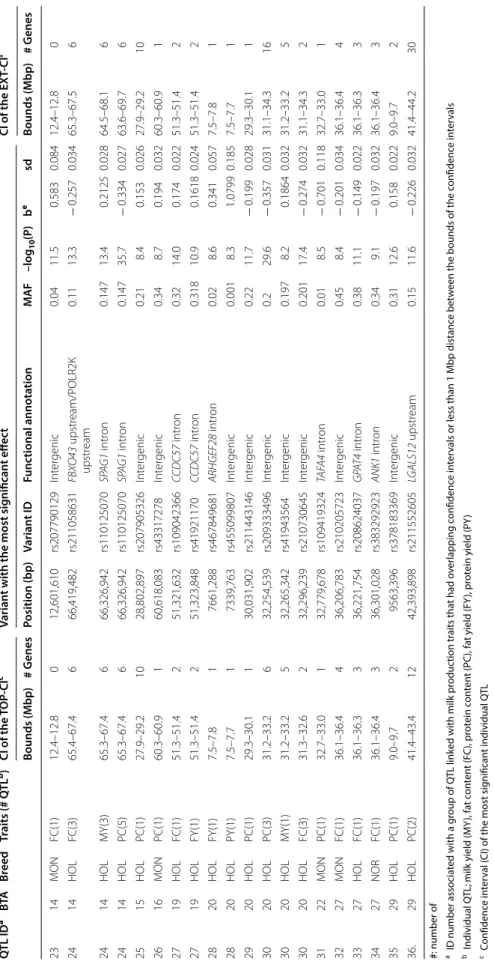
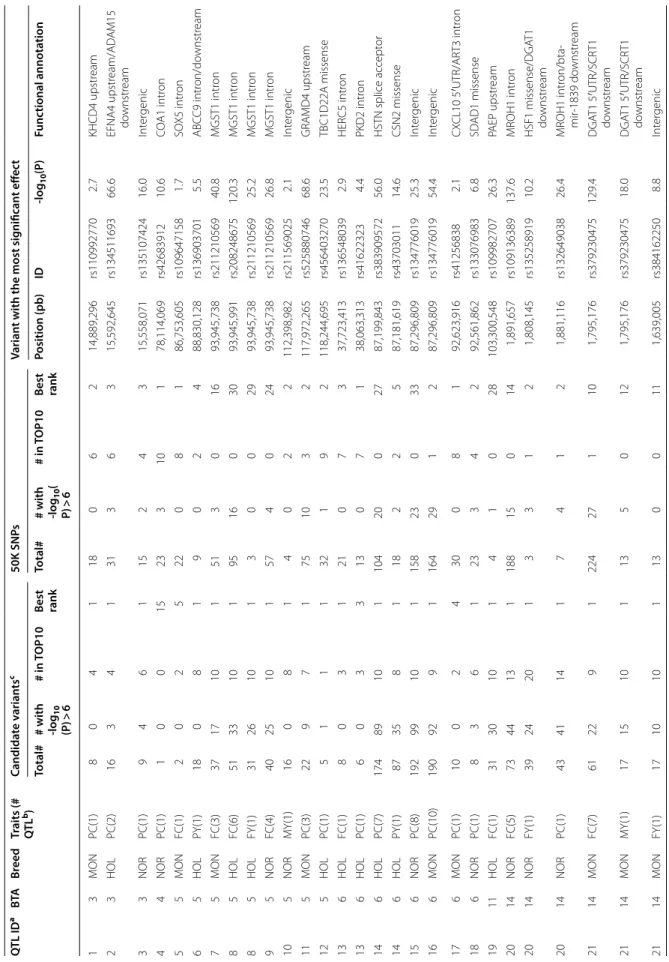
Within each of the 84 QTL detected in Part I, we selected the variants that best explained the observed results, hereafter named candidate variants, from sequence-based GWAS results from bulls. For technical reasons, a few of these candidate variants could not be included on the customized EuroG10K chip. In the end, one to 192 candidate variants from each of 80 of the 84 QTL (855 different variants in total) were added to the chip and tested for validation together with the standard 50K SNPs. As a consequence, even for the four QTL for which no candidate variant was added (two for production and two for udder traits), there were SNPs from the standard 50K chip that were located in the EXT-CI and were thus included in this confirmation study. We confirmed—i.e. found significant effects in the corresponding breed x trait analysis—the effects in cows of 54 out of the 84 QTL described in Tables 5 and 6 (40 of 53 QTL for production traits, Table 7; 14 out of 31 QTL for udder traits, Table 8). In each of the validated QTL regions, we found signifi-cant effects (− log10(P) ≥ 6) for up to 99 candidate vari-ants and up to 33 50K SNPs. Of the 80 QTL for which we tested candidate variants, the mean rank of the best can-didate variant was 1.8 for all the QTL, for both produc-tion and udder traits, and 1.5 for the validated QTL (1.6 for production traits and 1.1 for udder traits). Thus, for the majority of the validated QTL, the variant with the most significant effect was one of the candidate variants selected in Part I for its level of significance and/or anno-tation; the exceptions were seven QTL that corresponded to four different genomic regions. Of these four regions, we found one in which only one candidate variant was present (at ~ 78 Mb on BTA4 for PC in NOR); another one in which the best candidate variant was ranked 2nd (at ~ 12 Mb on BTA5 for TL in HOL); and two regions
Table 4 Genomic annotations of variants included
within the confidence intervals (CI) of the 84 QTL, defined using either the CI of the most significant individual QTL (TOP-CI) or all the individual CI (EXT-CI) within each QTL region
Functional annotation TOP‑CI: CI of the QTL with the most significant effect EXT‑CI: Extended CI Number % Number % Intergenic 6642 56.8 12,421 59.7 Upstream 764 6.5 965 4.6 Downstream 773 6.6 1039 5.0 3’ UTR 41 0.35 50 0.24 5′ UTR 14 0.12 14 0.07 Intronic 3286 28.1 6077 29.2 Synonymous 105 0.90 133 0.64
Non‑coding transcript exon 4 0.03 6 0.03
Splicing region 17 0.15 27 0.13
Missense 50 0.43 66 0.32
Table 5 Q TL det ec ted f or milk pr oduc tion tr aits in M on tb éliar de (MON), N
ormande (NOR), and H
olst
ein (HOL) bulls
Q TL ID a BTA Br eed Tr aits (# Q TL b) CI of the TOP ‑CI c Varian t with the most sig nifican t eff ec t CI of the EX T‑ CI f Bounds (Mbp ) # G enes Position (bp ) Varian t ID Func tional annota tion MA F –log 10 (P) b e sd Bounds (Mbp ) # G enes 1 3 MON PC(1) 13.8–15.0 10 14,278,689 rs443751026 GP AT CH4 upstr eam 0.02 9.2 − 0.667 0.108 13.8–15.0 10 2 3 HOL PC(2) 15.3–15.9 16 15,540,709 rs207616487 Int er genic 0.03 23.3 − 0.461 0.046 13.6–15.9 19 3 3 NOR PC(1) 14.7–15.6 6 15,558,071 rs135107424 Int er genic 0.31 12.7 − 0.278 0.038 14.7–15.6 6 4 4 NOR PC(1) 77.8–79.2 8 78,878,576 rs209194403 Int er genic 0.12 8.6 0.307 0.052 77.8–79.2 8 5 5 MON FC(1) 85.0–86.8 1 85,867,738 rs378424416 48719* intr on 0.03 9.2 − 0.53 0.086 85.0–86.8 1 6 5 HOL PY(1) 88.6–89.2 5 89,037,941 rs441042365 G YS2 intr on 0.05 8.3 − 0.273 0.047 88.6 ‑89.2 5 7 5 MON FC(3) 93.7–94.0 2 93,912,041 rs208512412 Int er genic 0.13 10.7 − 0.318 0.048 89.7–94.0 5 8 5 HOL FC(6) 93.8–94.0 2 93,944,234 rs210886822 MGST1 intr on 0.44 26.4 0.242 0.022 90.8–98.2 13 8 5 HOL FY(1) 93.9–94.1 2 93,954,751 rs209288972 MGST1 upstr eam 0.214 12.3 0.1883 0.026 93.9–94.1 2 9 5 NOR FC(4) 93.9–94.2 1 94,159,666 rs384934968 Int er genic 0.16 13.6 − 0.335 0.044 89.1–94.2 7 10 5 NOR MY(1) 112.2–112.5 3 112,281,738 rs110231840 MR TF A intr on 0.07 8.3 − 0.389 0.066 112.2–112.5 3 11 5 MON PC(3) 117.1–118.6 8 118,007,875 rs474313622 GRAMD4 intr on 0.04 18.9 − 0.683 0.075 117.1–121.1 15 12 5 HOL PC(1) 117.8–119.1 3 118,283,121 rs483019568 TBC1D22A intr on 0.2 11.3 − 0.167 0.024 117.8–119.1 3 13 6 HOL FC(1) 37.5–38.5 6 37,742,024 rs458142329 HER C6 intr on 0.01 9.7 − 0.442 0.069 37.5–38.5 6 13 6 HOL PC(1) 37.5–38.1 5 37,742,024 rs458142329 HER C6 intr on 0.012 24.3 − 0.701 0.068 37.5–38.1 5 14 6 HOL PC(7) 86.0–87.6 4 87,001,138 rs109613975 38214 d intr on 0.11 24.1 0.448 0.043 81.7–90.3 18 14 6 HOL PY(1) 86.9–88 7 87,174,212 rs110217592 Int er genic 0.313 9.6 − 0.156 0.025 86.9–88 7 15 6 NOR PC(8) 86.5–87.6 4 87,172,459 rs109761275 Int er genic 0.5 22.1 − 0.399 0.041 78.9–91.0 15 16 6 MON PC(10) 86.6–88.4 8 87,592,824 rs386045066 Int er genic 0.29 23.1 0.411 0.041 78.3–91.2 17 17 6 MON PC(1) 92.4–94.0 4 93,148,097 rs132964769 SHR OOM3 intr on 0.43 8.9 0.224 0.037 92.4–94 4 18 6 NOR PC(1) 92.4–93.5 4 93,231,665 rs43475602 SHR OOM3 intr on 0.25 9.5 0.32 0.051 92.4–93.5 4 19 11 HOL FC(1) 103.2–103.4 3 103,294,772 rs207607053 Int er genic 0.48 10.2 0.13 0.02 103.2–103.4 3 20 14 NOR FC(5) 1.5–2.0 19 1,800,399 rs208317364 DG AT1 intr on/HSF1 do wnstr eam 0.09 89.0 1.04 0.052 1.5–9.3 33 20 14 NOR FY(1) 1.7–2 19 1,810,124 rs133931291 HSF1 intr on 0.09 14.3 0.4301 0.055 1.7–2 19 20 14 NOR PC(1) 1.5–2 19 1,800,399 rs208317364 DG AT1 intr on/HSF1 do wnstr eam 0.094 14.5 0.417 0.053 1.5–2 19 21 14 MON FC(7) 1.4–2.0 23 1,881,116 rs132649038 MR OH1 intr on/bta ‑mir ‑1839 do wnstr eam 0.02 62.4 1.935 0.115 1.4–10.5 45 21 14 MON MY(1) 1.4–2.3 24 2,261,103 rs517360248 ZNF623 do wnstr eam 0.169 9.9 − 0.239 0.037 1.4–2.3 24 21 14 MON FY(1) 1.4–2.3 24 2,261,103 rs517360248 ZNF623 do wnstr eam 0.169 9.9 − 0.239 0.037 1.4–2.3 24 22 14 HOL FC(5) 1.8–3.0 19 1,881,400 rs210517654 MR OH1 intr on/bta ‑mir ‑1839 do wnstr eam 0.2 295.1 0.916 0.022 1.5–9.7 55 22 14 HOL MY(5) 1.5–2.1 29 1,801,116 rs109421300 DG AT1 intr on/HSF1 do wnstr eam 0.203 100.8 − 0.49 0.023 1.5–7.1 29 22 14 HOL FY(6) 1.5–2.2 29 1,801,116 rs109421300 DG AT1 intr on/HSF1 do wnstr eam 0.203 128.2 0.5803 0.024 1.5–9.7 29 22 14 HOL PY(2) 1.5–2.1 31 1,801,116 rs109421300 DG AT1 intr on/HSF1 do wnstr eam 0.203 22.3 − 0.231 0.023 1.5–3.0 31 22 14 HOL PC(3) 1.5–2.2 25 1,801,116 rs109421300 DG AT1 intr on/HSF1 do wnstr eam 0.203 121.1 0.5048 0.022 1.5–4.5 25
Table 5 (c on tinued) Q TL ID a BTA Br eed Tr aits (# Q TL b) CI of the TOP ‑CI c Varian t with the most sig nifican t eff ec t CI of the EX T‑ CI f Bounds (Mbp ) # G enes Position (bp ) Varian t ID Func tional annota tion MA F –log 10 (P) b e sd Bounds (Mbp ) # G enes 23 14 MON FC(1) 12.4–12.8 0 12,601,610 rs207790129 Int er genic 0.04 11.5 0.583 0.084 12.4–12.8 0 24 14 HOL FC(3) 65.4–67.4 6 66,419,482 rs211058631 FBX O43 upstr eam/POLR2K upstr eam 0.11 13.3 − 0.257 0.034 65.3–67.5 6 24 14 HOL MY(3) 65.3–67.4 6 66,326,942 rs110125070 SP AG1 intr on 0.147 13.4 0.2125 0.028 64.5–68.1 6 24 14 HOL PC(5) 65.3–67.4 6 66,326,942 rs110125070 SP AG1 intr on 0.147 35.7 − 0.334 0.027 63.6–69.7 6 25 15 HOL PC(1) 27.9–29.2 10 28,802,897 rs207905326 Int er genic 0.21 8.4 0.153 0.026 27.9–29.2 10 26 16 MON PC(1) 60.3–60.9 1 60,618,083 rs43317278 Int er genic 0.34 8.7 0.194 0.032 60.3–60.9 1 27 19 HOL FC(1) 51.3–51.4 2 51,321,632 rs109042366 CCDC57 intr on 0.32 14.0 0.174 0.022 51.3–51.4 2 27 19 HOL FY(1) 51.3–51.4 2 51,323,848 rs41921170 CCDC57 intr on 0.318 10.9 0.1618 0.024 51.3–51.4 2 28 20 HOL FY(1) 7.5–7.8 1 7661,288 rs467849681 ARHGEF28 intr on 0.02 8.6 0.341 0.057 7.5–7.8 1 28 20 HOL PY(1) 7.5–7.7 1 7339,763 rs455099807 Int er genic 0.001 8.3 1.0799 0.185 7.5–7.7 1 29 20 HOL PC(1) 29.3–30.1 1 30,031,902 rs211443146 Int er genic 0.22 11.7 − 0.199 0.028 29.3–30.1 1 30 20 HOL PC(3) 31.2–33.2 6 32,254,539 rs209333496 Int er genic 0.2 29.6 − 0.357 0.031 31.1–34.3 16 30 20 HOL MY(1) 31.2–33.2 5 32,265,342 rs41943564 Int er genic 0.197 8.2 0.1864 0.032 31.2–33.2 5 30 20 HOL FC(3) 31.3–32.6 2 32,296,239 rs210730645 Int er genic 0.201 17.4 − 0.274 0.032 31.1–34.3 2 31 22 MON PC(1) 32.7–33.0 1 32,779,678 rs109419324 TAF A4 intr on 0.01 8.5 − 0.701 0.118 32.7–33.0 1 32 27 MON FC(1) 36.1–36.4 4 36,206,783 rs210205723 Int er genic 0.45 8.4 − 0.201 0.034 36.1–36.4 4 33 27 HOL FC(1) 36.1–36.3 3 36,221,754 rs208624037 GP AT4 intr on 0.38 11.1 − 0.149 0.022 36.1–36.3 3 34 27 NOR FC(1) 36.1–36.4 3 36,301,028 rs383292923 ANK1 intr on 0.34 9.1 − 0.197 0.032 36.1–36.4 3 35 29 HOL PC(1) 9.0–9.7 2 9563,396 rs378183369 Int er genic 0.31 12.6 0.158 0.022 9.0–9.7 2 36. 29 HOL PC(2) 41.4–43.4 12 42,393,898 rs211552605 LG ALS12 upstr eam 0.15 11.6 − 0.226 0.032 41.4–44.2 30
#: number of a ID number associa
ted with a g
roup of Q
TL linked with milk pr
oduc tion tr aits tha t had o ver lapping c onfidenc e in ter
vals or less than 1 Mbp distanc
e bet
w
een the bounds of the c
onfidenc e in ter vals b I ndividual Q
TL; milk yield (MY
), fa t c on ten t (FC ), pr ot ein c on ten t (PC ), fa t yield (FY ), pr ot ein yield (P Y) c C onfidenc e in ter val (
CI) of the most sig
nifican t individual Q TL d ENSB TA G000000 e Eff ec t of the v ar ian t, e xpr
essed in genetic standar
d devia tion units f Ex tended c onfidenc e in ter val ( CI) enc
ompassing all the individual Q
TL det
ec
ted in the same genomic r
eg
Table 6 Q TL det ec ted f or udder tr aits in M on tb éliar de (MON), N
ormande (NOR), and H
olst
ein (HOL) bulls
#: number of a ID number associa
ted with a g
roup of Q
TL linked with udder tr
aits tha t had o ver lapping c onfidenc e in ter
vals or less than 1 Mbp distanc
e bet
w
een the bounds of the c
onfidenc e in ter vals b I ndividual Q TL; soma tic c ell sc or e (SCS), clinical mastitis sc or e ( CM), udder suppor
t (US), udder depth (UD
), f or e udder a ttachmen t (FU A ), r
ear udder heigh
t (RUH), f or e t ea t distanc e (FTD ), udder balanc e (UB), t ea t or ien ta tion ( TO ), t ea t length ( TL), and milk ing speed sc or e (MSS) c c onfidenc e in ter val (
CI) of the most sig
nifican t individual Q TL d ENSB TA G000000 e Eff ec t of the v ar ian t, e xpr
essed in genetic standar
d devia tion units f Ex tended c onfidenc e in ter val ( CI) enc
ompassing all the individual Q
TL det
ec
ted in the same genomic r
eg ion Q TL ID a BTA Br eed Tr aits (# Q TL b) CI of the TOP ‑CI c Varian t with the most sig nifican t eff ec t CI of the EX T‑ CI f Bounds (Mbp ) # G enes Position (bp ) Varian t ID Func tional annota tion MA F − log 10 (P) b e sd Bounds (Mbp ) # genes 37 1 HOL US(1) 110.3–111.0 1 110,870,166 rs42324415 Int er genic 0.32 9.3 0.19 0.031 110.3–111.0 1 38 2 NOR RUH(4) 6.0–6.7 2 6,237,254 rs385990556 Int er genic 0.02 16.5 − 1.185 0.14 4.5–9.2 11 39 4 HOL UD(1) 10.0–10.2 0 10,126,995 rs42524022 Int er genic 0.36 8.5 0.131 0.022 10.0–10.2 0 40 4 HOL FTD(1) 70.6–70.7 0 70,620,943 rs210515134 Int er genic 0.47 8.9 − 0.182 0.03 70.6–70.7 0 41 5 HOL TL(1) 12.4–12.5 1 12,441,072 rs109808447 TM TC2 I ntr on 0.14 25 0.379 0.036 12.4–12.5 1 42 5 HOL UD(1) 88.7–88.9 2 88,800,994 rs110461240 ABC C9 intr on 0.45 12.4 0.186 0.026 88.7–88.9 2 42 5 HOL FU A(1) 88.7–88.9 2 88,800,994 rs110461240 ABC C9 intr on 0.457 11.3 0.1787 0.026 88.7–88.9 2 43 6 HOL RUH(1) 71.9–72.2 0 72,022,013 rs136970036 Int er genic 0.28 14.9 0.272 0.034 71.9–72.2 0 44 6 MON UD(1) 88.6–89.6 1 88,744,985 rs110181141 Int er genic 0.37 9.2 − 0.256 0.042 88.6–89.6 5 45 6 HOL SCS(1) 88.4–89.2 3 88,881,928 rs474137839 Int er genic 0.31 9.2 0.206 0.033 88.4–89.2 3 45 6 HOL UD(1) 88.4–89.2 4 88,697,293 rs110041776 GC intr on 0.407 8.6 0.1789 0.03 88.4–89.2 4 46 8 HOL FTD(2) 81.9–83.1 3 82,059,790 rs134625094 Int er genic 0.11 10.8 − 0.316 0.047 81.9–85.4 8 47 9 MON SCS(1) 23.4–23.7 1 23,620,280 rs437752750 ME1 I ntr on 0.02 9.5 − 0.718 0.114 23.4–23.7 1 48 9 MON SCS(1) 25.7–26.3 1 25,888,225 rs797068196 HEY2 upstr eam 0.02 9.1 − 0.78 0.127 25.7–26.3 1 49 9 MON SCS(1) 28.1–29.2 1 28,197,098 rs455285205 38849 d intr on 0.01 8.2 − 0.859 0.147 28.1–29.2 1 50 14 MON RUH(1) 24.4–25.1 3 25,052,440 rs210030313 PL AG1 5 ′UTR /CHCHD7 upstr eam 0.07 12.5 − 0.506 0.07 24.4–25.1 3 51 17 MON FU A(1) 62.6–62.7 0 62,679,331 rs109168890 Int er genic 0.42 13.1 − 0.283 0.038 62.6–62.7 0 51 17 MON US(1) 62.6–62.9 0 62,714,882 rs109332098 Int er genic 0.215 12.3 − 0.358 0.049 62.6–62.9 0 52 17 NOR US(1) 62.5–62.9 2 62,694,032 rs109134926 Int er genic 0.21 10.0 − 0.272 0.042 62.5–62.9 2 53 19 HOL MSS(1) 7.5–7.7 1 7,565,865 rs445450010 Int er genic 0.47 10.5 − 0.153 0.023 7.5–7.7 1 54 19 HOL MSS(1) 59.3–60.4 0 60,151,690 rs109603247 Int er genic 0.18 8.9 0.186 0.031 59.3–60.4 0 55 19 MON UD(1) 60.5–61.5 0 60,523,834 rs134785404 Int er genic 0.37 9.0 − 0.199 0.032 60.5–61.5 0 55 19 MON MSS(1) 59.3–60.4 0 60,151,690 rs109603247 Int er genic 0.183 8.9 0.1856 0.031 59.3–60.4 0 56 20 HOL FU A(3) 26.1 ‑28.0 2 27,082,437 rs209792391 Int er genic 0.29 10.9 − 0.192 0.028 25.6––28 3 57 24 MON UB(1) 33.2–35.3 11 34,288,737 rs382921722 Int er genic 0.4 9.1 0.326 0.053 33.2–35.3 11 58 24 HOL RUH(1) 33.3–34.6 3 34,310,163 rs482718265 Int er genic 0.04 10.5 − 0.377 0.057 33.3–34.6 3 59 26 HOL TO(1) 38.5–38.9 2 38,725,076 rs133440951 Int er genic 0.05 8.6 − 0.302 0.051 38.5–38.9 2 60 28 MON MSS(1) 19.3–21.1 4 20,158,547 rs43101108 Int er genic 0.09 8.7 − 0.342 0.057 19.3–21.1 4 61 29 HOL UD(3) 49.1–50.3 4 49,421,004 rs208859984 KCNQ1 I ntr on 0.31 12.7 − 0.167 0.023 49.1–51.5 24 61 29 HOL SCS(1) 49.3–50.3 4 49,782,986 rs437410319 KCNQ1 I ntr on 0.066 8.4 0.2493 0.042 49.3–50.3 4 61. 29 HOL UB(2) 48.3–50.3 8 49,299,622 rs210749543 NAP1L4 I ntr on 0.052 10.8 − 0.347 0.051 48.3–51.2 8
Table 7 GW AS v alida tion r esults f or pr oduc tion tr aits in M on tb éliar de (MON), N
ormande (NOR), and H
olst ein (HOL) c ow s Q TL ID a BTA Br eed Tr aits (# QT L b) Candida te varian ts c 50K SNP s Varian t with the most sig nifican t eff ec t Total# # with ‑log 10 (P ) > 6 # in TOP10 Best rank Total# # with ‑log 10 ( P) > 6 # in TOP10 Best rank Position (pb ) ID ‑log 10 (P) Func tional annota tion 1 3 MON PC(1) 8 0 4 1 18 0 6 2 14,889,296 rs110992770 2.7 KHCD4 upstr eam 2 3 HOL PC(2) 16 3 4 1 31 3 6 3 15,592,645 rs134511693 66.6 EFNA4 upstr eam/AD A M15 do wnstr eam 3 3 NOR PC(1) 9 4 6 1 15 2 4 3 15,558,071 rs135107424 16.0 Int er genic 4 4 NOR PC(1) 1 0 0 15 23 3 10 1 78,114,069 rs42683912 10.6 CO A1 intr on 5 5 MON FC(1) 2 0 2 5 22 0 8 1 86,753,605 rs109647158 1.7 SO X5 intr on 6 5 HOL PY(1) 18 0 8 1 9 0 2 4 88,830,128 rs136903701 5.5 ABC C9 intr on/do wnstr eam 7 5 MON FC(3) 37 17 10 1 51 3 0 16 93,945,738 rs211210569 40.8 MGST1 intr on 8 5 HOL FC(6) 51 33 10 1 95 16 0 30 93,945,991 rs208248675 120.3 MGST1 intr on 8 5 HOL FY(1) 31 26 10 1 3 0 0 29 93,945,738 rs211210569 25.2 MGST1 intr on 9 5 NOR FC(4) 40 25 10 1 57 4 0 24 93,945,738 rs211210569 26.8 MGST1 intr on 10 5 NOR MY(1) 16 0 8 1 4 0 2 2 112,398,982 rs211569025 2.1 Int er genic 11 5 MON PC(3) 22 9 7 1 75 10 3 2 117,972,265 rs525880746 68.6 GRA MD4 upstr eam 12 5 HOL PC(1) 5 1 1 1 32 1 9 2 118,244,695 rs456403270 23.5 TBC1D22A missense 13 6 HOL FC(1) 8 0 3 1 21 0 7 3 37,723,413 rs136548039 2.9 HER C5 intr on 13 6 HOL PC(1) 6 0 3 3 13 0 7 1 38,063,313 rs41622323 4.4 PKD2 intr on 14 6 HOL PC(7) 174 89 10 1 104 20 0 27 87,199,843 rs383909572 56.0 HSTN splice accept or 14 6 HOL PY(1) 87 35 8 1 18 2 2 5 87,181,619 rs43703011 14.6 CSN2 missense 15 6 NOR PC(8) 192 99 10 1 158 23 0 33 87,296,809 rs134776019 25.3 Int er genic 16 6 MON PC(10) 190 92 9 1 164 29 1 2 87,296,809 rs134776019 54.4 Int er genic 17 6 MON PC(1) 10 0 2 4 30 0 8 1 92,623,916 rs41256838 2.1 CX CL10 5 ′UTR/AR T3 intr on 18 6 NOR PC(1) 8 3 6 1 23 3 4 2 92,561,862 rs133076983 6.8 SD AD1 missense 19 11 HOL FC(1) 31 30 10 1 4 1 0 28 103,300,548 rs109982707 26.3 PAEP upstr eam 20 14 NOR FC(5) 73 44 13 1 188 15 0 14 1,891,657 rs109136389 137.6 MR OH1 intr on 20 14 NOR FY(1) 39 24 20 1 3 3 1 2 1,808,145 rs135258919 10.2 HSF1 missense/DGA T1 do wnstr eam 20 14 NOR PC(1) 43 41 14 1 7 4 1 2 1,881,116 rs132649038 26.4 MR OH1 intr on/bta ‑ mir ‑1839 do wnstr eam 21 14 MON FC(7) 61 22 9 1 224 27 1 10 1,795,176 rs379230475 129.4 DGA T1 5 ′UTR/SCR T1 do wnstr eam 21 14 MON MY(1) 17 15 10 1 13 5 0 12 1,795,176 rs379230475 18.0 DGA T1 5 ′UTR/SCR T1 do wnstr eam 21 14 MON FY(1) 17 10 10 1 13 0 0 11 1,639,005 rs384162250 8.8 Int er genic
Table 7 (c on tinued) Q TL ID a BTA Br eed Tr aits (# QT L b) Candida te varian ts c 50K SNP s Varian t with the most sig nifican t eff ec t Total# # with ‑log 10 (P ) > 6 # in TOP10 Best rank Total# # with ‑log 10 ( P) > 6 # in TOP10 Best rank Position (pb ) ID ‑log 10 (P) Func tional annota tion 22 14 HOL FC(5) 90 52 37 1 206 33 2 1 1,802,265 rs109234250 >300 DGA T1 missense 22 14 HOL MY(5) 72 48 11 2 139 24 1 1 1,801,116 rs109421300 108.1 DGA T1 intr on/HSF1 do wn ‑ str eam 22 14 HOL FY(6) 90 50 10 1 206 26 0 19 1,739,885 rs110825388 93.7 CPSF1 intr on/ADCK5 do wnstr eam 22 14 HOL PY(2) 53 45 11 2 30 8 1 1 1,801,116 rs109421300 30.3 DGA T1 intr on 22 14 HOL PC(3) 62 48 13 1 64 18 0 20 1,724,688 rs135458711 141.9 SL C39A4 do wnstr eam/ CPSF1 upstr eam 23 14 MON FC(1) 0 0 0 0 10 0 10 1 12,672,880 rs42381926 1.6 Int er genic 24 14 HOL FC(3) 1 1 1 3 27 10 9 1 67,443,766 rs109007040 11.9 VPS13B intr on 24 14 HOL MY(3) 4 2 2 4 51 4 8 1 67,443,766 rs109007040 6.2 VPS13B intr on 24 14 HOL PC(5) 5 3 2 4 90 23 8 1 67,443,766 rs109007040 31.0 VPS13B intr on 25 15 HOL PC(1) 0 0 0 0 27 0 10 1 27,905,645 rs110144962 2.5 APO A4 do wnstr eam 26 16 MON PC(1) 1 1 1 1 13 0 9 2 60,692,234 rs135698521 7.9 Int er genic 27 19 HOL FC(1) 11 9 9 1 3 1 1 4 51,319,797 rs41921161 16.6 CCDC57 missense 27 19 HOL FY(1) 11 0 9 1 3 0 1 4 51,319,797 rs41921161 5.9 CCDC57 missense 28 20 HOL FY(1) 5 0 3 4 7 0 7 1 7,661,649 rs110231369 0.5 ARHGEF28 intr on 28 20 HOL PY(1) 4 0 4 3 5 0 5 1 7,661,649 rs110231369 0.8 ARHGEF28 intr on 29 20 HOL PC(1) 1 1 1 1 11 2 9 2 30,005,528 rs43140727 11.3 Int er genic 30 20 HOL PC(3) 103 92 10 1 48 12 0 50 31,909,478 rs385640152 102.4 GHR missense 30 20 HOL MY(1) 80 37 14 1 23 0 0 41 31,303,953 rs474736745 9.9 PAIP1 intr on 30 20 HOL FC(3) 103 82 10 1 48 6 0 46 31,909,478 rs385640152 54.5 GHR missense 31 22 MON PC(1) 3 0 3 3 4 1 4 1 32,827,786 rs41642478 1.0 TAF A4 intr on 32 27 MON FC(1) 8 4 6 1 7 2 4 5 36,209,319 rs211250281 20.4 GP AT4 upstr eam 33 27 HOL FC(1) 5 4 5 1 6 4 5 5 36,212,352 rs208675276 33.3 GP AT4 5 ′ UTR 34 27 NOR FC(1) 8 4 7 1 8 2 4 5 36,211,258 rs209479876 14.7 GP AT4 upstr eam 35 29 HOL PC(1) 4 2 3 1 15 1 7 2 9,608,833 rs378017490 10.0 PICALM upstr eam 36. 29 HOL PC(2) 50 5 5 1 56 4 5 4 41,843,734 rs208817293 15.9 WDR74 intr on/U2 do wn ‑ str eam
#: number of a ID number associa
ted with a g
roup of Q
TL linked with milk pr
oduc tion tr aits tha t had o ver lapping c onfidenc e in ter
vals or less than 1 Mbp distanc
e bet
w
een the bounds of the c
onfidenc e in ter vals b I ndividual Q
TL; milk yield (MY
), fa t c on ten t (FC ), pr ot ein c on ten t (PC ), fa t yield (FY ), pr ot ein yield (P Y) c C andida te v ar ian ts selec ted fr om sequenc e-based GW AS r esults
linked with production traits in HOL, both located on BTA14 (~ 1.8 Mb and ~ 67.4 Mb). The first region on BTA14 (~ 1.8 Mb) had very significant effects on all five production traits, and for three of them (FC, FY, and PC), one of the candidate variants was ranked first in the peak. In contrast, for the second region (~ 68 Mb), the candi-date variant with the most significant effects on FC, MY, and PC was ranked 3rd, 4th and 4th, respectively, in the peak, meaning that the top two or three variants were from the set of 50K SNPs. Therefore, for almost all the QTL for which the effects were validated in Part II of this study, candidate variants from Part I had more significant effects than the SNPs from the 50K chip.
In 47 of the validated QTL, a candidate variant from Part I presented the most significant effects; these cor-responded to 39 unique variants. Six of these had the most significant effects on two or three different traits and/or different breeds. In particular, we identified three candidate variants having the most significant effects in different breeds: an intronic variant in the
MGST1 gene (rs211210569) for FC in all three breeds;
an intergenic variant on BTA6 (rs134776019) for PC in MON and NOR; and an intronic variant in the GC gene (rs436532576) for SCS or UD in HOL and MON (Fig. 5). Two additional variants presented the most sig-nificant effects on different traits within a single breed: the rs379230475 variant, located in the 5′UTR region of DGAT1 (BTA14), was the top variant for FC and MY in MON and the missense rs385640152 variant in GHR (BTA 20) was the top variant for PC and FC in HOL. In most of the genomic regions for which effects were observed in different breeds or traits, the variants that had the most significant effects were distinct, and mul-tiple variants were located in the same gene in only a few cases (MGST1, DGAT1, and GPAT4). Of the 39 variants with the most significant effects, 10 were in intergenic regions (5 for production traits and 5 for udder traits) while 29 were located in genes listed in Tables 7 and 8.
Discussion
The approach used in Part I of this study—GWAS on imputed whole genome sequences in bulls and the selec-tion of candidate variants in QTL regions—led to the identification of 84 QTL for traits related to production (53), udder morphology (26), and udder health (5) in the three main French dairy breeds. In Part II, we inves-tigated these QTL in statistically independent popula-tions of cows, and confirmed the effects of 54 of them (40 of 53, 75%, for production traits and 14 of 31, 45%, for udder traits). In addition, by performing a GWAS with sequence-level resolution on thousands of bulls for which accurate phenotypes were available, we were able to pro-pose 855 candidate causative variants in the QTL regions,
of which 452 were validated in large populations of cows (9400 to 51,977, depending on the breed).
However, the number of QTL detected and validated differed between breeds. The sequence-based GWAS identified twice as many QTL in HOL (48) as in MON (24), and four times more than in NOR (12). Likewise, the proportion of validated QTL was also higher in HOL than in MON or NOR (32, 12, and 10 QTL, respectively). Furthermore, regardless of the breed, both the number of QTL and their level of significance varied among traits. In the sequence-based GWAS, the 84 QTL corresponded to 36 different genomic regions linked with production traits (mean − log10(P) value of 27.1), 23 regions asso-ciated with udder morphology (mean − log10(P) value of 11.2), and five regions for udder health traits (mean − log10(P) value of 8.9).
Factors that can affect GWAS results
The differences that we observed in GWAS results may, at least in part, have been due to factors that were unique to the breeds, traits, and populations (bulls and cows) analyzed here.
Number of animals with phenotypes and genotypes
HOL, MON, and NOR cows represent 64, 19, and 9% of French dairy herds, respectively. For this reason, the number of animals with phenotypes was much larger in HOL than in MON or NOR (6262 HOL bulls vs 2434 MON and 2175 NOR for the primary detection; 51,977 HOL cows vs. 23,926 MON and 9400 NOR for the vali-dation). This discrepancy clearly affected the power of detection in both sets of analyses: we were able to detect and validate QTL with smaller effects in the HOL popu-lation, and consequently, identified more QTL in total in HOL than in the other two breeds.
Imputation accuracies
The number of sequenced bulls included in RUN4 of the 1000 Bull Genomes Project, and therefore in the refer-ence population for sequrefer-ence-level imputation, were 288, 28, and 24 in HOL, MON, and NOR, respectively. Unsurprisingly, the estimated imputation accuracies were then higher in HOL than in MON [19] and NOR. In addition, MON is related to the Simmental breed that is well represented in the 1000 bull genome popu-lation, whereas NOR is quite specific and likely benefits less from the sequences of the other breeds. In addition, we estimated that the 28 MON and 24 NOR bulls whose sequences were included in the reference population had cumulative contributions to the French populations of 64 and 59%, respectively. These differences may have also promoted a higher imputation accuracy in MON than in
Table 8 GW AS v alida tion r esults f or udder tr aits in M on tb éliar de (MON), N
ormande (NOR), and H
olst ein (HOL) c ow s Q TL ID a BTA Br eed Tr aits (# QT L b) Candida te varian ts c 50K SNP s Varian t with the most sig nifican t eff ec t # T otal # with ‑log 10 (P ) > 6 # in TOP10 Best r ank Total# # with ‑log 10 (P ) > 6 # in TOP10 Best rank Position (pb ) ID − log 10 (P) Func tional annota tion 37 1 HOL US(1) 4 2 4 1 11 0 6 3 110,870,166 rs42324415 6.8 Int er genic 38 2 NOR RUH(4) 14 0 2 1 80 0 8 2 6,325,829 rs385535384 3.0 Int er genic 39 4 HOL UD(1) 0 0 0 0 3 0 3 1 10,078,207 rs42524753 1.7 Int er genic 40 4 HOL FTD(1) 5 0 5 3 2 0 2 1 70,680,040 rs41652994 1.0 Int er genic 41 5 HOL TL(1) 5 4 5 2 3 1 3 1 12,443,146 rs41604034 10.7 TM TC2 intr on 42 5 HOL UD(1) 17 8 9 1 3 1 1 4 88,812,245 rs209585944 16.9 ABC C9 intr on 42 5 HOL FU A(1) 17 8 9 1 3 1 1 3 88,812,245 rs209585944 17.6 ABC C9 intr on 43 6 HOL RUH(1) 0 0 0 0 18 0 7 1 72,028,756 rs110103615 3.8 Int er genic 44 6 MON UD(1) 20 17 8 1 7 0 2 7 88,723,742 rs436532576 19.1 GC intr on 45 6 HOL SCS(1) 37 6 10 1 14 3 0 18 88,723,742 rs436532576 6.3 GC intr on 45 6 HOL UD(1) 37 22 10 1 19 0 0 18 88,723,742 rs436532576 19.4 GC intr on 46 8 HOL FTD(2) 4 0 3 3 19 0 7 1 83,693,221 rs41570498 3.5 Int er genic 47 9 MON SCS(1) 2 0 2 2 12 0 5 1 23,517,815 rs41611219 2.7 ME1 intr on 48 9 MON SCS(1) 1 0 1 7 12 5 9 1 25,793,691 rs109661188 0.3 NC O A7 intr on 49 9 MON SCS(1) 1 0 1 1 13 0 9 2 29,130,097 . 0.8 HSF2 missense 50 14 MON RUH(1) 24 12 10 1 17 0 0 12 25,015,640 rs109815800 29.5 PLA G1 intr on 51 17 MON FU A(1) 3 0 3 1 60 0 2 4 62,695,902 rs109014048 5.9 Int er genic 51 17 MON US(1) 9 8 9 1 6 0 1 10 62,809,661 rs110701343 6.9 Int er genic 52 17 NOR US(1) 10 5 8 1 5 0 2 6 62,693,355 rs109184112 14.7 Int er genic 53 19 HOL MSS(1) 12 12 9 1 11 0 1 9 7,543,195 rs109941836 8.5 Int er genic 54 19 HOL MSS(1) 11 0 2 3 18 0 8 1 60,009,650 rs41653204 3.3 Int er genic 55 19 MON UD(1) 4 0 4 3 6 1 6 1 61,478,388 rs109108437 5.4 Int er genic 55 19 MON MSS(1) 10 0 7 3 2 0 3 1 59,984,238 rs110395313 3.1 Int er genic 56 20 HOL FU A(3) 13 4 4 1 5 0 6 2 27,756,459 rs382512825 10.1 ISL1 upstr eam 57 24 MON UB(1) 13 8 8 1 8 2 2 9 34,317,850 rs210449055 13.7 Int er genic 58 24 HOL RUH(1) 17 0 9 1 5 1 1 5 34,317,850 rs210449055 2.7 Int er genic 59 26 HOL TO(1) 8 8 8 1 26 0 2 9 38,617,279 rs109011767 10.7 RAB11FIP2 3 ′ UTR 60 28 MON MSS(1) 2 0 1 3 15 1 9 1 20,014,813 rs42137452 2.2 Int er genic
NOR and therefore explain the smaller number of QTL found for the NOR bulls.
Between the bull and cow populations, missing geno-types were imputed based on different reference popu-lations. For imputations of bull genotypes (WGS), we used a multi-breed reference population that consisted of their major ancestor bulls. This reference population was of limited size, especially within breed, which likely affected the accuracy of imputation, especially for breed-specific and/or low-MAF variants. For imputations of cow genotypes (50K SNPs + candidate variants), we used large within-breed reference populations that consisted of all animals genotyped with the EuroG10k chip; thus, imputation accuracy was much higher than that at the sequence level.
Heritability and reliability of traits
Differences among traits in the numbers of QTL detected in the sequence-based GWAS could also be explained by differences in DYD reliabilities. DYD is considered as a bull’s own performance for a trait, the heritability of which would be equal to the reliability of the DYD value. The higher the reliability, the smaller the residual variance and the higher the detection power. In addi-tion to the heritability of the trait, the reliability of the DYD also depends on the effective daughter contribution [21], and on average, progeny groups were a little larger in HOL than in MON and NOR. Because udder health traits had lower heritabilities (h2 = 0.018 to 0.15), the reli-ability (REL) of their DYD values was lower (REL = 0.40 to 0.88) than for udder morphology traits (h2 = 0.15 to 0.45; REL = 0.74 to 0.95) and production traits (h2 = 0.30 to 0.50; REL = 0.89 to 0.95) (Tables 2 and Additional file 1: Table S1). In addition, morphological traits were recorded only once for each daughter, whereas DYD cal-culations for production and health traits included up to three lactations per cow. Finally, recording of CM started only recently and is not exhaustive [22], meaning that DYD information is available for fewer bulls, with smaller informative progeny groups. All these reasons explain why the power of detection decreased from analyses of milk composition to those of milk yield, udder type, SCS, and finally CM.
In the cow confirmation study, the sample size was larger than in the bull populations, but the reliability of the traits, equal to the heritability (for non-repeated records), was always lower than reliability of the DYD, and for CM, considerably so. Depending on the trait and the population in question, the power of detection in the cow populations was either higher (e.g., for HOL and MON and high or medium heritability traits) or lower (e.g., for CM). The resulting lower power of the validation #: number of a ID number associa
ted with a g
roup of Q
TL linked with udder tr
aits tha t had o ver lapping c onfidenc e in ter
vals or less than 1 Mbp distanc
e bet
w
een the bounds of the c
onfidenc e in ter vals b I ndividual Q TL; soma tic c ell sc or e (SCS), clinical mastitis sc or e ( CM), udder suppor
t (US), udder depth (UD
), f or e udder a ttachmen t (FU A ), r
ear udder heigh
t (RUH), f or e t ea t distanc e (FTD ), udder balanc e (UB), t ea t or ien ta tion ( TO ), t ea t length ( TL), and milk ing speed sc or e (MSS); c candida te v ar ian ts selec ted fr om sequenc e-based GW AS r esults Table 8 (c on tinued) Q TL ID a BTA Br eed Tr aits (# QT L b) Candida te varian ts c 50K SNP s Varian t with the most sig nifican t eff ec t # T otal # with ‑log 10 (P ) > 6 # in TOP10 Best r ank Total# # with ‑log 10 (P ) > 6 # in TOP10 Best rank Position (pb ) ID − log 10 (P) Func tional annota tion 61 29 HOL UD(3) 20 0 2 3 27 0 8 1 49,412,703 rs42194458 1.9 KCNQ1 intr on 61 29 HOL SCS(1) 11 0 4 1 25 5 6 2 50,066,017 rs133306466 2.2 IGF2 do wn ‑ str eam 61 29 HOL UB(2) 23 0 6 2 43 0 4 1 50,296,573 rs42196507 2.8 SY T8 upstr eam
dataset in some cases could be a possible explanation why certain variant effects were unconfirmed.
For these reasons, we were able to explain a higher percentage of genetic variance for the most heritable traits and to detect small QTL for the phenotypes with the highest accuracy. Regardless of the breed analyzed, our results varied widely among traits. We detected no QTL for CM, the trait with the lowest values of herit-ability (≤ 0.023) and reliherit-ability (≤ 0.43), while for FC and PC, which had the highest heritability (0.50) and reliability (0.92–0.94), we recovered the largest num-ber of QTL (up to 11 for PC in HOL) which together explained the highest percentage of genetic variance of any trait (up to 37% for FC in HOL). Because signifi-cant effects are likely to be overestimated, it is possible that the percentage of variance explained by each QTL may have been artificially high. The number of detected QTL was rather limited. This is explained by the very conservative detection threshold used (P ≤ 6.10−9; − log10(P) ≥ 8.2) that decreased power of detection and excluded the QTL with smaller effects. For example, by decreasing the detection threshold to − log10(P) = 7 (P ≤ 6.10−7), we identified two additional QTL for CM in MON and HOL. These were located in a single genomic region around 88.5 Mb on BTA6 in the region of the GC gene, where we had found significant effects on udder morphology traits and SCS (Fig. 5).
QTL confirmation rate
In spite of the application of a very strict detection threshold to the bull GWAS results, about one-third of these QTL were not found in the cow populations. Several explanations could explain this situation. First, it is important to note that nearly all the highly signifi-cant QTL and all the QTL present in several breeds or affecting several traits were confirmed. A few QTL with − log10(P) > 10 were not confirmed but this was due to technical problems, the best selected variants being lost during the design of the chip. Most unconfirmed QTL, especially for udder conformation (10 out of 16), were detected in the bull population with − log10(P) values between 8.2 and 10 and had − log10(P) < 6 in the cow populations. Two reasons may be advocated. For these QTL, annotations were frequently very poor and we may have selected inappropriate variants. This point is especially critical when a small number of variants was selected. Indeed, due to our selection strategy, the enrichment in candidate variants increased with sig-nificance level in the bull populations, QTL size, and QTL sharing across breeds and traits, and the smallest
QTL received a small number of candidate variants. In addition, we cannot exclude that some results that were unconfirmed in the cow population represent false positives.
QTL shared among breeds and traits
Although our results may have been shaped by fac-tors specific to the breeds, traits, and populations ana-lyzed here, still we successfully identified and validated QTL which were shared among more than one breed or related trait.
QTL shared among breeds
Five QTL associated with milk production traits were shared among all three breeds, while six other QTL were found in two of the three breeds (2 QTL for production and 4 for udder traits). Most of the QTL found in two breeds were shared between HOL and MON (4 QTL), probably because these were the two breeds FOR which we found the largest number of QTL. As mentioned above, the very strict detection threshold applied for the bull GWAS excluded some potential variants that also mapped at the same location for the same trait in another breed; thus, this reduced the number of significant results shared between breeds. For example, in the CI of QTL ID 42 (BTA5), detected for UD in HOL, we found a variant at 88,862,824 bp that also had, for the same trait, a sig-nificant effect in MON cows (− log10(P) = 7.4, results not shown) and an effect close to significance in MON bulls (− log10(P) = 7.2).
With these results, we were able to validate QTL shared among breeds for certain traits of interest. However, as previously reported from other studies conducted in multiple breeds at the nucleotide-level resolution [19,23], the variants with the most significant effects for a given trait differed largely among breeds. The reason for this result remains unclear. This could indicate that the causal mutations differed across breeds, but it may also be the result of differences in the quality of imputation of can-didate variants among breeds. Within a QTL region, the effects of variants with the highest imputation accuracy, which are not necessarily the same across breeds, were probably estimated more accurately and were thus more likely to be significant. As shown later in Discussion, this hypothesis seems to be supported by the fact that, for several QTL detected in more than one breed, a shared variant often ranked highly among the best significant variants, even if it was not the very best. Precise identi-fication of causal variants is further complicated by the presence of strong LD over large regions beyond the gene level.
Fig. 5 Validation GWAS: –log10(P) plotted against the position on Bos taurus chromosome 6 of variants linked with udder depth in a Montbéliarde and b Holstein cows, and c with somatic cell score (SCS) in Holstein cows; in black, 50K SNPs; in green, candidate variants; red circle indicates the variant with the most significant effect