HAL Id: inria-00433853
https://hal.inria.fr/inria-00433853
Submitted on 20 Nov 2009
HAL is a multi-disciplinary open access
archive for the deposit and dissemination of
sci-entific research documents, whether they are
pub-lished or not. The documents may come from
teaching and research institutions in France or
abroad, or from public or private research centers.
L’archive ouverte pluridisciplinaire HAL, est
destinée au dépôt et à la diffusion de documents
scientifiques de niveau recherche, publiés ou non,
émanant des établissements d’enseignement et de
recherche français ou étrangers, des laboratoires
publics ou privés.
Collaborative Exploration of 3D Scientific Data
Thierry Duval, Cédric Fleury, Bernard Nouailhas, Laurent Aguerreche
To cite this version:
Thierry Duval, Cédric Fleury, Bernard Nouailhas, Laurent Aguerreche. Collaborative Exploration of
3D Scientific Data. VRST 2008, ACM - ACM SIGGRAPH - SIGCHI, Oct 2008, Bordeaux, France.
pp.303-304, �10.1145/1450579.1450664�. �inria-00433853�
Collaborative Exploration of 3D Scientific Data
Thierry Duval∗
IRISA – Université de Rennes 1
Cédric Fleury†
IRISA – INSA de Rennes
Bernard Nouailhas‡
EDF R&D Clamart
Laurent Aguerreche§
IRISA – INSA de Rennes
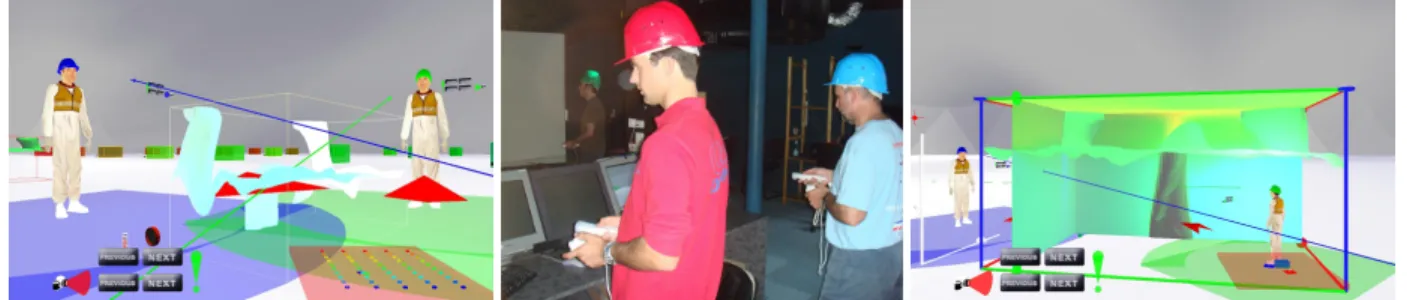
Figure 1: Data sets dispatched all around a CVE - Three users collaborating within a CVE - Merged data sets in a CVE
Abstract
This demonstration introduces new ways for exploring Collabora-tive Virtual Environments (CVE) that contain 3D scientific data sets obtained by simulation. In order to make decisions accordingly to their collective knowledge and understanding of the simulation, the users must collaborate and share experiences and comments. We provide tools to enable a good coordination between the users, and to make each user aware of the activity of others. Each user can navigate within the CVE: change her own position, orientation and scale. Each user can also add annotations within the virtual uni-verse. We propose several 3D layouts for the presentation of the data, associated with different 3D navigation tools. Consequently, the user can explore the data accoording to various parameters such as time or temperature. Last we propose a new 3D interaction tool, called 2D Cursor / 3D Pointer, dedicated to selection and manip-ulation of 3D objects, and application control. This 2D cursor is associated with a 3D geometry in order to make people aware of the activity of the users who are using this tool.
CR Categories: H.5.1 [Information Interfaces and Presentation (e.g. HCI)]: Multimedia Information Systems—Artificial, aug-mented, and virtual realities; I.3.6 [Computer Graphics]: Method-ology and Techniques—Interaction techniques
Keywords: 3D Interaction, Collaborative Virtual Environments, 3D Scientific Visualization
1
Context and goals
We want to use Virtual Reality techniques for collaborative visual-ization of 3D scientific data sets, to propose new ways to explore Collaborative Virtual Environments. Our goal is to allow several
∗e-mail: [email protected] †e-mail: [email protected] ‡e-mail: [email protected] §e-mail: [email protected]
experts to examine scientific data sets. These experts must collabo-rate in order to make decisions thanks to the sharing of their knowl-edge, experience and understanding of the simulation. The data sets used for this demonstration are 3D temperature isosurfaces or 3D temperature axial slice cuts, given at several simulation steps, and timestamped from the beginning of the simulation to a time when the simulation does not evolve any longer.
2
Exploration
2.1 Awareness of other users
People sharing a CVE need to be aware of the activity of other users [Fraser, M. et al. 1999], in order to help them to understand the evolution of the CVE and to collaborate more efficiently with the other users. Showing the activity of the other users is a crucial factor for an efficient collaboration. This is why each user of our CVE is associated with a 3D avatar: a worker with a colored helmet (for the snapshots, the users are also wearing a real colored helmet). In the same way, we visualize the tools each user is manipulating for 3D interaction within the CVE.
2.2 Navigation and coordination
We allow each user to navigate within the CVE: each user can change her position, her orientation and her scale. We provide tools to allow a good coordination between the users, and to make each user aware of the activity of other users: a user can watch other users work, a user can also join another user, ask for help, or grab another user to show her something. As described in [Mine et al. 1997] and [Duval and Chauffaut 2006], the interaction tools are used within the frame of the user (her position, orientation and scale), they navigate and change scale with her. Each user owns a 3D map of the world, which is a scalable World In Miniature [Stoakley et al. 1995] that can be useful for navigation, and within which the user can see the evolution of the virtual world, including the navigation and interactions of other users.
2.3 3D layouts for 3D scientific data sets
We propose several 3D layouts for the presentation of the scien-tific data sets, allowing to merge all the data at the same point or dispatching the data all over the 3D virtual world. Each kind of lay-out is associated with dedicated 3D widgets allowing to explore the
data sets either according to a temporal dimension, or to a temper-ature dimension, or to a geometrical dimension (for the data axial slice cuts along the X, Y and Z axis).
When the data sets are merged in a multidimensional “switch”, the navigation tools can be implemented for example as 3D sliders al-lowing to change the value of a parameter (time, temperature, X, Y or Z value). In this case, all the users share the same view of the merged data sets: the currently selected data set.
When the data sets are dispatched all over the world, the navigation tools can be some landmarks associated with each data, leading to another data linked to it according to the variation of a parameter (time, temperature, X, Y or Z value). In the latter case, each user can navigate freely and independently from other users all over the world. This is the situation where coordination tools are the most useful when some users want to meet somewhere.
2.4 3D data annotation
Each user can create annotations, global to the world or associated with a particular data, in order to share information with other users. These annotations can be used by other users when they explore the world to see what is interesting in some point of the universe. The annotations are currently implemented as interactive viewpoints: a user can switch from a viewpoint to another one, choosing either to explore only the viewpoints created by a particular user or to explore all viewpoints.
3
A new tool for collaborative interaction
The “3D Interaction Techniques for 3D Manipulation” chapter of [Bowman et al. 2004] presents a lot of metaphors dedicated to 3D manipulations. One of them, the ray-casting, is very interesting because it is simple and efficient, especially when used at close range. We have adapted this metaphor in order to drive it with a device providing only a 2D position, like a classical 2D mouse, a gamepad or a Nintendo wiimote remote controller.
3.1 Description of the 2D Cursor / 3D Pointer
The 3D geometry of this cursor is a virtual ray, so other users are made aware of the moves of this 3D pointer in the same way they are made aware of the evolution of classical 3D interaction metaphors. The user only controls the 2D position of the closest ray end, and we compute the orientation of the ray so that its pro-jection on the screen is always a point. This way, the user always feels that she is using a 2D Cursor while other users will see a 3D virtual ray (figure 2). So it is quite easy to use for the user, and quite easy to understand for the other users.
3.2 Adequation of this tool to 3D interaction
This tool is efficient for 3D object selection (for 3D annotation) and for viewpoint selection (for navigation) or for data sets exploration according to some parameters (by selecting a dedicated landmark). It is also efficient for 3D manipulation like moving a 3D slider cur-sor, here again for data sets exploration. As the tool moves with the viewpoint when the user navigates, like in 3DM [Butterworth et al. 1992], an object that has been grabbed by this tool navigates also within the VE, which is another way to provide a new position and orientation to this object. Last, this tool can simply be used as a classical 2D cursor to trigger some elements of a 3D GUI carried by the user, in order to control the state of the application. Hand [Hand 1997] separates virtual interactions into 3 categories: 3D interaction (selection and manipulation), navigation and
appli-cation control. Here we see that this new tool, carried by the user, is well suited for these three kinds of interactions.
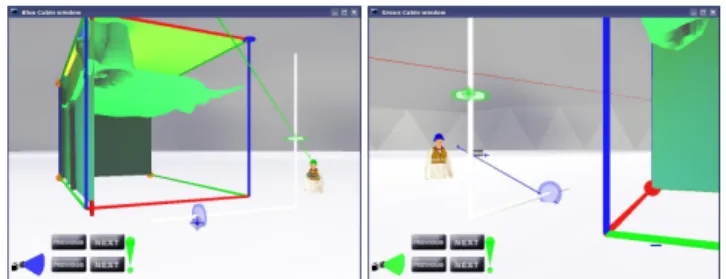
Figure 2: On the left we see the “Blue” user’s viewpoint: “Blue” user is ready to select a 3D slider with her blue 2D Cursor, she sees the green 3D Pointer of “Green” user ready to select another slider. On the right we see the “Green” user’s viewpoint, which is quite symmetric to “Blue” user’s viewpoint.
Acknowledgments
This work has been realized in a joint of the ANR N◦06 TLOG 031
Part@ge project and of the ANR N◦06 TLOG 029 SCOS project.
References
BOWMAN, D. A., KRUIJFF, E., LAVIOLA, J. J.,ANDPOUPYREV, I. 2004. 3D User Interfaces: Theory and Practice. Addison Wesley Longman Publishing Co., Inc., Redwood City, CA, USA. BUTTERWORTH, J., DAVIDSON, A., HENCH, S., ANDOLANO, M. T. 1992. 3dm: a three dimensional modeler using a head-mounted display. In SI3D ’92: Proceedings of the 1992
sym-posium on Interactive 3D graphics, ACM Press, New York, NY, USA, 135–138.
DUVAL, T., AND CHAUFFAUT, A. 2006. La cabine virtuelle d’immersion (cvi): un mode de transport des outils d’interaction dans les univers 3d. In IHM ’06: Proceedings of the 18th
inter-national conference on Association Francophone d’Interaction Homme-Machine, ACM Press, New York, NY, USA, 167–170. FRASER, M., BENFORD, S., HINDMARCH, J.,ANDHEATH, C.
1999. Supporting Awareness and Interaction through Collabora-tive Virtual Interfaces. UIST’99, Asheville, USA, 27–36. HAND, C. 1997. A survey of 3d interaction techniques. Computer
Graphics Forum 16, 5, 269–281.
MINE, M. R., FREDERICKP. BROOKS, J.,ANDSEQUIN, C. H. 1997. Moving objects in space: exploiting proprioception in virtual-environment interaction. In SIGGRAPH ’97:
Proceed-ings of the 24th annual conference on Computer graphics and interactive techniques, ACM Press/Addison-Wesley Publishing Co., New York, NY, USA, 19–26.
STOAKLEY, R., CONWAY, M. J., ANDPAUSCH, R. 1995. Vir-tual reality on a wim: Interactive worlds in miniature. In CHI
’95: Proceedings of the SIGCHI conference on Human factors in computing systems, ACM Press/Addison-Wesley Publishing Co., New York, NY, USA, 265–272.