Publisher’s version / Version de l'éditeur:
Canadian Geotechnical Journal, 17, 1, pp. 74-88, 1980-02
READ THESE TERMS AND CONDITIONS CAREFULLY BEFORE USING THIS WEBSITE. https://nrc-publications.canada.ca/eng/copyright
Vous avez des questions? Nous pouvons vous aider. Pour communiquer directement avec un auteur, consultez la première page de la revue dans laquelle son article a été publié afin de trouver ses coordonnées. Si vous n’arrivez pas à les repérer, communiquez avec nous à PublicationsArchive-ArchivesPublications@nrc-cnrc.gc.ca.
Questions? Contact the NRC Publications Archive team at
PublicationsArchive-ArchivesPublications@nrc-cnrc.gc.ca. If you wish to email the authors directly, please see the first page of the publication for their contact information.
NRC Publications Archive
Archives des publications du CNRC
This publication could be one of several versions: author’s original, accepted manuscript or the publisher’s version. / La version de cette publication peut être l’une des suivantes : la version prépublication de l’auteur, la version acceptée du manuscrit ou la version de l’éditeur.
Access and use of this website and the material on it are subject to the Terms and Conditions set forth at
Deformation behaviour and strength of frozen sand
Parameswaran, V. R.
https://publications-cnrc.canada.ca/fra/droits
L’accès à ce site Web et l’utilisation de son contenu sont assujettis aux conditions présentées dans le site LISEZ CES CONDITIONS ATTENTIVEMENT AVANT D’UTILISER CE SITE WEB.
NRC Publications Record / Notice d'Archives des publications de CNRC:
https://nrc-publications.canada.ca/eng/view/object/?id=ad5e858c-c635-48c7-99d7-ddfa9c9199e8 https://publications-cnrc.canada.ca/fra/voir/objet/?id=ad5e858c-c635-48c7-99d7-ddfa9c9199e8National Research Conseil national Ser
)i
Council Canada de recherches CanadaTHl
I N21d1
no.883
c . 2OF FROZEN SAND
ANALYZED
by V. R. Parameswaran Reprinted fromCanadian Geotechnical Journal Vol. 17, No. 1, February 1980 p. 74-88
DBR Paper No. 883
Division of Building Research
This publication is being distributed by the Division of Building Research of the National Research Council of Canada. It should not be reproduced in whole or in part without permission of the original publisher. The Division would be glad to be of assistance in obtaining such permission.
Publications of the Division may be obtained by mailing the ap- propriate remittance (a Bank, Express, or Post Office Money Order, or a cheque, made payable to the Receiver General of Canada, credit NRC) to the National Research Council of Can- ada, Ottawa. K I A 0R6. Stamps are not acceptable.
A list of all publications of the Division is available and may be obtained from the Publications Section, Division of Building Re- search, National Research Council of Canada, Ottawa. KIA OR6.
Deformation behaviour and strength of frozen sand
>
*"'*
b Geotechnical Section, Division of Building Research, Narional Research Council of Canada, Ottawa, Ont., Canada K I A OR6 Received April 25, 1979
Accepted October 24, 1979
Uniaxial unconfined compression tests were carried out on frozen saturated Ottawa sand
containing about 20% by weight of water, at temperatures between -2 and - 15"C, and at
strain rates varying between and 10-2 s-l. The compressive strength and the initial tangent
modulus increased with increasing strain rate and with decreasing temperature. At -2"C, values of strength and modulus were considerably lower than those predicted by linear extrapo- lation of the values observed at lower temperatures, on a log-log scale. This could be due to the
presence of unfrozen water in the samples at - 2°C.
Des essais de compression simple ont CtC faits sur du sable d'Ottawa gelk, sature B une teneur
en eau de 20%, sous des tempkratures de - 2 B
-
15"C, et B des vitesses de deformation variantde 10-7 B 10-2 s-l. La resistance en compression et le module tangent initial augmente avec une
augmentation de la vitesse de deformation et une diminution de la temperature. A -2"C, les valeurs de la resistance et du module sont considerablement plus faibles que celles deduites d'une extrapolation linhire sur une khelle log-log des resultats obtenus B plus basse tempera- ture. Ceci peut Stre dii B la presence d'eau non gel& dans les khantillons B -2°C.
[Traduit par la revue] Can. Geotech. J., 17, 74-88 (1980)
Introduction
Foundations in permafrost areas are usually de- signed to ensure preservation of the frozen ground. A pile foundation in frozen ground transfers the superimposed loads by two mechanisms: shear along the pile (adfreezing) and end bearing, the former being the major contributing factor. End bearing will be mobilized only after the adfreeze bond between a pile and the frozen ground is broken. The total bearing capacity of a pile is the sum of the calculated contributions of these two mechanisms. Empirical formulae for such calculations have been proposed by several workers in the Soviet Union (Vyalov and Porkhaev 1976), based on their experience with structures in the north.
A design value for end-bearing capacity of a pile can be obtained from the values of the compressive strength of the soil, determined under confined and unconfined conditions, and from long-term creep tests. Although frozen soil provides excellent bearing for structures, its strength is reduced rapidly with increasing temperature and it loses all strength on thawing. Hence for design of foundations the time- and temperature-dependent strength properties of, soils are important considerations.
Mechanical properties of frozen soils .have been studied in the Soviet Union from as early as 1920 (Tsytovich 1975), but the published material was generally incomplete as to description of soil and test- ing procedures. Since 1959, however, several Russian
publications describing detailed test procedures and giving extensive experimental data on the strength and deformation properties of frozen natural soils and clays have been translated by the U.S. Army Cold Regions Research and Engineering Labora- tories (CRREL), and the National Research Council of Canada (Tsytovich and Sumgin 1959; Tsytovich et al. 1973; Vylov 1965a,b; Vyalov and Porkhaev 1976).
More recently, several investigators have studied the deformation behaviour of natural and artificially frozen soils under various conditions of temperature and pressure. The mechanical properties of frozen soils are very dependent on soil characteristics such as frozen and unfrozen water contents, grain-size distribution, mineral content, ice lenses and layering, and externally imposed testing conditions such as strain rate, temperature, stress and strain history, and confining pressure. Owing to the varying nature of soils and conditions of experiment, it is difficult to compare or correlate the data obtained by different authors. However, one can still compare the results obtained for materials of the same type (such as quartz sands) tested under similar conditions of strain rate and temperature.
As part of an experimental program of laboratory model studies of foundations in frozen ground under- taken at the Division of Building Research, National Research Council of Canada, investigations were carried out on the temperature- and strain-rate-
0008-3674/80/010074-15$01.00/0
PARAMESWARAN 75
dependence of the strength of artificially frozen sand of uniform grain size and composition. In earlier papers (Parameswaran 1978a,b, 1979) the measure- ment of adfreeze strength under constant rates of loading and under constant loads were reported. This paper contains the results of the study of deformation behaviour and compressive strength of frozen sand as a function of strain rate and temperature. These results are also compared with the results obtained by several earlier workers for similar materials under comparable test conditions.
Experimental Method Materials and Sample Preparation
The sand used for preparing the test specimens was of the same grain size and composition as that used in earlier tests (Parameswaran 1978a,b, 1979), namely, Ottawa sand (ASTM Specification C-109, passing
S A N D S I Z E S
1
F I N E I M E D I U MI
C O A R S EI
D I A M E T E R , m m
FIG. 1. Grain-size distribution of Ottawa sand.
FIG. 2. Schematic diagram of apparatus to measure com- pressive strength of frozen sand. A = cylindrical sample (50.8 mm in diameter); B = Plexiglas vessel containing kero- sene; C = upper compression member from Instron load cell; D = cooling coil; T = thermocouple.
sieve No. 30 and retained on sieve No. 100) mixed with 14% by weight of water. When compacted this mixture had a optimum density of 1700 kg. m-3 (106 lb/ft3) as determined by a Proctor test. Figure 1 gives the grain-size analysis of the sand.
Cylindrical samples of frozen sand having dia- meter, D, of 50.8 mm (2 in.) and length of about 140 mm (5.5 in.) were prepared in a split Plexiglas mould by a method described by Baker (1976).
he
sand was compacted at optimum moisture content in layers in the mould, which was connected to a vacuum pump to remove the air. After evacuation the sand was saturated with deaerated distilled water prior to freezing.The specimens were frozen uniaxially in the mould inside an insulated box with the top end exposed to the air inside a cold room at -6OC. The water ex- pelled during freezing was removed from the bottom through a capillary tube containing a heater wire.
After freezing, the ends of a cylindrical sample were trimmed and faced in a lathe inside the cold room, and mounted in stainless-steel end caps using water as a filler material. The finished test specimens had a gauge length, L, of about 127 mm (5 in.) between the end caps (so that the LID ratio was greater than 2), and a total moisture content of about 20% by weight of soil grains.
Test Procedure
The cylindrical samples of frozen sand were tested under uniaxial compression in a floor-.model Instron
CAN. GEOTECH. J . VOL. 17, 1980 I I I I I I N O . i , ,-I
- -
28 6 . 5 5 ~ 1 0 - ~ " 30 2.62 r la-'-
35 1.31 i lo-' 36 2.62 i-
-
-
-
I
0 1 2 3 4 5 6 7 30 25 20 rn 0 I & 1 5 - "l Y I I l I I I N O . i . ,-I- -
3 7 6.55 i loe4-
38 1.31 x-
-
-
-
ir
37,:
0 1 2 3 4 5 6 7 1 1 1 1 1 1 N O . i , r - I- -
29. 32 1.31 r-
33 6 . 5 5 r 1 0 - ~-
-
-
-
S T R A I N . % S T R A I N . 1L S T R A I N , 1L a I- "l La) ( b l I c lFIG. 3. Stress-strain curves for frozen sand at - 2°C.
N O .
;.
, - I- -
25-
45 1 . 2 0 ‘ to-'-
4b 1 . 2 5 x lo-' 44 2.38 r loT6 20-
m-
L I 15-
-
V) u az C V) S T R A I N , % S T R A I N . % S T R A I N . %FIG. 4. Stress-strain curves for frozen sand at -6°C.
testing machine of 25 000 kg (25 tons) capacity,
inside a cold room maintained at -6 f 0.2OC. Each
test was carried out at a constant strain rate. To maintain constant specimen temperature during the test and to prevent sublimation of moisture from the surface, the sample was immersed in a kerosene bath. The bath temperature was maintained with an im- mersed heat exchange coil through which methanol at a constant temperature was circulated from a Tenney refrigerating chamber. Figure 2 is a schematic diagram of the test apparatus. Measurements were
made at strain rates (f) varying between and
s-I and at temperatures (T) of -2, -6,
-
10,and
-
15°C.Results
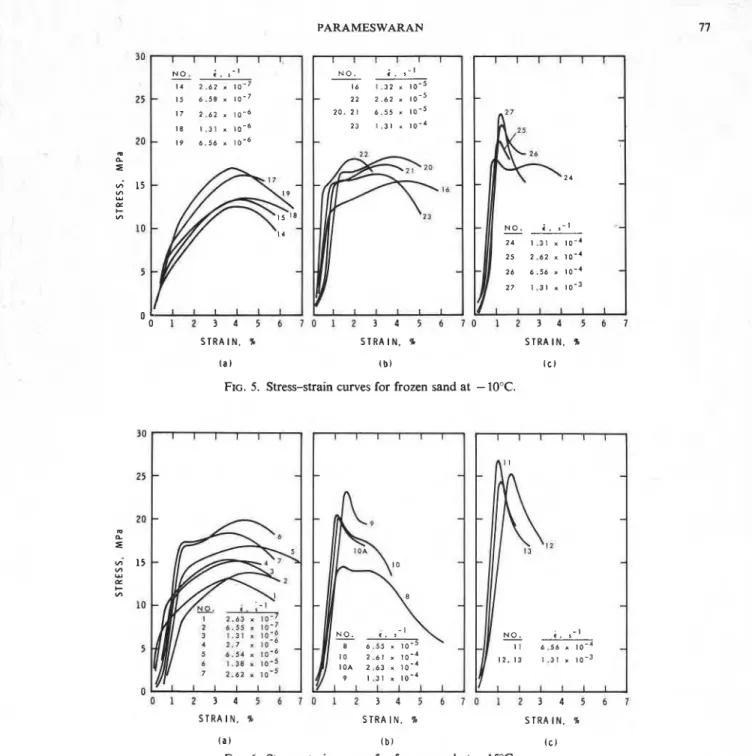
Figures 3-6 show the stress-strain curves obtained for various samples tested under different strain rates and temperatures. Details concerning strain rates, temperatures, maximum stress observed, etc. are given in Table 1. The stresses and strains were cal- culated from the load-displacement charts from the testing machine. The general observations are as follows.
PARAMESWARAN 30 N O . ;, 5 - 1 -- 14 2.62 r 16 1.32 r 1 0 ' ~ 25
-
I5 6.58 x-
2 2 2.62 r 17 2.62 x 1 0 . ~ 20, 21 6.55 i lo-' 18 1.31 r 23 1 . 3 1 ~ 1 0 ~ ~ 20-
19 6 . 5 6 x-
rn n I 2 4 1 . 3 1 ~ 1 0 ~ ~ 25 2.62 r 5-
-
S T R A I N . % l a ) S T R A I N . % l b lFIG. 5. Stress-strain curves for frozen sand at - 10°C.
1 1 1 1 I
-
-
-
-
-
N O . < , r- -
-
8 6.55 r 1 0 . ~-
10 2.61 r IOA 2.63 x 9 1,31 r S T R A I N . % I c ) S T R A I N , % S T R A I N . % S T R A I N . % ( a ) ( b ) ( c )FIG. 6. Stress-strain curves for frozen sand at - 15°C.
1. Specimens deform elastically in the early stages of deformation, i.e., for strains less than 1%. The transition from elastic to plastic deformation is not sharp at high temperatures (-2 and -6°C) and at low strain rates.
2. As the strain rate increases, the specimens show an upper yield point at the end of the elastic region and a small drop in stress before plastic deformation starts.
3. For tests at low strain rates, the specimens de- form plastically to some extent (up to 4%) before attaining the maximum stress at which failure occurs. At higher strain rates, the maximum stress occurs soon after the end of the elastic region, with very little plastic deforniation occurring (Figs. 3c; 4c;
5 c ; 6 b,c). In these cases the maximum stress (i.e., compressive strength) coincides with the upper yield stress. These specimens fail essentially in a brittle
TABLE 1. Values of the compressive failure strength (maximum stress observed), and initial tangent modulus for frozen sand, at various strain rates and temperatures
Strain Strain Strain Strain
Test rate, E omax El Test rate, i om,, El Test rate, E omax El Test rate, i om,, El
No. s ) (MPa) (MPa) No. s ) (MPa) (MPa) No. ( I ) (MPa) (MPa) No. ( s ) (MPa) (MPa) (1) (2) (3) (4) (5) (6) (7) (8) (9) (10) (11) (12) (13) (14) (15) (16) a
1 2.63 X 13.1 14 2.62 X 12.55 41 1.65 X 9.02 31 2.62 X 6.81
5
2 6.55 X lo-' 13.83 962 15 6.58 X lo-' 13.37 43 6.0 X 10.30 34 6.55 X lo-' 7.843 1.31X10⁻⁶ 15.26 1644 16 1.32 X 15.47 1945 44 2.38X10⁻⁶ 12.38 1389 33 6.55 X 12.50 521
$
4 2.7 X 15.21 1875 17 2.62 X 16.14 1072 45 1 . 2 0 X 1 0 - 6 12.96 2000 29 1.31 X 10.79 595 5 6.54 X 16.86 1607 18 1.31 X 13.50 46 1.25 X 12.52 2000 32 1.31 X 12.77 595 6 1.38 X 19.96 1833 19 6.56 X 16.99 47 3.98 X 13.70 30 2.62 X 13.90 541 7 2.62 X 17.37 2500 20 6.55X10-s 18.29 48 1.25X10⁻⁴ 16.29 2333 28 6.55 X 11.67 1000 F 8 6.55 X 14.56 21 6.56 X 17.37 2609 49 5.15 X lo-' 14.82 3530 35 1.31 X lo-' 13.81 1167 C 9 1.31 X lo-' 23.13 2553 22 2.62X10⁻⁶ 18.08 50 5.53 X 14.17 2619 36 2.62 X lo-' 13.16 1216 10 2.61 X lo-' 20.16 2500 23 1.31X10-' 16.39 2273 51 1.31 X 15.10 3333 37 6.55 X los4 11.89 25002
10A 2.63 Xlo-'
20.51 2917 24 1 . 3 1 X 1 0 - 4 18.00 3147 52 2.62 X 1 C 3 17.00 3125 38 1.31 X 13.09 2692 <. 11 6.56 X 26.84 3958 25 2.62 X lo-' 20.04 2895 53 5.45 X 19.53 3750 58 1.97 X 12.81 ,-. w 12 1.31 X 25.26 2162 26 6.56X10⁻⁴ 21.88 54 1.19 X 21.83 4822 59 1.98 X 10.21 m 0 13 1.31 X 24.36 3600 27 1.31 X 23.18 4167 60 3.95 X 7.11 61 1 . 3 1 X 1 0 - 7 5.14 62 3.95 X 13.49 63 1.31 X 12.27 64 3 . 9 1 X 1 W 4 10.59 65 1.97X10⁻³ 13.48PARAMESWARAN 79
4. The maximum stress observed at the beginning of failure increased with increasing rates of strain and with decreasing temperature. For the range of strain rates investigated, namely lo-' to s-l, the strength was found to increase linearly with strain rate on a log-log scale, for temperatures a t and below -6°C (Fig. 8n). There was no change of slope for linear behaviour. At -2"C, a distinct transition was observed at a strain rate of about s-l. The variation of strength with strain rate at -2OC is shown in Fig. 8b. For strain rates smaller than s-l, the strength increased linearly with increasing strain rate. For strain rates larger than s-l, the strength appeared to be independent of strain rates. This can also be seen from the stress-strain curves
FIG. 7. Typical brittle fractures observed at high strain rates shown in Fig. 3. The straight lines plotted in Fig. 8u (temperature = -6"C, i
>
s-I). for temperatures -6,-
10, and-
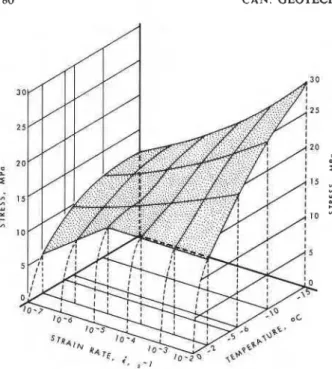
15"C, respectively,are least squares lines fitted by linear regression manner. Figure 7 shows typical brittle fractures analysis of the data. Figure 9 shows the maximum observed at high strain rates. failure stress (strength) plotted as a function of
I ' " " " ' I ' " " " ' I '"""9
-
-
- - - - 0 -6°C-
4-
-A - 1 0 " ~ .-.-0 -15OC 1 1 1 1 1 1 , 1 1 1 1 1 1 , , 1 1 ( 1 , , , , , , , , L , L l 1 , , , ,,, 1 , , , , S T R A I N R A T E , ; , 5 - 1 S T R A I N R A T E . ; , s - 180 CAN. GEOTECH. J. VOL. 17, 1980
FIG. 9. Composite diagram showing compressive strength as a function of temperature and strain rate.
temperature and strain rate in a three-dimensional plot.
5. The slope of the initial elastic (or pseudoelastic) region of the stress-strain curve (called the initial
tangent modulus Ei) increased with increasing strain rates, at a particular temperature. -Table 1 also gives values of the initial tangent modulus Ei from various tests. The variation of the initial tangent modulus with strain rate is shown in Fig. 1Q a and b.
Discussion
Initial Yield and Plastic Flow
The initial yield stress observed in samples tested at low temperatures and high strain rates (for example, samples 16-23 in Fig. 5 b ; 5-7 in Fig. 6a),
has been attributed to yielding of the ice matrix (Sayles 1974; Parameswaran and Jones 1980). After this initial yield, the stress drops because the stress required to maintain the strain rate is smaller than that required to initiate the yield. Such yield drops have been observed in many other materials such as carbon steels, ionic crystals, silicon, and germanium, although the mechanism involved is entirely different from that occurring in frozen sand. The increase in stress after the yield drop is due to the development of the frictional component of strength. This fric- tional component develops rapidly with slow rates of deformation under uniaxial compression and hence, at low strain rates, one does not observe the yield drop. At high strain rates, lack of confining pressure permits rupture of the sample prior to development of the full frictional component. This was confirmed
S T R A I N R A T E . c , r - I
PARAMESWARAN 81
TABLE 2. Strength of frozen sand at various strain rates and temperatures obtained by different authors Maximum
Temperature Strain rate stress
Authors ("c) (s-1 (MPa) Material and test method
Sayles (1966)
-
40 5.5 x lo-' 38.6 Saturated Ottawa fine sand (aver-age grain dia. = 0.2-0.6 mm), constant rate compression tests -50 to -186 5.5
x
lo-" 35.9 (Stress independent of temp. be-low -50°C)
Sayles and Epanchin (1966)
-
3 3.33 X 10-'to 2.5 x 10.35-15.86 Saturated Ottawa fine sand (aver- -6.5 3.33 X 10-'to 2.5 X 13.79-20.69 age grain dia. = 0.2-0.6 mm),- 10 3.33 X lo-' to 2.5 X 17.93-27.58 constant rate compression tests
-
30 3.33 X 10-'t02.5 X 28.96-48.27Sayles (1968)
-
10 5.5x
lo-' 17.44 Saturated Ottawa fine sand (aver--4.2 5.5
x
lo-' 10.10 age grain dia. = 0.2-0.6 mm), -1.7 5.5x
lo-' 9.10 constant rate compression tests-0.56 5.5
x
lo-' 5.14Sayles (1974) -3.85 1.67 x lo-= to 1.67 x 8-17 Saturated Ottawa fine sand (aver- age grain dia. = 0.2-0.6 mm), constant rate compression tests Goughnour and Andersland (1968) -3.85 4.43 x 10- 5.38 Saturated Ottawa fine sand (aver- -12.0 2.22 x 10- 8.27 age grain dia. = 0.2-0.6 mm), -12.0 4.43 X 10- 9.38 constant rate compression tests
-7.55 4.43 X 10- 7.59
Alkire and Andersland (1973) - 12 4.43 X lo-K -7 Saturated silica sand (average particle dia. = 0.6-0.84 mrn),
constant rate compression tests
-
12 10-7-10-6 0.5-6.0 Constant load creep tests Chamberlain er al. (1972) - 10 9.67 X lo-' 24.55 Saturated Ottawa banding sand,0.1-0.2 mm dia., constant rate test under 3.5 MPa confining pressure
Ladanyi and Arteau (1978) - 5 1.67 X 10⁻⁸to 1.67 x 10⁻⁸ 3-11 Saturated quartz sand from St. Canut, Quebec, 0.26-0.6 mm dia., constant rate compression tests
Eckardt (1978) - 15 2.1 X 10⁻⁷ 4.0 Frozen medium sand (water con-
9.72
x
10-7 6.0 tent = 12'33, constant rate 4.07 X 10⁻⁶ 7.0 compression tests1.53 X 8 .O
Parameswaran and Jones (1979)
-
12 10-6-10-2 16-28 Saturated Ottawa fine sand, con- stant rate tests under confining pressure of 5 MPaParameswaran (present results) - 2 10-7-10-z 6-12.5 Saturated Ottawa fine sand, con-
-6 10-7-10-2 10-20 stant rate uniaxial compression
-
10 10-7-10-2 11.5-25 tests- 15 10-7-10-2 12-29
'I by Parameswaran and Jones (1980) who observed Comparison o f the Present Results with Earlier Work
that in samples of the same material tested at a It is worthwhile to compare the present results with particular strain rate (7.7 X s-I) under triaxial some earlier work on similar materials under condi- R conditions, increased hydrostatic confining pressure tions very similar to those used here. Table 2 gives the suppressed the yield drop and decreased the tendency values of the maximum stress (or strength of the of brittle fracture, thereby allowing the specimen to material) observed under various temperatures and
82 CAN. GEOTECH. J. VOL. 17, 1980
S T R A I N R A T E . i 5 - 1
FIG. 11. Comparison of the results obtained in this study with those of other authors. PJ = Parameswaran and Jones (1979); G A = Goughnour and Andersland (1968); E = Eckardt (1978); LA = Ladanyi and Arteau (1978).
present results are plotted in Fig. 11, which shows that the present results fall closely in line with the data of Sayles (1966, 1968), and Sayles and Epanchin (1966). This is not fortuitous, because the material and sample preparation technique, and to some extent the testing methods, used in the present experiments were very similar to those used by Sayles (1968). The data of Parameswaran and Jones (1980), obtained under triaxial conditions at
-
12°C (line PJ in Fig. l l ) , lie between the present lines for-
10 and - 15°C and parallel to them. The data of Ladanyi and Arteau (1978) for-
5°C fall consistently below the present line for -6°C; however, they also find a linear increase of strength with increasing strain rates on a log-log scale, for a wide range of strain rates.Strain-rate-dependence of Strength
The linear variation of strength with strain rate on a log-log scale in Fig. 8a indicates that these two quantities can be related to each other by an empirical power law equation of the type
where n = l/m. The values of m and n obtained by linear regression analysis of the data at various temperatures are:
An empirical relationship similar to [2] has been observed earlier by Sayles and Epanchin (1966) and Sayles (1974) for Ottawa sand having the same density and moisture content as the present samples.
For strain rates between 1.67 X and 2 X lod2
s-l, Sayles and Epanchin (1966) obtained the follow- ing values for the exponents m and n:
Values of 0.1 and 10 for m and n, respectively, for
strain rates between 1.67 X and 1.67 X 1W2 s-l,
were obtained by Sayles (1974) from triaxial con- stant strain-rate tests at -3.85"C.
In the present series of tests at -2OC (Fig. 8b), a transition in the mode of deformation behaviour is
indicated for strain rates below 6 X s-l. Earlier
authors (Sayles and Epanchin 1966; Sayles 1974) did not see this transition in frozen sand, probably because they did not test at low enough strain rates
(lower than s-l).
Such a transition in the mode of failure, indicated by a change in slope for the log (o) versus log (f)
curve, has been observed in ice. Dillon and Anders-
land (1967) analyzed the experimental creep data 1
available in the literature and found that a transition from one mode of creep behaviour to another occurs for ice at a strain rate of about 1.67 X lW7 s-l, for temperatures as low as
-
15°C. They postulated that the behaviour in the low strain-rate region could be explained by creep occurring at the grain boundariesPARAMESWARAN 83
in ice, with diffusion or accommodation cracking taking place primarily at grain boundaries. Barnes et al. (1971) have suggested that for moderate
stresses at temperatures between -8 and - 1°C,
creep in polycrystalline ice is associated with both a liquid phase at the grain boundaries and grain boundary sliding. Combining these postulates with the present experimental observation at -2OC, it is presumed that the low strain-rate behaviour is governed by the unfrozen water content in the frozen sand specimens. For sand, the unfrozen water con- tent is 0.2y0 by weight at -OS°C, but 0 at -4OC and below (Tsytovich 1975). At -2"C, there is still some unfrozen water (although negligible) around each sand grain.
Anderson et al. (1973) proposed an equation to calculate the unfrozen water content, W,, at any temperature below freezing, using the specific surface area, S, of the soil grains.
[3] In (W,) = a
+
b In (S)+
C(S)d In (0)When S is expressed in square metres per gram and 0 is the soil temperature in degrees Celsius below freez- ing, W , is obtained as gram HzO per gram soil. Values of the constants a, b, c, and d, determined from isothermal calorimetric measurements of speci- fic heat capacities of various representative soils, were: a = 0.2618, b = 0.5519, c =
-
1.449, and d =-
0.2640.The specific surface area of Ottawa sand, calcu- lated from grain-size analysis, was 0.0056 m2/g. Using this value of S and the values of a, b, c, and d in [3], the amount of unfrozen water content in Ottawa sand at -2°C (i.e., 0 = 2) is 0.001433 g Hz0 per gram soil or 0.1433% by weight. This is a negligible quantity for practical purposes and is too small to be measured by any physical methods.
. The amount of unfrozen water around each grain,
however, is increased considerably due to pressure melting of ice, caused by stress at the interparticle contact point. For example, the pressure at the contact point of a rounded quartz grain of 1 mm (0.04 in.) diameter with a flat ice interlayer (elastic moduli for quartz and ice being 2.94 X lo4 MPa (4.26 X lo6 psi) and 2.94 X lo3 MPa (4.26 X lo5 psi) respectively), calculated by Tsytovich (1975) from Hertz formulae in elasticity theory, was about 115 MPa under an external pressure of 0.2 MPa. This shows that the external applied force is multiplied by a factor of about 575 or more, at the interparticle
s contact point. For two hard particles the factor is
even larger. Using this factor, an external load of 5 MPa (725 psi) will become 2875 MPa (4.17
x
lo5 psi) at the interparticle contact points. Thispressure is almost equal to the value of the theoretical elastic shear modulus for ice, and high enough to cause pressure melting at the interparticle junction. At a temperature of -2°C all the water may not be able to freeze during the test, and at low enough strain rates, it could migrate within the soil sample and cause a low value of strength. Hence there is the drop in the curve for -2°C below a strain rate of
s-'.
From the slope of the straight line portion of the curve in Fig. 8b, where the strength depends on strain rate, the calculated value of the exponent n was 5.41. This is very close to the value of n = 5 observed by Ramseier (1972) in polycrystalline natural ice under steady-state creep conditions, when stresses are high enough to induce cracking and failure.
Temperature-dependence of Strength
Several authors have attempted to apply the theory of rate processes proposed by Glasstone et al. (1941) to explain the temperature-dependence of strength of frozen and unfrozen soils (Alkire and Andersland 1973; Andersland and Akili 1967; Andersland and AlNouri 1970; Goughnour and Andersland 1968; Hooke el al. 1972; Mitchell et al. 1968; Vyalov 1965a,b, 1978a,b). The theory of absolute reaction rates, commonly known as the rate process theory, can be applied to any process involving the time- and temperature-dependent rearrangement of matter, and hence it was thought that this theory could appro- priately describe and predict soil behaviour under stresses. According to the theory, the deformation of frozen soil can be considered as a thermally activated process. General expressions relating the rate of deformation i, temperature T, and stress u are as follows:
[4] i = Eo exp (- AG/RT) exp
Bu
[5] i =
Con
exp (- AG/RT)In these equations, 60 and
C
are frequency factors that depend on the thermal fluctuations or frequency of thermal activation; AG is an activation energy to be supplied for each activation process; and B is a factor having dimensions of (stress)-'. The param- eters €0, C , and AG are functions of temperature, stress, and the structure of the material at the instant of measurement. Assuming that the soil structure, the parameters io and B, and the activation energy AG are relatively insensitive to small changes in temperature, one can differentiate [4] after taking logarithms of both sides and obtain:84 CAN. GEOTECH. J. VOL. 17, 1980
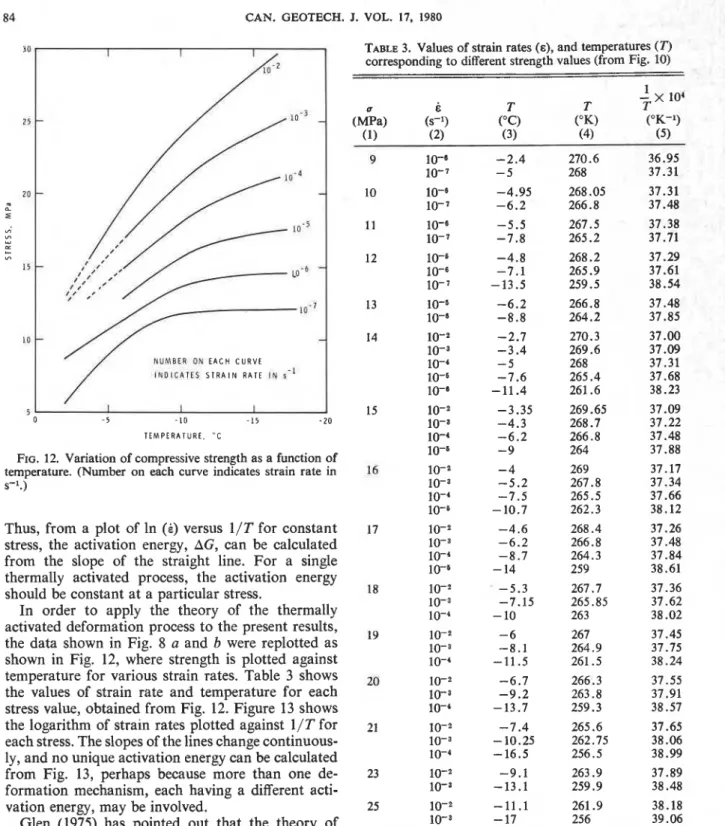
TABLE 3. Values of strain rates (E), and temperatures ( T ) corresvonding to different strength values (from Fig. 10)
I
/
l N O l C A T E S S T R A I N R A T E I N 5.'I
T E M P E R A T U R E . " C
FIG. 12. Variation of compressive strength as a function of temperature. (Number on each curve indicates strain rate in s-I.)
Thus, from a plot of In ( E ) versus 1/T for constant stress, the activation energy, AG, can be calculated from the slope of the straight line. For a single thermally activated process, the activation energy should be constant at a particular stress.
In order to apply the theory of the thermally activated deformation process to the present results, the data shown in Fig. 8 a and b were replotted as shown in Fig. 12, where strength is plotted against temperature for various strain rates. Table 3 shows the values of strain rate and temperature for each stress value, obtained from Fig. 12. Figure 13 shows the logarithm of strain rates plotted against 1/T for each stress. The slopes of the lines change continuous- ly, and no unique activation energy can be calculated from Fig. 13, perhaps because more than one de- formation mechanism, each having a different acti- vation energy, may be involved.
Glen (1975) has pointed out that the theory of thermally activated plastic flow governed by an Arrhenius equation of type [4] can be applied to ice only at temperatures below
-
10°C. Above this temperature, the Arrhenius equation breaks down and, as pointed out earlier, other processes such as grain boundary flow and liquid phase transport (tolo-'
10- 10-6 10- 10-6 10-6 lo-' 10- 10-6 lo-' 10- 10-3 1 0 4 10-6 lo-" 10- 10-8 lo-' lo-" 10-2 lo-' 10-6 10-2 10-3 lo-' 10-6 10-2 10-~ 10-2 lo-' 10- 10-3 104 10-2 lo-" 10-2 10-8 10-2loe3
be discussed in a subsequent section) govern the deformation behaviour. In the case of frozen sand, this transition temperature could be further lowered since the stresses at the interparticle junctions cause pressure melting of the ice matrix.
PARAMESWARAN 85
-
-
-
-
CURVE INDICATES-
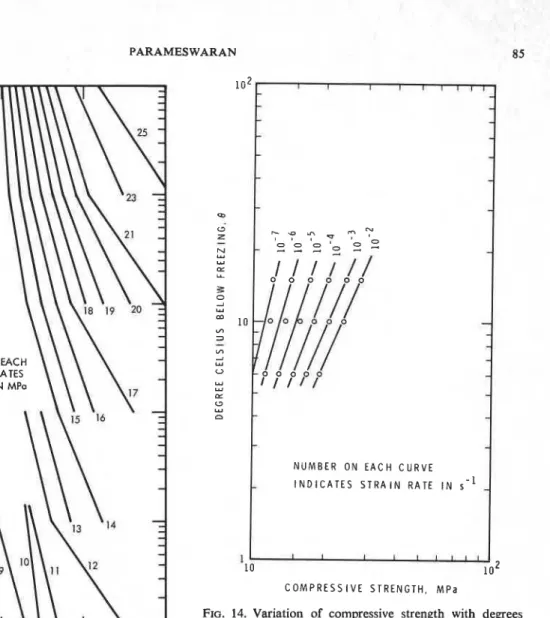
NUMBER O N EACH STRENGTH I N MPaCOMPRESSIVE STRENGTH. MPa
FIG. 14. Variation of compressive strength with degrees Celsius below freezing. (Number on each curve indicates strain
3 6 3 7 3 8 3 9 rate in s-I.)
FIG. 13. Variation of log (strain rate) with 1 / T for various stresses, from Table 3. (Number on each curve indicates stress in MPa.)
Figure 14 shows the strength values plotted against temperature, 0 (degrees Celsius below freezing), on a log-log scale, for various strain rates. At higher strain rates, linear variation is seen and the slope of the lines is about 0.44. This suggests that strength varies with temperature according to an equation
where s = 0.44.
A similar equation was proposed earlier by Tsyto- vich (1975) and a value of s = 0.5 was observed in some of his experiments. Figure 15 shows the strain
rates plotted against temperature, 0 (degrees Celsius below freezing), for various values of peak stress. Here again a linear variation was observed with almost the same slope for the higher strain- ate region (> 10-5 s-1).
The present data show that the temperature de- pendence of strength cannot be explained by a thermally activated theory of deformation, but by the simple power law proposed by Tsytovich (1975). Further experiments at lower temperatures are in progress to see if the deformation process at lower temperatures can be associated with a thermally activated process.
Deformation of frozen sand occurs mainly by deformation occurring in the ice phase with mobili- zation of soil grain friction at the later stages of de- formation. An appropriate model that could be used to depict this behaviour is that of the flow of a
86 CAN. GEOTECH. J. VOL. 17, 1980
-
lo25
4d
-
I
I
I
I
I-
-
Z
-
-
-
z
-
-
NUMBER O N EACH CURVE-
-
w INDICATES STRESS I N MPa
E
-
-
Y
STRAIN RATE. i s-'
FIG. 15. Variation of strain rate with degrees Celsius below freezing, for constant stress values, from Table 3.(Number on each curve indicates stress in MPa.)
material in presence of an aqueous fluid phase or partial melt, which is a model of fluid phase transport. The model is based on the idea that a deviatoric stress causes difference in pressure between points of contact of granules, which in turn leads to a chemical potential of ions between those points where the pressure is high and those where it is Iower. The parallel to this is Coble creep at high temperature in polycrystalline single-phase materials where the dif- fusive transport occurs through the grain boundary
(Coble 1963). In frozen sand, the fluid phase simply replaces the g a i n boundary as a diffusive path. In
such a material where liquid transport bring about deformation, a change in temperature can alter the proportion of the liquid phase and a spurious effect due to structural change is also introduced. Hence the usual temperature-change experiments may not give appropriate activation energies.
The model is essentially a qualitative one. Gittus (1977, 1978) has applied the model somewhat quantitatively to deformation of superplastic alloys at elevated temperatures.
Strain-rate- and Temperature-dependence of the Tnitia I Tangent Modtrltrs
Although the bchaviour of soil may not be strictly represented as linear elastic, solutions based on the
assumption of Iinear elastic behaviour are commonly
used for estimation of stresses in the field. For this, a knowledge of the initial tangent modulus
Ei
is needed. Knowledge ofEi
is also essential to predict the dynamic response of frozen ground when geo- physical exploration techniques are used or when the region is hit by an earthquake.Values of the initial tangent modulus calculated from the slopes of the early elastic (or pseudoelastic) part of the stress-strain curves (Figs. 3-6) are shown in Table 1. The modulus
Ei
was found to increasewith increasing strain rates and decreasing tempera-
ture. Figure loo shows the initial tangent modulus plotted against log (strain rates) for various ternpera- tures. Figure 106 shows the modulus plotted against strain rates on a log-log scale. In this figure it can be seen that the modulus values at -Z°C are consider-
ably smaller than the values for lower temperatures, for the lower strain-rate region. At higher strain rates, the modulus tends to approach values closer to the low temperature values. The lower values of modulus at -2°C at the lower strain rates of deformation support the earlier proposition that the amount of
unfrozen water at
-
2OC, under superimposedstresses, could be much larger than theoretically calculated from [3]; at lower strain rates, this water has sufficient time to migrate within the sample and reduce strength as well as modulus.
Conclusions
Uniaxial unconfined compression tests of cylindri-
cal samples sf frozen Ottawa sand containing about
20% by weight of water showed the following results. 1. Strength increases with increasing strain rates
and decreasing temperatures. Between le7 and
1 0 - 2 s-l, the strength showed a linear variation with
strain rate on a log-log scale, for temperatures -6,
-
10, and-
15°C. At -2OC, for strain rateslower than 6 X s-l, the same linear increase of
PARAMESWARAN 87
strain rates larger than s-l, the strength was not dependent on the strain rate.
2. The initial tangent modulus, Ei, increased with increasing strain rates. The variation was linear for temperatures -6, - 10, and - 15"C, on a log-log
5 scale. At -2OC, the values of
Ei
were considerablysmaller than those at lower temperatures. For strain rates larger than s-l, the values of
Ei
at -2OCI tended to approach the values at lower temperatures. 3. The considerably lower values of modulus and
strength at -2OC, as compared with those at lower temperatures, were probably due to larger amounts of unfrozen water present at -2OC. This unfrozen water exists due to the magnification of the super- imposed stresses by a large factor at interparticle junctions, thereby causing pressure melting to occur. 4. Analysis of the present data according to the theory of thermally activated deformation process could not give a unique activation energy. Instead, the data could be fitted reasonably well to simple power laws relating strength and strain rate, and strain rate and temperature.
Acknowledgements
The author acknowledges with pleasure the assist- ance of G. Mould and C. Hubbs in the laboratory. The author expresses his sincere thanks to his colleague, Harry Baker, for some useful discussions on the testing of frozen sands. Thanks are also due to Dr. Stephen Jones of the Glaciology Division, Department of Fisheries and Environment, for the use of the low temperature Tenney refrigeration unit. This paper is a contribution from the Division of Building Research, National Research Council of Canada, and is published with the approval of the Director of the Division.
ALKIRE, B. D., and ANDERSLAND, 0. B. 1973. The effect of confining pressure on the mechanical properties of sand ice
materials. Journal of Glaciology, 12, pp. 469-481. ANDERSLAND, 0 . B., and AKLLI, W. 1967. Stress effect on creep
rates of a frozen clay soil. Gbtechnique, 17: pp. 27-39. ANDERSLAND, 0. B.. and ALNOURI, I. 1970. Tlrne-dependent
strength behaviour of frozen soil. ASCE Journal of the Soil Mechanics and Foundations Division, 96(SM4), pp. 1249- 1265.
ANDERSON, D. M., TICE, A. R., and MCKIM, H. L. 1973. The unfrozen water and the apparent specific heat capacity of
I frozen soils. Permafrost, North American Contribution to
the 2nd International Conference, National Academy of Sciences, Washington, DC, pp. 289-295.
BAKER, T. H. W. 1976. Preparation of artificially frozen sand 4
specimens. Division of Building Research, National Re- search Council of Canada, Ottawa, Ont., NRCC 15349. BARNES, P., TABOR, D., and WALKER, J. C. 1971. The friction
and creep of polycrystalline ice. Proceedings, Royal Society of London, A.324, pp. 127-155.
CHAMBERLAIN, E., GROVES, C., and PERHAM, R. 1972. The mechanical behaviour of frozen earth materials under high pressure triaxial test conditions. GCotechnique, 22, pp. 469- 483.
COBLE, R. L. 1963. A model for boundary diffusion controlled creep in polycrystalline materials. Journal of Applied Physics, 34, pp. 1679-1682.
DILLON, H. B., and ANDERSLAND, 0. B. 1967. Deformation rates of polycrystalline ice. Physics of Snow and Ice, Pro- ceedings, International Conference on Low Temperature Science, The Institute of Low Temperature Science, Hok- kaido University, Sapporo, Japan, pp. 313-328.
ECKARDT, H. 1978. Creep behaviour of frozen soils in uni- axial compression tests. Proceedings, International Sym- posium on Ground Freezing, Ruhr University, Bochum, Germany, Vol. 2, pp. 81-93.
GITTUS, J. H. 1977. Theory of superplastic flow in two-phase materials: roles of interphase-boundary dislocations, ledges, and diffusion. ASME Journal of Engineering Materials and Technology, 99, Series H, pp. 244-251.
1978. High-temperature deformation of two phase structures. Philosophical Transactions, Royal Society of London, A.288, pp. 121-146.
GLASSTONE, S., LAIDLER, D., and EYRING, H. 1941. The theory of rate processes. McGraw-Hill Book Company, New York, NY.
GLEN, J. W. 1975. The mechanics of ice. U.S. Army, Corps of Engineers, Cold Regions Science and Engineering Mono- graph 11-C2b. 47 p.
GOUGHNOUR, R. R., and ANDERSLAND, 0. B. 1968. Mechanical properties of a sand-ice system. ASCE Journal of the Soil Mechanics and Foundations Division, 94(SM4), pp. 923- 950.
HOOKE, R. LEB., DAHLIN, B. B., and KAUPER, M. T. 1972. Creep of ice containing dispersed fine sand. Journal of Glaciology, 11, pp. 327-336.
LADANYI, B., and ARTEAU, J. 1978. Effect of specimen shape on creep response of a frozen sand. Proceedings, International Symposium on Ground Freezing, Ruhr University, Bochum, Germany, Vol. 1, pp. 141-153.
MITCHELL, J. K., CAMPANELLA, R. G., and SINGH, A. 1968. Soil creep as a rate process. ASCE Journal of the Soil Mechanics and Foundations Division, 94(SM1), pp. 231- 253.
PARAMESWARAN, V. R. 1978~. Laboratory studies of the ad- freeze bond between small scale model piles and frozen sand. Proceedings, 3rd International Conference on Permafrost, National Research Council of Canada, Ottawa, Ont., Vol. 1, pp. 714-720.
19786. Adfreeze strength of frozen sand t o model piles. Canadian Geotechnical Journal, 15, pp. 494-500.
1979. Creep of model piles in frozen soil. Canadian Geotechnical Journal, 16, pp. 69-77.
PARAMESWARAN, V. R., and JONES, S. J. 1980. Triaxial testing of frozen sand. Journal of Glaciology. In press.
RAMSEIER, R. 0. 1972. Growth and mechanical properties of river and lake ice. Ph.D. thesis, Lava1 University, Quebec, P.Q.
SAYLES, F. H. 1966. Low temperature soil mechanics-interim report. U.S. Army, Corps of Engineers, Cold Regions Re- search and Engineering Laboratory, Hanover, NH, Techni- cal Note.
1968. Creep of frozen sands. U.S. Army, Corps of Engineers, Cold Regions Research and Engineering Labora- tory, Hanover, NH, Technical Report No. 190.
88 CAN. GEOTECH. J. VOL. 17. 1980 1974. Triaxial constant strain rate tests and triaxial
creep tests on frozen Ottawa sand. U.S. Army, Corps of Engineers, Cold Regions Research and Engineering Labora- tory, Hanover, NH, Technical Report No. 253.
SAYLES, F. H., and EPANCHIN, N. V. 1966. Rate of strain com- pression tests on frozen Ottawa sand and ice. U.S. Army, Corps of Engineers, Cold Regions Research and Engineering Laboratory, Hanover, NH, Technical Note.
TSYTOVICH, N. A. 1975. The mechanics of frozen ground, McGraw-Hill Book Company, New York, NY.
TSYMVICH, N. A., and SUMGIN, M. I. 1959. Principles of mechanics of frozen ground. U.S. Army, Corps of Engineers, Cold Regions Research and Engineering Laboratory, Hanover, NH, Translation 19.
W Y T O V ~ , N. A., et al. 1973. Physics, physical chemistry and mechanics of permafrost and ice. U.S. Army, Corps of Engineers, Cold Regions Research and Engineering Labora- tory, Hanover, NH, Draft Translation 439.
VYALOV. S. S., editor. 1965~. The strength and creep of frozen
soils and calculation for ice-soil retaining structures. U.S.
Army, Corps of Engineers, Cold Regions Research and Engineering Laboratory, Hanover, NH, Translation 76.
19656. Rheological properties and bearing capacity of frozen soils. U.S. Army, Corps of Engineers, Cold Regions Research and Engineering Laboratory, Hanover, NH, Translation 74.
VYALOV, S. S. 1978a. Long-term rupture of permafrost as a thermally activated process. Permafrost, USSR Contribu- tion to the 2nd International Conference, National Academy of Sciences, Washington, DC, pp. 223-228.
19786. Kinetic theory of the deformation of frozen soils. Proceedings, 3rd International Conference on Perma- frost, National Research Council of Canada, Ottawa, Ont., Vol. 1, pp. 750-755.
VYALOV, S. S., and PORKHAEV, G. V. 1976. Handbook for the design of bases and foundations of buildings and other structures on permafrost. Translated by V. Poppe. National Research Council of Canada, Ottawa, Ont., Technical Translation No. 1865.