A CAPACITY PLANNING METHODOLOGY FOR RURAL INDIA: AN APPLICATION TO GRID-CONNECTED PHOTOVOLTAICS
by
Narasimha D. Rao
B.A. Electrical Engineering with Computer Science Dartmouth College, 1991
Submitted to the Department of
Electrical Engineering and Computer Science in Partial Fulfillment of the Requirements for the Degrees of
Master of Science in Technology and Policy and
Master of Science in Electrical Engineering and Computer Science
at the
Massachusetts Institute of Technology January 1996
@ 1996 Narasimha D. Rao
All rights reserved
The author hereby grants to MIT permission to reproduce and to distribute publicly paper and electronic copies of this thesis document in whole or in part.
/11",.
Signatur .of Author ...
January 10, 1996
Certified by ... S ... .... ...
Richard D. Tabors, Ph.D., Assistant Director
• Laboratory for Electromagnetic and Electronic Systems
Thesis Advisor
... . ... .. ... ... ...
chard de
d fufyille,
Ph.D.,
Professor o ivii
and Environmental
Engineering
S.hairman,
Technology and Policy
Program
Accepted by ....F. R. Morgthaler,•h• rofessor of Electrical Engineering and Computer Science Chairman, Departmental Committee on Graduate Studies
OF TECHN-LOnGY
AP R 1 11996
Certified by
A Capacity Planning Methodology for Rural India: An Application To Grid-connected Photovoltaics
by
Narasimha D. Rao
Submitted to the Department of Electrical Engineering and Computer Science on January 10, 1996 in partial fulfillment of the requirements for the Degrees of Master of Science in Technology and Policy and
Master of Science in
Electrical Engineering and Computer Science
ABSTRACT
India projects a staggering demand for power generation capacity in the next few decades to keep up with industrialization and development. A significant portion of this growth will come from predominantly rural areas. Because of poor revenue generation in the agricultural sector, State Electricity Boards (SEBs) lack the economic incentives to build capacity for rural areas. This has led to a progressive degradation of the quality of power in rural areas and of the financial viability of SEBs. At the same time, foreign and private investment in large-scale power plants has been increasing rapidly, without a rigorous framework to study the efficient allocation of resources, the environmental consequences of different investment paths or the appropriate solutions to meet energy needs. No methodology currently exists for capacity planning in the rural context to guide policy making.
This thesis develops a methodology for planning capacity expansion for an agricultural region of India employing distributed photovoltaics (PVs). The choice of technology is motivated by its environmentally benign nature and the benefits of distributed generation. The failures of traditional capacity planning in the Indian context are highlighted. Methodologies are developed to estimate load and quantify distribution losses with limited data. A production cost model based on this new methodology incorporates the high distribution losses, models the uncertainty of solar insolation and calculates the avoided costs of PVs in the state of Haryana. The thesis also discusses the most suitable technical configuration for PVs, the pricing and ownership structure and the potential for PVs to achieve cost-competitiveness.
The results of the analysis show that the solar resource potential coupled with the high cost of power delivery along poor T&D systems render the value of photovoltaics to be high relative to other PV applications. Overall, the most suitable configuration of PVs is shown to be single, privately owned, plants on each distribution feeder. In practice, the value of PVs will be offset by the high cost of their configuration and their sub-optimal performance when integrated into the power distribution system. From a policy perspective, PVs do not, however, eliminate the inefficiencies in the power system. SEBs need to focus on demand-side issues more closely and undertake cost-based tariff reform before considering further capacity expansion. A critical conclusion of this thesis is that the value of PVs will decrease significantly when these distortions in demand are eliminated.
Thesis Supervisor: Richard D. Tabors, Ph.D.
Acknowledgments
This thesis is dedicated to my two nephews, Adrian and Neil
You could drive me into nervous, nostalgic frenzy with the mention of my thesis nemesis: "data". This work would have been impossible and meaningless without the information
provided to by my friends in TERI, New Delhi, and first thanks must go to them. I am grateful to Sharmila Bharatan, B. Rajsekhar, Meena Srikumar, and Dr. Mukherjee for their transcontinental assistance. The seed for this work was provided by Dr. Ajay Mathur during my summer
internship with TERI. Unbeknownst to him, I managed to achieve my goal of writing a thesis on the energy sector of India primarily as a result of my meaningful internship with him.
Back at MIT, the guidance, encouragement and ideas of my advisor, Dr. Tabors, were crucial and indispensable to the quality of this work. Working with Mike Tennis at UCS exposed me to tools and methodologies that were central to the analysis of my thesis. I am grateful to Ed Kern of Ascension Technologies for his genuine interest in this research and the data he provided me with.
This thesis has been the culmination of all that I have learnt at MIT, and I must acknowledge all the friends that contributed to that learning experience. They are all, for the most part, bozos. Nevertheless, I truly appreciate Mort's indefatigable willingness to help. Judy's company in class and her inexhaustible supply of relevant articles made my research that much more meaningful. Mark's superlative black bean soup put me into overdrive on the homestretch of my thesis. Uday was the vital Indian connection who identified with my concerns and ideals, and served as my reality check. Last and certainly not least, my friendship with Shanthi was invaluable to me throughout school.
Table of Contents
LIST O F TABLES... ... 7
LIST OF FIGURES ... ... ... ... ... 8
1. INTRODUCTION ... ... 9
2. BACKGROUND AND OVERVIEW ... 13
2.1 THE INDIAN POW ER SECTOR ... 13
2.. 1 Energy Resources and Demand Growth... ... 15
2.1.2 Irrigation and Electric Power... ... ... .. ... 15
2.1.3 P ow er Sector O verview ... 16
2.1.4 Institutional and Administrative Framework ... 17
2.2 RENEW ABLES IN INDIA ... ... ... .... ... ... 18
2.3 MEGAWATT POTENTIAL FOR GRID-CONNECTED PVS ... ... 20
2.3.1 Location Selection Criteria... ... ..20
2.3.2 Nationwide Scale ofApplication...21
2.3.3 Solar Resource Potential across India ... ... 23
2.4 THE CASE OF SONEPAT, LHARYANA ... 26
2.4.1 D istribution System ... 26
2.5 SUMMARY ... . ... ... .... ... ... ... 28
3. TRADITIONAL LEAST COST PLANNING APPLIED TO RURAL INDIA ... 29
3.1 PLANNING OBJECTIVES...29
3.1.1 Traditional Least Cost Planning ... ... 31
3.1.2 Prices and Capacity Planning ... 32
3.1.3 SRMC & Optimal Economic Dispatch ... 33
3.1.4 LRMC and Optimal Capacity Expansion ... 34
3.1.5 Transmission and Distribution (T&D) Savings...35
3.1.6 Environm ental Benefits... .. ... .... ... ... 36
3.2 THE CASE OF ELECTRIFIED AGRICULTURAL REGIONS OF INDIA ... 38
3.2.1 Transmission and Distribution Losses...38
3.2.2 D ifferent Load Duration Curves ... ... 39
3.7.3 nderva!,rtion of Photovoltics with SRMC Plannig. ... ... ... 39
3.2.4 Value of U nm et Energy... 40
3.3 IMPROVED METHODOLOGY FOR CAPACITY PLANNING IN AGRICULTURAL INDIA ... 41
3.3.1 A ssum ptions... . ... ... . . ... 41
3.3.2 Salient Characteristics... ... 43
4. MODEL DESCRIPTION AND IMPLEMENTATION ... ... 44
4.1 MODEL PARAMETERS ... ... ... 44
4.2 LOAD ADJUSTMENT FOR INTERMITTENT (WITH LOSSES) ... 45
4.3 LOAD ANALYSIS ... ... ... ... ... 47
4.3.1 M ethodology... ... ... 48
4.4 LOAD-RELATED LOSSES ... .. ... 54
4.4.1 Characteristics of Distribution Losses.. ... ... .. ... ... ... 54
4.4.2 Economic Consequences of Distribution Losses ... 55
4.4.3 Losses in Agricultural Regions...56
4.4.4 Methodology of Loss Calculation...58
4.4.5 A nalysis... .. ... ... . ... 62
4.4.6 Results... .... . ... ... ... ... 64
4.4.7 Power Factor Improvement Cost ... 64
4.5 G ENERATION D ATA ... 65
4.5.1 E xisting C apacity M ix ... 65
4.5.2 Cost Assumptions... ... .. ... ... 68
4.5.3 N ew Generation Technologies ... ... . .. ... ... 68
4.6 U NCERTAINTY M ODELLING ... ... ... 70
4.7 COMPUTER M ODEL U SED ... ... . .. ... ... 70
4 .8 R ESU LTS ... ... 7 1 4.8.1 PV Performance ... ... 71
4.8.2 ELCC (Capacity Credit) ... ... 72
4.8.3 Total Quantified Benefits... . . ... ... 74
4.8.4 D iscussion ... ... ... ... 75
5. VIABILITY OF PVS FOR CAPACITY EXPANSION ... ... 80
5.1 VIABILITY OF PV INVESTMENT ... ... ... 81
5.1.1 Economic Implications of Grid-Interaction of PVs...81
5.1.2 Ownership, and Terms of Agreement ... 83
5.1.3 Photovoltaic Price Projections ... ... 85
5.2 PVs -THE RIGHr SOLUTION ? ... ... ... ... ... ... 88
5.2.2 Supply Deficit or Excess Demand? ... 92
6. CO N CLU SIO NS ... ... 95
7. APPENDIXES ... ... 98
1. SOLAR CONVERSION MODEL ... ... 99
2. LOLP CALCULATION WITH INTERMITTENTS ... 103
3. FINANCIAL CALCULATIONS ... 105
4. ILLUSTRATION OF METHODOLOGY IMPLEMENTATION ... ... 106
5. OPTIMAL LOCATION AND SIZING OF PV SYSTEMS... 107
List of Tables
Table 2-1: 11 kV Feeder Descriptions -(Samarbandh sub-division, Sonepat) 27
Table 4-1: Water Requirements for crops other than rice (amm/ha) 49
Table -- 2: Estimation of Irrigation Requirements for Haryana 49
Table 4-3: Sectoral Breakdown of Demand, Ganaur 51
Table 4-4: Sectoral Breakdown of Demand, Haryana 51
Table 4-5: Distribution Transformer Characteristics (Power Factor = .7) 58
Table 4-6: Estimated Load on Individual LT Feeders 62
Table 4-7: Calculation of Distribution Losses 63
Table 4-8: Sensitivity of Distribution Losses to Power Factor and Load Factor 63
Table 4-9: Transmission and Primary Distribution Losses 63
Table 4-10: Total T&D Losses 63
Table 4-11: Reactive Compensation (kVAR) Required per 11 kV Feeder 65
Table 4-12: Haryana's Generating Plants (1991) 66
Table 4-13: Outage Rates of Plants 67
Table 4-14: Plant Characteristics 68
Table 4-15: Fixed Costs of New Plants 69
Table 4-16: Finance Data 69
Table 4-17: Results of Capacity Factor of PVs 71
Table 4-18: ELCC of PVs in Haryana 73
Table 4-19: Breakdown of PV benefits Jbr different Power Factors 74
Table 4-20: Total PV Benefits ($/kW. Yr) for Varying Power Factor and Capital Cost 74
Table 7-1: Mean Global Hourly Radiation (kWh.m 2) -New Delhi 101
Table 7-2: Standard Deviation of Global Hourly Radiation (kWh.m2) -New Delhi 102
Table 7-3: Mean Diffuse Hourly Radiation (kWh.nm2) -New Delhi 102
List of Figures
Figure 2-1: State-wise Consumption of Power from Agriculture/Irrigation 22
Figure 2-2: Distribution of global solar radiation -(Annual kWh.m-2.year- 1) 24
Figure 2-3: Isopleths of hourly totals of global solar radiation - 25
Figure 2-4: Grid Layout -Sonepat, Haryana 26
Figure 3-1: Illustration of Supply Constrained Capacity Planning 40
Figure 4-1: Illustration of Load Adjustment for Intermittent with Losses 46
Figure 4-2: Normalized Variations In Irrigation Requirements And Solar Radiation 50
Figure 4-3: Normalized Daily Load Variations 51
Figure 4-4: Cumulative Daily Load Curve -Sonepat, Haryana 51
Figure 4-5: Annual Load Characteristics -Haryana 1996-7 53
Figure 4-6: LDC, Agricultural Regions in Haryana (based on Sonepat) 1996-7 53
Figure 4-7: LDC, Haryana + Agricultural Growth 1996-7 53
Figure 4-8: Assumed Configuration of LTfeeder -(Equally Spaced Uniform Loads) 61
Figure 4-9: Resulting Simplification of LTfeeder 62
Figure 4-10: Sample Distribution of PV Performance 71
Figure 4-11: Dependence of PV value on Power Factor, Losses 74
1. Introduction
The growth of energy demand in developing countries is escalating. If current trends in population growth and energy use continue, population will double, and the energy demanded per person will treble by the year 2050. Several protectionist developing economies have finally succumbed and opened their doors to foreign investment, with an apparent emphasis on growth at any cost. With current energy production patterns, the environmental impacts on the earth fifty years from now can prove devastating. India and China, who together constitute 40% of the world's population, meet demand growth with coal contributing 60% and 76% to energy production respectively. This percentage can rise in the future, given the relative abundance of coal and the uncertainty in future oil prices.
The worrisome characteristic of these trends is their rapidity. Growing concern for the environment calls for a serious evaluation of the sustainability of the technologies of energy production and a stronger emphasis on the commercialization of non-polluting energy sources, such as solar and wind energy. Historically, research in renewable energy in developing countries has focused on non-electric use of energy for rural applications or stand-alone electric systems. Although a small number of grid-connected installations have been demonstrated, the rate of penetration of commercialized, reliable applications has been minimal. Price, and complexity of use and deployment, have impeded the large-scale application of renewables. For the case of photovoltaics, arguably price is the only real hurdle. Given the inevitable acceleration of energy demand in the future, there is a chance now to capitalize on the potential economies of scale that can result if manufacturing processes of renewable technologies can be given an impetus. However, to induce this growth, a justifiable case for the potential cost-effectiveness and viability of these solutions has to be made. This has to be supported by sound, comprehensive technical and policy analyses of these solutions that take into account the choice of technologies best suited to local conditions, technical feasibility and practicality issues, the appropriate siting and sizing of installations, and the consistency of these solutions with international and domestic ro!icv d'rectives.
A rigorous economic and policy analysis of capacity planning with a significant penetration of intermittent generation has never been done for India. Because of the unique characteristics of the Indian power sector, traditional approaches to capacity planning fail to provide an appropriate framework for analysis for capacity expansion. This thesis will explore these failures, and develop and simulate a new methodology for capacity planning in agricultural regions of India with a significant penetration of intermittent generation. The main contribution of this methodology is to incorporate the high level of losses in production cost planning, as well as to model the uncertainty in intermittent generation. An important outcome of this approach is to quantify what is only qualitatively known among informed circles to be the unusually high distribution losses in some agricultural regions. Most government publications quote conservative estimates of distribution losses. Analyses of rural areas lack reliable, detailed data on load patterns and power quality. In light of this limitation, methodologies are developed to estimate agricultural load patterns and distribution losses with the use of limited data.
This thesis focuses on grid-connected photovoltaics as a choice of intermittent generation technology. It investigates the claim that grid-connected photovoltaics offer a clean alternative for capacity expansion to meet growing, rural energy demand (dominated by irrigation) in electrified regions of India. Intuitivel), the use of solar energy for electricity in these regions seems attractive because of the coincidence of the high daytime energy demand for irrigation with periods of high solar intensity. This is compounded by the high technical line losses on the lengthy, low-quality distribution networks in rural regions, which render the cost of providing electricity from centralized locations very high. Furthermore, rural regions that lie close to urban centers fall victim to constant load shedding, and as a result they usually suffer significant power deficits and operate at a high load factor. Generation from newly capacity at centralized locations tend to be absorbed by the high-growth urban centers, thereby offering little benefit to meet rural energy needs.
Based on the methodologies developed, a simulation of the power sector in Haryana calculates the effective avoided costs of PVs in rural Haryana. The analysis focuses on the district of Sonepat in Northern Haryana on the outskirts of the Indian capital, New Delhi. This region exhibits all the features described above, and characterizes many agricultural regions in India. It has been chosen for the purpose of providing a concret, ýrame,,.'rk for .tnaiy;iis, thereby allowing a more accurate calculation of distribution losses than done before.
In addition to developing and using an appropriate methodology for calculating the value of PVs, several policy and institutional issues that determine the feasibility and suitability of deploying PVs in rural India are explored. This policy analysis proceeds along two separate paths. The first examines the factors that will attract PV investors to India. This includes an analysis of the potential for the world PV market to attain a price that would render them competitive in India, along with the institutional and tariff structure that state governments in India should provide to investors. The other perspective looks at the prudence of deploying PVs to reduce the supply deficit in the rural power sector. It suggests that tariff reforms are necessary to control demand before capacity expansion for rural areas should even be considered.
Chapter two introduces the political and economic climate in India today. The structure of the energy sector, the government's position on non-conventional energy and the recent efforts to induce foreign participation in energy expansion will be discussed in order to lay the foundation for the analysis. The region of Sonepat, Haryana will be introduced and described. The chapter will also explore the extent to which grid-connected photovoltaics in the context presented here can have an impact on energy demand on a nation-wide basis.
Chapter three briefly describes traditional capacity planning methods and the conventional treatment of intermittent generation. The assumptions that underlie a least cost planning approach are explicated. The unique characteristics of the rural power sector and the agricultural consumer in India are then introduced in detail and analyzed within the context of traditional capacity planning. The failures of such an approach are highlighted, along with justifications for the development of a new methodology. Specifically, the impact of a severely supply-constrained sector along with the difficulty of planning without a long run marginal cost approach are analyzed. Several benefits of intermittent generation that often do not enter decision making processes, such as T&D and environmental benefits, are discussed and applied to the Indian context.
Chapter four develops and applies a new methodology for analyzing the economic benefits of intermittent generation bascd on Lhe arguments develocpzd iil the previous chapter. The rliost important contributions in this methodology are the incorporation of T&D losses in the
production cost simulation and the modeling of uncertainty in solar insolation. Methodologies for estimating agricultural load patterns in the absence of load data and for calculating technical losses in distribution systems are also developed. All the pieces of the methodology are then put together and applied to the case of Haryana in a production cost model that simulates a least-cost capacity expansion plan. The Monte Carlo method is used to model uncertainty in solar insolation. Numerical results are obtained for the break even cost of grid-connected photovoltaics in rural Haryana. The sensitivity of avoided costs to the power factor in the distribution system is analyzed, since it contributes significantly to distribution losses.
Chapter five studies the policy issues surrounding the promotion, pricing and suitability of grid-connected PVs. The results of the economic analysis are placed in a realistic context, from the perspective of a PV investor and that of a policy maker in India. Price projections of the PV market, and possible ownership and management structure for PV systems are suggested. The viability of the assumptions necessary for capacity expansion with PVs are challenged. These assumptions include the presence of incentives for capacity expansion in rural areas, and certain operational requirements arising from the optimal configuration of PV systems. The flip side to the supply deficit problem of demand management is explored, and suggested as a more appropriate target for a solution.
The appendices contain the engineering analyses undertaken for various components of the analysis. They include: an application of optimization techniques to identify the optimal locations and sizes of PV installations on a distribution system that would minimize losses; a detailed description of the solar insolation conversion model; an analytic solution to calculating the load carrying capacity of an intermittent source of power; a diagrammatic representation of the software developed to perform the production cost simulation; a description of the financial calculations embedded in the production cost model.
2. Background and Overview
2.1 The Indian Power Sector
India is the largest democracy in the world. In another thirty years it is also likely to be the most populous country with 1.4 billion people. India dominates the Indian subcontinent in area, spanning from 80 4' to 370 6' latitude above the equator with a land area of 3.28 million sq. km.
It is a resource-rich country, with every possible geographic terrain falling within its boundaries. Lined by mountains in the North and along its eastern and western coasts, much of the land surface within India has a plateau-like character, with extensive plains. The Indo-Gangetic belt in Central India and the Deccan Plateau in the South contain mineral-rich soil, bathed by an abundance of rivers from the Himalayas and Central Highlands respectively. It is therefore no surprise that over sixty-five percent of employed Indians still engage in agriculture, and over eighty percent of Indians live in rural regions.
India is a developing economy, with starkly dichotomous economic characteristics. India achieved impressive results in agricultural production in the 70s, and claims to have achieved self-sufficiency in food production. It also has made tremendous progress in industrial and high-tech development. India today is the 20th largest economy in the world, measured in gross domestic product. However, these statistics belie the character of what constitutes the bulk of India; over 500,000 villages with a rural population plagued by malnutrition, low literacy and life expectancy, poor agricultural productivity that is still very dependent on the monsoons, and an overall per capita income of barely $300.
Since gaining independence from Britain in 1947, India has consistently followed a socialist path of industrialization, with the state owning and taking responsibility for the major infrastructural industries of power, communications, roads, critical resources (coal, steel, petroleum products and crude oil), and transportation. Its economic policies over the past four decades strongly echo the pr!ilciples of self-rcliance and protectionism. Today, the very infrastructural industries that the state deemed essential for the country and sought to protect by taking public ownership of are
poorly managed, and have been unable to provide quality goods and services to all but the metropolitan centers of the country.
The pattern of growth in the past two decades project a change in the demographics of the future. Urbanization and industrialization have accelerated significantly, and culminated in the privatization and liberalization reforms of 1991. As in most privatization schemes in developing countries, growing disappointment with the financial performance of public enterprise, low productivity, and the sheer inability of the state to cope with growth motivated this reform process. The government essentially opened up the Indian market to foreign investment and ownership, thereby eliminating the only remaining hurdle to rapid economic growth. The first industries to participate in these schemes were in fact infrastructural industries, specifically power and telecommunications. The economic and policy initiatives reflect a greater emphasis placed on urban, rather than rural development.
The political climate in India today is particularly sensitive to foreign participation in private enterprise because of the ideological differences between competing political parties viz. a viz. nationalist sentiments. Foreign investors tend to be wary of newly emerging markets with unstable political climates, or with policies averse to foreign investment. The early 90s saw a secular, progressive party that dominated Indian politics almost entirely since independence institute long overdue reforms to encourage foreign participation. This political atmosphere, coupled with attractive economic incentives, attracted over $7 billion dollars in Foreign Direct Investments (FDI) over a span of four years. However, the Congress party has gradually relinquished its stronghold over the populace, and instability once again threatens to plague India's political future. The Congress party has suffered several defeats in state elections to a nationalist party, the Bharatiya Janata Party (BJP). In the state of Maharashtra, an affiliate party of the BJP has placed a major foreign power project involving the American power company Enron on hold. The outcome of this project can result in a drastic domino effect, since it is the first foreign collaboration in the power sector to have progressed from the proposal phase to the phase of implementation.
2.1.1 Energy Resources and Demand Growth
The structure of energy consumption mirrors closely the demographics of an economy, and its growth serves as a good indicator of future economic trends. The rural nature of India's population is reflected in its per capita commercial energy consumption, which is only one eighth of the world average, despite the fact that it is among the top 20 consumers of commercial energy. One third to a half of India's energy needs are provided by traditional biomass fuels. Solid fuels contributed 67.7%, while electricity accounted for a meager 3.8% of energy sources in 1988. Of this, industry consumed over 50% of electricity generated, while agriculture consumed only 9%1.
The growth in commercial energy, and especially electricity, indicate the rapid industrialization and commercialization taking place. Electricity demand has been growing annually at about 9%, while industrial output rose at an annual rate of 6.3% in 1993-94. Of this, industry absorbed 38% of electricity demand, while the relative share of agriculture increased to 28%2. Since liberalization in the early 90s, the rate of electricity demand growth in the industrial and commercial sectors have exceeded that of agriculture. This thesis is concerned with the small portion of overall energy demand growth that constitutes agricultural demand for electricity.
2.1.2 Irrigation and Electric Power
One of the reasons for the increase in power consumption in the agricultural sector is the increased mechanization of irrigation, which constitutes one of the major agricultural activities in India. India receives too much rainfall in certain places, and too little in others, such that irrigation plays in important role in agricultural productivity. Rain also falls only during the monsoon season, which lasts only a few months. As of 1992-93, India has met only 71.5% of its total irrigation potential. In the state of Haryana alone, an untapped potential of a million hectares of irrigation still exists3
From the several manual and mechanical methods of irrigation used, electric pumps are the most popular and from the perspective of farmers both financially and economically preferable where
1World Resources, 1994-95
2
Eighth Power Plan Program 92-93 to 96-97, Dept. of Power, Government of India, 1991
3
power is available4. This judgment is distorted by the subsidies afforded to electric power in rural areas, both for the purchase of equipment and electricity. Methods involving manual or animal labor do still exist, but are losing popularity. Renewable methods using non-electric energy, such as wind-powered deep-well pumps, require local expertise to maintain and set up, and do not give farmers flexibility in operating the pumps at their will. Diesel generators are a popular source of electrical energy, because of their independence from grid availability and portability. Government policies usually affect the choice between grid power and diesel fuel by subsidizing one type of power versus another, or by imposing taxes on the use of diesel fuel. The quality of power also indirectly depends on government policy, since investments in transmission and distribution can most often improve power availability in rural areas.
The poor quality of grid power adversely affects productivity in areas that depend on electricity for irrigation. Power availability often does not coincide with times of need, and constant disruptions and low voltages often prevent operation even during hours of availability. Given this conflict between irrigation needs and power availability, electricity generated specifically catering to local needs from renewable sources would benefit both the needs of farmers and improve the quality of power available to them.
2.1.3 Power Sector Overview
Despite being barely 4% of total energy output, electricity generation in 1993-94 amounted to 323.3 million kWh from an installed capacity of 76,718 MW. Roughly 60% of this comes from coal, with an additional 26.5% from hydro power. Domestic coal production has been steadily increasing, along with an increase in coal's share of electricity generation. With total electricity demand growing at 9% a year, an increase in capacity of 19,108 MW is envisaged in the Eighth Five-year Plan, ending in 1996-975. In this period, supply is expected to fall short of peak demand by around 20%, with a Plant Load Factor (PLF) of 61%.
In order to bridge this enormous gap in supply and demand, Indian financial institutions would have to provide capital for capacity expansion at a rate far greater than they possibly could. Further, mobilization of capital commensurate with growing demand would also be very
4
Kahnert F. et al., "Groundwater Irrigation and the Rural Poor: Options for Development in the Gangetic Basin", Pg 24
difficult. Hence, attractive incentives have been offered to private and foreign investors for power projects in the liberalization efforts of the early 90s. Of the 19,108 MW expected increase in capacity in the Eighth Five-year Plan, 5000 MW is expected to come from private companies.
One of the premises of this thesis lies in the implicit neglect of power development of rural regions in government policy. Much like other infrastructural industries, the condition of the power sector in rural regions remains considerably behind urban centers. Although, about 84% of Indian villages have been electrified, the quality of power is poor, villages fall victim to load shedding, losses are significantly higher due to spread out, low voltage distribution networks and operational and administrative inefficiencies prevent revenue recovery and cost management in these areas. Most of these problems occur in the secondary distribution system. Because of poor monitoring facilities at this level, statistical information on load, power quality and energy use have by and large been estimated, usually conservatively, in official publications. Information access at this level is not easy, making accurate analysis difficult.
Nationally, T & D losses average to around 22%, ranging from 15% in urban areas to over 43% in Kashmir6. Losses in the secondary distribution network dominate this percentage. In rural areas, power monitoring facilities are limited, and therefore government publications quoting T&D losses often incorporate conservative estimates of distribution losses.
2.1.4 Institutional and Administrative Framework
The responsibility for electricity under the Indian constitution is shared between the center and the states. The Central Electricity Authority (CEA) is the chief regulatory body that oversees power planning at a national level and is responsible for developing policy in relation to the control and utilization of national power resources. It also conducts and approves technical and economic appraisals of power projects and stipulates guidelines for them.
The National Thermal Power Corporation (NTPC) is the only centralized body partially responsible for generation. Most of the generation and all distribution falls under the
6
Eighth Power Plan Program 92-93 to 96-97, Dept. of Power, Government of India, 1991 Anne....re 25
responsibility of the State Electricity Boards (SEBs). A small fraction of generation also comes from private and state-owned generating companies. Finally, some private licensees also operate in the area of distribution and generation.
The SEBs set tariffs based on a three percent return on their net fixed assets over and above the recovery of investment in T & D and generation. Most of the SEBs have consistently failed to achieve this rate of return, and this has hampered their ability to invest in new power projects.7 The financial performance of SEBs is particularly poor in states with a large agricultural base. This is because state governments subsidize agriculture considerably. Furthermore, energy consumption is not metered at the secondary distribution level in several areas, and farmers are charged a flat monthly fee per kW rating of their appliances. Theft, low power quality and technical losses compound the problem of revenue generation.
2.2 Renewables in India
The nature and scale of application of renewable energy technologies in developing countries differ significantly from industrialized nations. In industrialized nations, they have been used primarily as commercialized, grid-connected applications, where the cost of conversion technologies have reduced enough to permit limited penetration of them into the grid. In India, however, renewables have been promoted because of their immense potential for deployment on a small-scale in rural areas primarily for non-electric forms of energy, and, to a lesser extent, for electricity in remote regions where connection to the grid would be too expensive.
Until the late 80s and the 90s, the development of renewable technologies in India depended exclusively on government funding, and therefore on governmelnt policy. The Indian government has historically provided more support for renewables than most other developing countries in proportion comparable to several developed countries. The establishment of a Ministry for
Non-7
TERI, "Policy to encourage private investment in the Indian power sector - a perspective", TERI Information Digest on Energy, Pg. 97
conventional Energy Sources (MNES) is indicative of the national priority given to renewables. From 1980-81 to 1988-89, investment in renewables increased by a factor of 308. Up to half of this investment went towards a biogas program, with solar photovoltaic and thermal, wind and the cooking stove program receiving comparable amounts. Barring grid-connected wind turbines and solar cookers, most technologies have not matured enough to reach the commercialization stage, and therefore depend heavily on government subsidies.
Until a few years ago, India has had practically no experience with grid-connected PVs. The state of Uttar Pradesh undertook two 100 kW demonstration plants of grid-interactive PV, of which only 25 kW have been actually connected to the grid as of 1994. Investment in PVs have been in stand-alone street lighting, solar lanterns, communication systems and some applications of PV pumps. PVs have always been prohibitively expensive, and it is oiily for very remote regions and very small-scale applications that they have proved cost-effective. India does have an indigenous solar cell market of 2 MW per annum, which manufactures solar cells at a cost almost three times that of present day cell technology in the US. 9
With the introduction of economic incentives for private and foreign investment, a completely new face to the deployment of renewables has emerged. Government support has shifted from subsidies and direct funding to fiscal incentives. Specific emphasis has been given to wind energy, because of its demonstrated cost-effectiveness world-wide. Some of the incentives include soft loans from IREDA10, tax exemptions for five years, and 100% accelerated
depreciation. The government planned for 500 MW of private investment in wind in the Eighth Five-year plan, but expect to easily exceed that target by 1995-96, based on proposals received by the government so far.1 1 Of the 115 MW installed in 1993-94, over 85% have involved collaborations with foreign wind turbine manufacturers. Clearly, opening up the market to foreign participation has facilitated the growth of a megawatt market for grid-connected renewables like never before. Competition has also brought with it more stringent standards of cost-effectiveness for technologies to compete in this market. Grid-connected PVs will therefore
8 Sinha C.S, "Renewable energy programs in India",Pg. 305 9
Rs. 300 per watt (US$=Rs 31), estimates from Renewable Energy Technology Area. Tata Energy Research Institute, New Deihi
101nd:ain Renewable Energy Development Agency. the financial arm of MNES 11Times of India, Bombay, 12 May 1995, Pg. 10
have to seek cost-effective solutions that can attract private investors. For India, this essentially means foreign manufacturers, given the fact that cell manufacturing technology abroad is far more mature and, as mentioned before, one third the cost of indigenous cell production.
2.3 Megawatt Potential for Grid-connected PVs
The purpose of this section is to assess the scope for grid-connected PVs on a nationwide basis. That is, are the characteristics exhibited by Sonepat so unique that on a macro scale they offer only a limited application of grid-connected PVs? Can one qualitatively ascribe a megawatt amount to the scale of their application?
2.3.1 Location Selection Criteria
This thesis focuses on rural demand growth that occurs on, or reasonably close to, the grid in electrified regions such that they require minimal line extensions. This qualification is necessary to distinguish this study from those that compare the cost of installing stand alone PV systems to power a village or region against the cost of extending distribution feeders to these unelectrified areas.
Certain geographic and demographic characteristics of regions can be identified that would potentially make grid-connected PVs attractive. The degree to these characteristics exist will qualitatively influence the attractiveness of PVs, rather than strictly preclude or justify the application of PVs. Such an enumeration provides a useful methodology to intuitively select areas for further analysis into the selection of suitable locations for applicationl 2. Clearly these
criteria can be divided into those that contribute to high costs of conventional electricity on the grid, and those that permit the most cost-effective deployment of solar-powered, intermittent PV systems.
The following list of characteristics of a load center typify regions with high costs of delivery of conventional, centralized power .
* Predominantly agricultural regions, which tend to have:
12The political and social ramifications that affect the choice of solution are discussed in Chapter 5 - this only provides an economic and geographic cotext for analysis
-high inductive loads that lower power factor, and therefore increase losses. Most common examples include irrigation pumps and tubewells;
-lengthy, low voltage distribution networks that also proportionately increase losses;
-erratic, spiky load curves that harm the efficiency and lifetime of distribution transformers. This increases the cost of maintaining and upgrading
transformers.
* Regions located close to urban centers, and therefore fall victim to load shedding and have limited and unreliable power. In such regions, increased capacity tends to be absorbed by the urban centers.
* Regions with significant demand deficits or increasing peak demand. Supply can be met on an incremental basis, on a commensurate scale with demand, taking advantage of the modularity of PV systems and the linear nature of their installation costs.
The following characteristics lend themselves to the most effective deployment of PV power systems.
* Regions with high solar insolation year round, which do not have the same energy
potential from wind or small-hydro sources.13 The year-round insolation will determine the largest capacity that can be installed while ensuring maximum utilization of the system.
* Regions whose peak demands coincide with periods of high solar insolation (which often tends to occur in irrigated agricultural areas). This also contributes to maximizing system utilization, thereby reducing kWh costs of operation. This, and the preceding criterion, are important because grid-connected PVs exclude any storage devices14, and therefore depends on maximum utilization of the PV system.
2.3.2 Nationwide Scale of Application
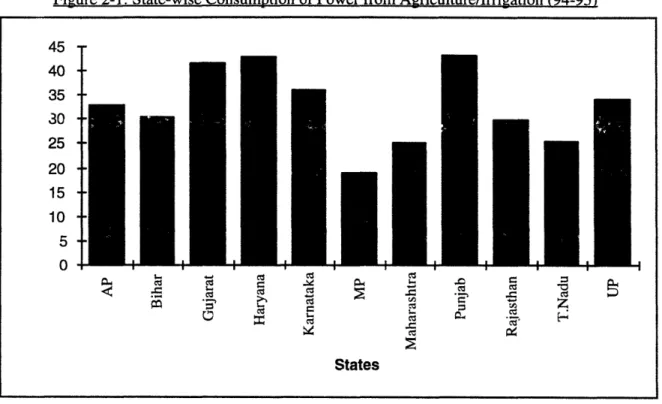
Figure 2-1 below illustrates the projected proportion of electricity generation sold for agriculture and irrigation in 1994-95 for select states, which together generate over 85% of the country's
13TIhs thi:sis avoids comparisons with ozher gnrC-connecte renew,blH, sv;tems, such as wind, assuming that they would be a natural choice when equal potentials exist for their deployment. Thus, regions with solar resource potential at least as high as wind are targeted.
power and house over 75% of the country's population. Agriculture consumes more than 20% of total electricity generated in all states, and over 30% in more than half the states15 . The
government projects a deficit of 52,853 MkWh at the end of the Eighth Five-year plan ending in 1996-.`7, after accounting for current investment plans. Using the percentages from Figure 1 and projected deficits in the respective states, this amounts to a deficit of 15,938 MkWh for agriculture alone in these states.16
Figure 2-1: State-wise Consumption of Power from Agriculture/Irrigation (94-95)
Roughly, this corresponds to a capacity upwards of 1,226 MW of grid-connected PV for agriculture in just the next two years17 - this does not even include any displacement of planned thermal generation.
T & D losses, which this thesis will show are underestimated in government publications, are consistently above 18% for all these states1 8. Statistics on the quality of the distribution systems
of individual states was unavailable, but in all likelihood distribution systems in other states are
1 5
It is noteworthy that this percentage has gone down since 1992-93, but is expected to decrease only marginally
over *'e next few years.
16 Source of projected deficits: See Footnote 6, Annexure 35
1 7Assuming 1300 kWh.m- 2
of generation, and 100 w.m- 2
of capacity 18 See Footnote 6, Annexure 25
40 35 30 25 20
15
10 5-0 0 + + .4 4 4 -I. -I. 4 -I Cd e C _C I -- Y -3 C-,.-States
.4- -4- 4. -I4
4- -4-1
-a 6 c:·Id
t
~j ~unlikely to have significantly better power quality in comparison to Haryana, since they have comparable T & D losses. Therefore, by quantifying more accurately the losses in a rural region of Haryana, it would not be illogical to qualitatively extrapolate from the results the existence of a simrlar discrepancy in losses in rural distribution systems of other states.
2.3.3 Solar Resource Potential across India
Radiation emitted by the sun arrives at the earth in two forms; direct and diffused radiation. Direct solar radiation refers to the quantity of solar radiation falling on a unit area of the earth surface normal to it. Direct radiation depends mainly on latitude, altitude and the season, which determines the distance of the earth from the sun and the amount of sunshine received. Diffused radiation refers to that portion of radiation that arrives at the earth's surface after scattering in the atmosphere, and reflecting diffusely off clouds. Since India lies close to the equator, it has a high level of direct radiation with relatively small seasonal variations. Diffused radiation, however, has a much larger gradient due to the effect of drastically different levels of cloudiness caused by monsoons. Diffused radiation attains its maximum during the monsoons, with a low during winter, while direct radiation is highest in the cloudless months of January and April, with a low in the monsoon months of June and July. Variations on a daily basis occur primarily from the passage of clouds over the sun. The difference in radiation resulting fromn cloud passage is the difference between the level of total and diffused radiation. Therefore, one can use this property to approximate the variation in solar irradiance to random step changes in irradiance, from the diffused irradiance to the total irradiance. 19
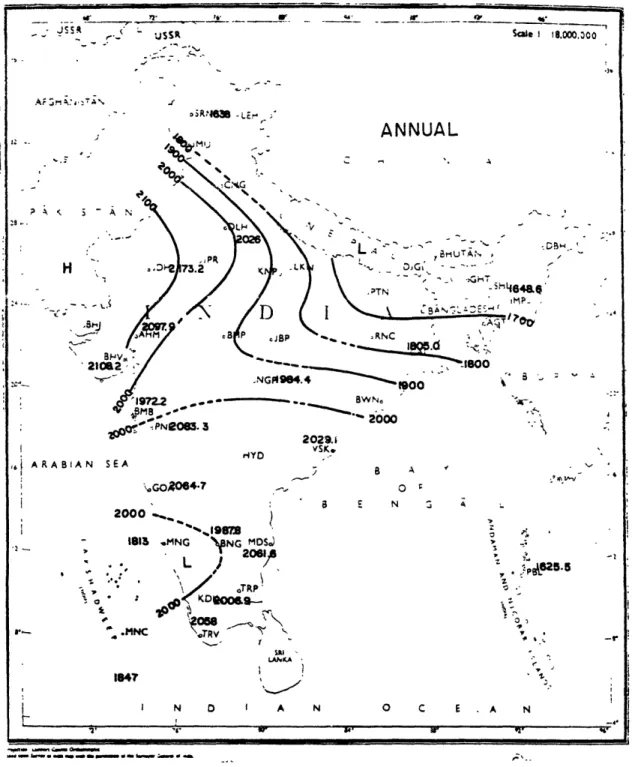
In all the states chosen above, global (diffused+direct) annual radiation averages over 1800 kWh.m- 2 per year, with the annual radiation in Haryana at 2020 kWh.m- 2 per year. (See Figure
2-2). Global radiation varies from 119 kWh.m-2 in December to a high of 225.9 in May in the
region of Delhi. In June, Delhi receives 196.3 kWh.m-2 of global radiation. The diffused
component of this ranges from 34.6 kWh.m- 2 (29%) to 90 kWh.m- 2 (40%) in May, and 106.2
kWh.m-2 (54%) in June. Clearly, even the monsoon months are favorable for the use of PVs,
since total irradiance are close the annual highest, and the lowest level in daily variations are the highest in the year.
19
Figure 2-2: Distribution of global solar radiation
-
(Annual kWh.m:.
2.vear--•
Sr'V 'r* w -JSS~
JS SRi36B LE -sae l 18.000.000ANNUAL
- im L-/;oI
'Ai'- 00T PRNC B2V1 21012 1972.2 -w B- M8 ---. oo ."PNOO5. 0 3 2000vp2029i
ARABIAN SEA VSK. HYD .2GO,064-7 2000 181l 4'. 4* .MN sIa LANKA 1847 N 0 I A N a E N a Z 8 625. S o o C E .A N H -1800 1900 A. . .lA=-
I
-- --- -- ·- ---- - ---- __ i P k 14-v. ,, 49,lor · CI~ I--ucrrr·lrrr·IILlr~·r·rkr~
The other states, which cover central, western, and most of South India, in comparison have
average annual irradiance levels that are about the same as in Delhi, if not higher. In the western
regions of Gujarat and northern Maharashtra, levels are consistently higher. In central India,
levels N
ary both ways to a small degree. Further south, patterns are reversed, with total radiation
being higher in winter (140-155 kWh.m
-2) and lower in the summer months of May and June
(158-200 kWh.m'
2). One can therefore safely claim that regional variations in solar radiation will
not impact the extrapolation of the results of this study to most of India.
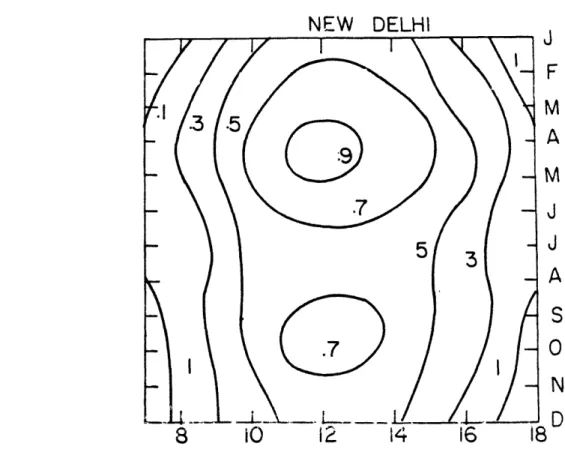
Daily ariations in radiation do not differ significantly geographically. Figure 2-3 shows that
between 11 a.m. and 2 p.m. levels of global radiation are highest all year round in New Delhi.
The number of hours of sunshine Delhi receives averages to 8.2 hours per day, which is also
fairly typical of India. 20
Figure 2-3: Isopleths of hourly totals of global solar radiation
-New Delhi (kWh.m"month-t)
NEW DELHI
8
10
12
14
16
18
2 0Handbook of Solar Radiation Data for India. Pg. 23
2.4 The Case of Sonepat, Haryana
Sonepat, Haryana is a fairly typical, inland agricultural village in the Northern state of Haryana about 40 miles west of New Delhi. Sonepat exhibits all the characteristics described in Section 2.2. Growth patterns in Haryana are also fairly typical - although it is a predominantly agricultural state, the electricity demand growth in the industrial and the commercial sector have been increasing in proportion, while agriculture's share has gradually decreased to around 42%. Paddy and wheat constitute the primary crops grown in Haryana. Over 63% of agricultural demand comes from irrigation tubewells, while the rest includes domestic (household) connections and commercial demand in nearby towns.
Power quality is very low in Sonepat. The power factor was quoted by the Chief Engineer of the sub-division as being as low as .65-.7. In addition to limited availability of power, described in the next section, erratic power failures are common, most likely due to load-shedding during periods of peak load in the neighboring town of Panipat.
2.4.1 Distribution System
Figure 4 describes the primary distribution system (11 kV) that feeds Sonepat. The focus of this study has been narrowed further to the Samarbandh sub-division of Sonepat, shown in the dotted area, because of limited data availability for the second sub-division.
The details of the primary distribution system have been displayed above to illustrate power availability in Sonepat. Only one feeder, which provides power along a major highway, receives continuous power. The other four feeders alternate in pairs for a period of eight hours, staggered over the course of the day. The first observation relevant here is that of the times of day the feeders are active. The fact the period of availability spans the hours of daylight, from 7 a.m. to 7 p.m. clearly reflect the nature of demand serviced by these feeders - irrigation tubewells. The overlap occurs from 11 a.m. to 3 p.m., which indicates most likely the period of maximum demand. This corresponds directly with periods of maximum solar insolation, as described in the pr'-vio's section (1.2c). Further details of load ýnrd the recondary diitribatiop system, obtaired for
the study will be discussed in more detail in Chapter 2 along with demand analysis and the calculation of losses.
Fipure 2-4: Grid L.avout - Sonenat- Harvana
132/11 kV Substation 132/33 kV Substation 33/11 kV Substation
11 kV Primary Distribution Feeders with 440 V Secondary Distribution Feeders
NOTE: This is not a geographic map None of the feeders shown represent actual distances or coordinates
The lengths and names of the six 11 kV feeders shown in the above figure are given in Table 2-1.
Table 2-1: 11 kV Feeder Descriptions -(Samarbandh sub-division, Sonepat)
11 kV Feeder Length Availability
Ganaur 20 km 7 a.m.-3 p.m. G.T. Road 55 km 24 hr. Gumar 37 km 7 a.m.-3 p.m. Rajlugdi 24 km 11 a.m.-7 p.m. Chulkana 21 km 11 a.m.-7 p.m.
SONEPAT
DISTRICT
132 kV fromSEWAH
Area of Study I KAILANAO0
--r-2.5 Summary
The purpose of this chapter was to provide a very brief background of the economic, institutional and political environment of energy planning in India, and to introduce the rationale and potential scale of application of this thesis. Only the features of the energy sector in India pertinent to this thesis have been discussed. Their importance will attain relevance as they are referenced and discussed through the course of the analysis.
So far, the poor institutional and technical state of the power sector in rural regions has been underscored. Given the lack of adequate reliable information at the distribution level in rural regions, appropriate energy planning for these areas becomes even more difficult. The current trend of power development resulting directly from the liberalization strategy of the 90s targets urban areas with investments in large, centralized capacity additions. Such investments are inappropriate for rural development, both from an economic and technical standpoint.
This thesis targets semi-rural, electrified regions that have growing agricultural demand. Section 2.2 has qualitatively illustrated the enormous scope of grid-connected PVs. Even if current policy trends favoring large, fossil-based investments continue, the shortfall in supply expected leaves room for a market of over 3 GW every few years for agricultural demand only. The region of Sonepat represents a reasonable microcosm of agricultural regions of India. Levels of solar insolation exceed world averages in most regions of the country that have significant agricultural demand. Power availability in Sonepat corroborates the intuitive conjecture that periods of high demand coincide with periods of high solar insolation in irrigated areas. The true difficulty in planning for demand growth in these regions, given the difficulties associated with data acquisition, lies in the details, specific to each region; accurately estimating demand patterns and growth, correctly calculating the cost of providing energy from alternative sources to these areas, and choosing the best option. The following chapters begin to undertake this analysis.
3. Traditional Least Cost Planning Applied to Rural
India
This chapter focuses on analyzing traditional capacity planning methods and their applicability to plarnning in agricultural regions of India. A new methodology is introduced to evaluate the worth of photovoltaics in this context. The advantageous conditions that favor the deployment of PVs and the unique, economically burdensome characteristics of agricultural areas on utilities have been qualitatively described in previous chapters. This chapter along with the next seek to identify and quantify, to the most accurate extent possible, the benefits of photovoltaics in agricultural regions. This chapter justifies the elements of the new methodology that are developed in the next chapter. Traditional methodologies for project evaluation, capacity expansion planning and the specific economic theory behind the evaluation of intermittent generation are presented first. In light of the differing characteristics of the operation of power systems in India and the uniqueness of the agricultural consumer, the departures from conventional interpretation of economic value that must be made in this analysis are explicated.
3.1 Planning Objectives
As in the evaluation of any kind of project, the objectives define the various parameters that must enter the analysis and finally the decision-making process. The objectives depend on who the project belongs to, and the scope of its implementation. A regulatory agency and an independent private power company would have very different perspectives on an evaluation of the economic prudence of building a photovoltaic powered generation plant or a coal plant. The latter would take into account parameters that the former would not necessarily be interested in, such as environmental issues. Generally speaking, however, one can assert that the objective of any decision-maker evaluating the worth of a power plant is to maximize the net benefits, and simultaneously minimize the associated costs over the lifetime of the plant.
The parameters that enter the benefits and costs differ for different decision makers. For instance, a policy maker might be interested in incorporating the benefits to the consumer of grid electricity vs. diesel generators in order to assess investment in power plants, while a utility would be concerned primarily with the revenues that can be generated. Below is a broad framework for encapsulating benefits and costs under different goals with respect to the provision of electricity, adopted from the notation of Munasinghe (1987).
t t
NB=
X(TB
- SC - OC)/(l+r)t (3.1)1
TB = The total (quantifiable) benefits from the project, which in the case of a utility could just be the sales of electricity, which would be a function of demand and price. For a government agency, this might include the improvements in productivity and national income from the additional electricity usage.
OC = The costs incurred by consumers from outages and poor power quality.
SC = The supply costs of the plant, which could be further broken down into generation, transmission and distribution, respectively:
SC = GSC + TSC + DSC (3.2)
In addition, certain unquantifiable benefits an costs associated with either option also enter the planning process. In the case of photovoltaics, benefits include the attractiveness of zero emissions and reduced dependence on fossil fuel. An associated cost that would be difficult to quantify is the large amounts of land area required by solar panels.
For a homogenous product such as electricity, the reliability and price are the only characteristics affecting consumer preferences. All three components of Equation 3.1 depend on reliability. The demand for electricity, which is embedded in TB, also depends on reliability and price. It is important to understand that reliability subsumes capacity provision, since a sapply constrained power system manifests in poor power quality. When demand and reliability are considered
exogenous variables, optimization of Equation 3.1 reduces to the traditional least cost capacity expansion criterion used by utilities of minimizing costs subject to reliability and demand obligations, which is the perspective of the rest of this chapter21.
3.1.1 Traditional Least Cost Planning
Until recently, utilities have been vertically integrated industries with a typical investment portfolio including large, centralized, generation plants and centralized decision-making structures. Due to the enormous scale of generation investment, transmission and distribution were considered "overheads", and a small, fixed percentage of capital investment in generation. Methodologies used to aid decision-making were therefore based on several assumptions of system configuration and institutional structure that do not necessarily hold any more. Keeping with the terminology of the above section, in a traditional utility planning context, TB would just be P.Q, for a sale of Q kWh of electricity at price P. The only relevant costs incorporated into planning would be
SC= CGSCi + TSCi
subject to demand D, reliability R.
where GSCi is loosely defined as the contribution to cost from each participant generator, and TSCi is a fixed proportion of the capital component of GSCi, and distribution costs are often neglected. Utilities usually have an obligation to serve that manifests itself as a constraint on the reliability of service, and has different measures, such as reserve margin and Loss of Load Probability (LOLP).
Two levels of planning, distinguished by their time scales, typify decision-making in utilities; On a day to day basis, utilities optimize the dispatch of plants in their generation mix to meet demand at the least possible cost. Operational issues, such as unit commitment and level of spinning reserves typify planning in the short run. On a longer time scale, utilities plan capacity expansion to meet forecasted demand growth, and are concerned with the costs of production and generation over several years, and thus minimize the discounted sum of annualized capital
and operational costs over a planning period. Clearly, the capacity expansion and replacement differentiates long run planning from planning of operations and dispatch.
3.1.2 Prices and Capacity Planning
The economic signal that drives planning and capacity expansion is price, and indirectly the expectation of future profits. In fact, the need for simultaneous optimal price planning and optimal capacity expansion is recognized for the maximization of the net social benefits of electricity consumption.2 2 The nature of the price signal, which has been regulated almost universally until recently, therefore determines the nature of capacity planning in a utility. An "incorrect" price signal can introduce economic inefficiencies in planning, or leave no economic incentive for capacity expansion - although obligatory requirements may require expansion in any case. For example, in the US, average cost-based pricing allowed utilities to pass high capital costs through to consumers and consequently encouraged capital-intensive, bulk investments in power.
The theoretical valuation of intermittent electricity depends on the regulatory, institutional and rate structure, since they determine how costs are calculated and how profits are determined2 3. Rates are important for the valuation of photovoltaics, since they determine the cost at which an intermittent system would appear attractive for investment. If rates are based on average costs, for example, photovoltaics would appear profitable only if they generate at a cost lower than their average cost, when in fact the marginal cost of the electricity being displaced by photovoltaics may be much higher than average costs. Therefore, if rates do not reflect the marginal value of electricity, no incentive exists for investing in intermittent systems. Often rates reflect the short run marginal cost (SRMC) of electricity, in which case the value of an intermittent system lies only in the avoided marginal energy costs.
The pricing of electricity based on the anticipated costs of future investments in capacity is called Long Run Marginal Cost (LRMC) pricing. The LRMC approach differs from the traditional
22 Ibid. Pg 100
2 3
See Tabors et al. for a good discussion on economic worth of distributed generation in a regulated utility envr'ironlment.