Publisher’s version / Version de l'éditeur:
Biochemistry, 42, 17, pp. 4896-4903, 2003-05-06
READ THESE TERMS AND CONDITIONS CAREFULLY BEFORE USING THIS WEBSITE.
https://nrc-publications.canada.ca/eng/copyright
Vous avez des questions? Nous pouvons vous aider. Pour communiquer directement avec un auteur, consultez la première page de la revue dans laquelle son article a été publié afin de trouver ses coordonnées. Si vous n’arrivez pas à les repérer, communiquez avec nous à PublicationsArchive-ArchivesPublications@nrc-cnrc.gc.ca.
Questions? Contact the NRC Publications Archive team at
PublicationsArchive-ArchivesPublications@nrc-cnrc.gc.ca. If you wish to email the authors directly, please see the first page of the publication for their contact information.
NRC Publications Archive
Archives des publications du CNRC
This publication could be one of several versions: author’s original, accepted manuscript or the publisher’s version. / La version de cette publication peut être l’une des suivantes : la version prépublication de l’auteur, la version acceptée du manuscrit ou la version de l’éditeur.
For the publisher’s version, please access the DOI link below./ Pour consulter la version de l’éditeur, utilisez le lien DOI ci-dessous.
https://doi.org/10.1021/bi026395b
Access and use of this website and the material on it are subject to the Terms and Conditions set forth at
FeNO Structure in Distal Pocket Mutants of Myoglobin Based on
Resonance Raman Spectroscopy
Coyle, Candace M.; Vogel, Kathleen M.; Rush, Thomas S.; Kozlowski, Pawel
M.; Williams, Robert; Spiro, Thomas G.; Dou, Yi; Ikeda-Saito, Masao; Olson,
John S.; Zgierski, Marek Z.
https://publications-cnrc.canada.ca/fra/droits
L’accès à ce site Web et l’utilisation de son contenu sont assujettis aux conditions présentées dans le site LISEZ CES CONDITIONS ATTENTIVEMENT AVANT D’UTILISER CE SITE WEB.
NRC Publications Record / Notice d'Archives des publications de CNRC:
https://nrc-publications.canada.ca/eng/view/object/?id=b3a0030d-1db8-402e-9187-00ea96754c47 https://publications-cnrc.canada.ca/fra/voir/objet/?id=b3a0030d-1db8-402e-9187-00ea96754c47FeNO Structure in Distal Pocket Mutants of Myoglobin Based on Resonance
Raman Spectroscopy
†Candace M. Coyle, Kathleen M. Vogel, Thomas S. Rush, III, Pawel M. Kozlowski, Robert Williams, and Thomas G. Spiro*
Department of Chemistry, Princeton UniVersity, Princeton, New Jersey 08544
Yi Dou and Masao Ikeda-Saito
Department of Physiology and Biophysics, Case Western ReserVe UniVersity School of Medicine, CleVeland, Ohio 44106-4970
John S. Olson
Department of Biochemistry and Cell Biology, Rice UniVersity, Houston, Texas 77005
Marek Z. Zgierski
Steacie Institute for Molecular Science, National Research Council of Canada, Ottawa, Ontario, Canada K1A OR6 ReceiVed July 2, 2002; ReVised Manuscript ReceiVed February 19, 2003
ABSTRACT: FeNO vibrational frequencies were investigated for a series of myoglobin mutants using
isotope-edited resonance Raman spectra of15/14NO adducts, which reveal the FeNO and NO stretching modes. The latter give rise to doublet bands, as a result of Fermi resonances with coincident porphyrin vibrations; these doublets were analyzed by curve-fitting to obtain the νNO frequencies. Variations in νNO among the mutants correlate with the reported νCO variations for the CO adducts of the same mutants. The correlation has a slope near unity, indicating equal sensitivity of the NO and CO bonds to polar influences in the heme pocket. A few mutants deviate from the correlation, indicating that distal interactions differ for the NO and CO adducts, probably because of the differing distal residue geometries. In contrast to the strong and consistent νFeC/νCO correlation found for the CO adducts, νFeN correlates only weakly with νNO, and the slope of the correlation depends on which residue is being mutated. This variability is suggested to arise from steric interactions, which change the FeNO angle and therefore alter the Fe-NO and N-O bond orders. This effect is modeled with Density Functional Theory (DFT) and is rationalized on the basis of a valence isomer bonding model. The FeNO unit, which is naturally bent, is a more sensitive reporter of steric interactions than the FeCO unit, which is naturally linear. An important additional factor is the strength of the bond to the proximal ligand, which modulates the valence isomer equilibrium. The FeNO unit is bent more strongly in MbNO than in protein-free heme-NO complexes because of a combination of a strengthened proximal bond and distal interactions.
The discovery that the simple diatomic molecule NO1is
a key biological messenger, whose level controls many physiological responses, has focused attention on the heme proteins involved in NO production (NO synthases), or message transduction (soluble guanylyl cyclases), or in NO transport and oxidation (hemoglobin, myoglobin, nitrophorin) (1-8). The heme prosthetic group is chemically identical in all these proteins, so that variations in the NO reactivity must arise from different endogenous ligands to the heme Fe and/ or from different steric and electronic interactions of the bound NO with protein residues.
A useful technique to monitor these differences is reso-nance Raman spectroscopy (9). Resoreso-nance with the heme π-π* electronic transitions enhances vibrational modes of the porphyrin ring, and also metal-ligand modes, if the ligands are coupled electronically with the porphyrin π system (10). This coupling is present for the diatomic ligands CO, NO, and O2because their empty π* orbitals share Fe
dπelectrons with the porphyrin π* orbitals. As a result,
Fe-XO stretching and X-O stretching modes of the bound Fe-XO ligands are detectable in RR spectra of heme proteins, and their assignments can be established using isotopically labeled XO (11). The frequencies of these vibrations are sensitive to interactions of the bound XO with the protein. These interactions have been studied extensively for CO adducts, using well-established relationships with the degree of back-bonding, as influenced by polar residues in the heme pocket, and/or by changes in the axial ligand trans to the CO (12-14). Studies on site-directed mutants of myoglobin †This work was supported by NIH Grants GM 33576 (T.G.S.), GM
35649 (J.S.O.), HL47020 (J.S.O.), and GM 57272 (M.I.-S.); Robert A. Welch Foundation Grant C-612 (J.S.O.); and W. M. Keck Center for Computational Biology (J.S.O.).
* Corresponding author. Tel: (609) 258-3907. Fax: (609) 258-0348. E-mail: spiro@princeton.edu.
1Abbreviations: NO, nitric oxide; RR, resonance Raman; DFT,
density functional theory; Mb, myoglobin.
Biochemistry 2003, 42,
10.1021/bi026395b CCC: $25.00 © 2003 American Chemical Society Published on Web 04/12/2003
(Mb) have established that wide variations in νCO and νFeC can be understood on the basis of changes in the electrostatic potential associated with polar residues in the vicinity of the bound CO (15).
Bonding to Fe[II] is simpler for CO than for NO or O2,
which have antibonding electrons in their π* orbitals and which are therefore bent rather than linear (16). Despite this added complexity, we have found that back-bonding changes influence the Fe-XO and X-O stretching frequencies in a straightforward manner for 5-coordinate NO and O2adducts
of Fe[II] porphyrins (17). However, the nature of proximal and distal residue interactions has not been analyzed systematically. In this study, we turn to the Mb site mutants (Figure 1) that have proved especially useful in the analysis of CO adducts (12, 15a-c, 18) and examine trends in νNO and νFeN. These modes have been assigned and discussed for several Mb mutants by Tomita et al. (19) using15N and 18O isotope substitution, following earlier studies of
cyto-chrome P450 NO adducts by Hu and Kincaid (20). Our results are consistent with these studies and extend to a larger range of distal influences in the heme binding pocket, pro-viding a broader view of the factors determining the vibra-tional frequencies. We find that the electrostatic field deter-mines νNO, just as it deterdeter-mines νCO in the CO adducts. However, the behavior of νFeX is quite different for CO and NO adducts. Whereas νFeC is simply anticorrelated with νCO, the correlation between νFeN and νNO varies in slope, depending on the position of the distal residue being mutated. We propose that steric forces that alter the FeNO geometry are responsible for this complex behavior and provide suggestive support for this view from trial DFT calculations. EXPERIMENTAL PROCEDURES
Site-Directed Mutagenesis. Mutations in recombinant
sperm whale, human, and pig myoglobin gene were intro-duced using either oligonucleotide-directed or cassette mu-tagenesis methods as described previously (21-24). The purification of expressed recombinant myoglobins was achieved by a combination of gel-filtration and ionic-exchange column chromatography (25-27).
Preparation of NO Adducts.Purified metmyoglobin mutant
solutions (200 µM) in 0.1 M sodium phosphate/1 mM EDTA (pH 7.0) buffer were flushed with argon in a septum-sealed NMR tube. The addition of a minimal concentration of an anaerobic solution of aqueous, buffered sodium dithionite converted the metMb to the deoxy form. NO gas was produced by reaction of sodium nitrite (Na14NO2, Na15NO2)
with sodium ascorbate in an aqueous solution and was transferred to the samples via a gastight syringe to generate the Fe[II]NO adducts, whose formation was monitored by the shift of the deoxy heme Soret band to ca. 420 nm in the absorption spectrum.
For studies of 5-coordinate adducts, the pH was lowered to 4.0 with degassed acetic acid. Dissociation of the histidine ligand (28) was confirmed via the blue shift in the heme Soret band to ca. 400 nm.
Resonance Raman Spectroscopy.Resonance Raman
spec-tra were obtained with 406.7 or 413.1 nm excitation from a Kr+ laser (Coherent Innova 100-K3) in a backscattering
sample geometry. To minimize photolysis, the laser power was kept low (∼50 mW) and was focused with a cylindrical lens onto the spinning sample. The scattered light was collected and focused onto a Spex 1877 triple spectrograph equipped with a cooled, intensified diode array detector (Princeton Instruments). Spectra were calibrated with toluene, indene, acetone, dimethyl formamide, and carbon tetra-chloride. The spectra were processed with Labcalc software (Galactic Industries Corp.). The complex bands in the νNO region were resolved by curvefitting, with 50% Gaussian/ 50% Lorentzian band shapes and fixed bandwidths (10 cm-1).
RESULTS
Spectral Analysis. RR spectra of MbNO are dominated
by porphyrin modes, but the νFeN and νNO bands can be detected by isotope editing (Figure 2), at ca. 550 and ca. 1610 cm-1(19, 20, 29, 30). In favorable cases, the Fe-N-O
bending vibration can also be detected, at ca. 450 cm-1(19, 20). These mode designations are approximations since the
Fe-NO stretching and Fe-N-O bending coordinates are mixed with each other, and also with porphyrin modes, but the Fe-N coordinate is the major contributor to the ca. 550 cm-1mode, which shifts distinctively, by ca. 15 cm-1, upon 15NO substitution (20).
The NO stretching band falls in a spectral region crowded with porphyrin bands but is revealed in the 14NO-15NO
difference spectrum. The difference spectrum is noisy, because the NO signal is weak, but the positive and negative
14NO and15NO bands are evident. However, the band appears
as a doublet for14NO but as a singlet for15NO. This behavior
has also been observed by Tomita et al. (19), who attributed it to a Fermi resonance interaction with a porphyrin vibration at the same frequency. This interaction mixes the two modes, separating their frequencies and sharing their intensities.
A doublet structure is seen in most of our isotopic difference spectra (Figure 3), although sometimes it occurs for the14NO band and sometimes for the15NO band. As the
band positions shift, sometimes one and sometimes another of the isotope signals comes into Fermi resonance with one of the several porphyrin modes in the spectral region. Similar effects have been seen, and extensively analyzed by Kincaid and co-workers, for heme-O2adducts (31).
FIGURE1: Structural diagram of the Mb binding pocket, showing
the mutated distal residues (45).
Because of these Fermi resonances, determining the NO frequencies is not straightforward. To estimate the unper-turbed N-O stretching frequencies, we curve-fit the differ-ence spectra (Figure 3), using one or two components for each νNO band, and averaged the doublet frequencies. Because of the low signal/noise ratio, the fitting had to be constrained. We did this by applying the physically reason-able assumptions that the bandwidth be constant (10 cm-1
was chosen from the width of the bands without Fermi resonance) and that the frequency separation between the averaged14NO and15NO frequencies be close to the value
calculated for an isolated NO oscillator, 30 cm-1. The spectra
computed from the fitted bands are shown as dotted lines in Figure 3.
The results (Table 1) show a range of frequencies, from 1601 to 1638 cm-1. Because of the band fitting procedure,
the uncertainty of the νNO values is estimated to be (4 cm-1. However, as will be seen, the frequencies are very
well-correlated with the CO stretching frequencies of the CO adducts of these same Mb variants (Figure 6), lending confidence in the methodology. The νFeN frequencies (Figure 4, Table 1), which are not subject to the Fermi resonance complication, range from 547 to 570 cm-1. The
genetic background, sw ) sperm whale, h ) human, and p )pig, is indicated for all the mutants. Where comparisons are possible for the same distal pocket in different back-grounds, the vibrational frequencies are essentially the same (Table 1).
Although variable, these frequencies are characteristic of 6-coordinate NO heme adducts, indicating that the proximal histidine ligand is intact (29, 30). For 5-coordinate NO adducts, νNO is distinctly higher, ca. 1665 cm-1, while νFeN
is distinctly lower, ca. 520 cm-1(17). We examined several
5-coordinate NO adducts of heme proteins (Figure 5). The νNO values are between 1662 and 1672 cm-1, in agreement with Tomita et al. (19). These adducts are readily prepared by lowering the solution pH to 4.0, where the proximal histidine is displaced via protonation (28). In addition, the H93Y mutant of Mb is 5-coordinate at neutral pH because the proximal His93 is replaced by a weaker Tyr ligand.
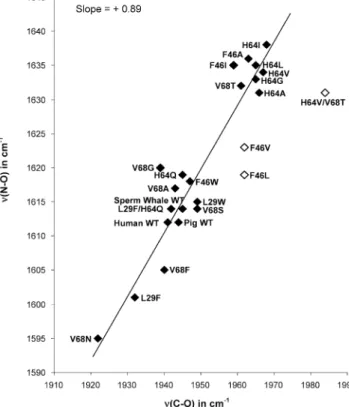
νNO/νCO Correlation. Previous vibrational studies of the CO adducts of mutant Mbs (12, 32-34) allow us to compare the effects of the same distal pocket perturbations on NO and CO (Table 2). The result (Figure 6) is an excellent correlation between νNO and νCO. The variations in νCO are associated with changes in dπ-π* back-bonding that result
from alterations in the distal pocket polarity (13). For the Mb mutants, the computed electrostatic potential of the binding pocket (15a-c) satisfactorily accounts for these variations. The principal determinants of this potential are polar residues in contact with the bound ligand. For wild-type Mb (middle of the correlation in Figure 6), the distal histidine, His64, provides positive polarity, increasing back-bonding, and depressing νCO, relative to mutants in which His64 is replaced by a hydrophobic residue (upper end of the correlation). In the V68N mutant (bottom of the cor-relation), the positive polarity of His64 is augmented by the introduced asparagine side chain at the adjacent position 68 (see Figure 1). Together these distal pocket variants span a νCO range of 60 cm-1.
It is apparent that the polarity influences are essentially the same for νNO as for νCO. The slope of the νNO/νCO correlation is 0.89, establishing that νCO and νNO are almost equally sensitive to back-bonding changes resulting from distal polarity influences. There are a few deviant points on the νNO/νCO correlation for which reasonable structural explanations can be advanced.
The H64V/T68T double mutant has an anomalously high ν(C-O), as a result of a negative polar interaction, which diminishes back-bonding (35). The structural basis for this effect is the orientation of the introduced Thr 68 residue, which is H-bonded to the backbone carbonyl oxygen of His 64, and presents a lone pair to the bound CO. This localized interaction is unlikely to be maintained for bound NO because the FeNO unit is bent with the O atom pointing away from residue 68 (Figure 1), whereas the FeCO unit is upright. Consistent with loss of this interaction, νNO (1631 cm-1) is
at the normal all-hydrophobic value exhibited by other mutants in the upper cluster of the correlation. On the other hand, the F46V and F46L mutants exhibit all-hydrophobic values for νCO but somewhat depressed values for νNO. The His 64 side chain swings away from the bound CO in F46V because the buttressing effect of the adjacent Phe 46 side chain is lost (12, 36). The CO is left in a hydrophobic environment. We infer that bound NO retains a hydrogen bonding interaction with His 64 in the F46V, and possibly in the F46L mutant, probably as a result of the more polar nature of the FeNO complex. However, this interaction is weakened relative to the wild-type protein (higher νNO).
νFeNO/νNO Correlation. When νFeNO is plotted against νNO, a straight line of negative slope is obtained for protein-free 5-coordinate adducts (Figure 7), as described previously (17). This behavior is diagnostic of back-bonding since enhanced back-donation from Fedπto NO π* orbitals weaken
the NO bond while strengthening the Fe-NO bond. The
FIGURE2: RR spectra (413.1 nm excitation) for14NO and15NO
adducts of WT Mb and the difference bands for ν(Fe-NO) and ν(N-O).
slope of the correlation, -0.40, is the same as for 5-coor-dinate adducts of CO (37). The low-pH, 5-coor5-coor-dinate form of MbNO falls in the middle of this line.
However, the NO correlation differs markedly from the CO correlation when the 6-coordinate adducts are considered. In the case of CO, νFeC and νCO remain negatively correlated, but the line is displaced and its slope is increased, owing to the electronic effects of the trans ligand (13). When the data for the 6-coordinate NO mutants are examined, however, substantial and seemingly irregular deviations from the 5-coordinate line are observed, in the direction of higher νFeN and/or νNO frequencies (Figure 7). The νFeN/νNO plot for the mutants describes a fan that diverges toward
larger νNO values. The bottom of this fan is the negative correlation line obtained from the 5-coordinate NO adducts, while the top of the fan is a line on which the three Leu29 mutants fall. Although some of the scatter in the data may reflect uncertainties stemming from the Fermi resonances of νCO, as discussed above, it is evident that the mutants are not distributed randomly within the fan since replace-ments at a given distal position fall approximately on lines with different slopes. Thus, there is a relationship between the slope of the νFeN/νNO correlation and the geometric position of the residue replacements.
What would alter these slopes from the expected negative value seen for the 5-coordinate adducts? Since this negative
FIGURE3: 15/14NO difference RR spectra in the ν(N-O) region for MbNO mutants involving (A) H64, (B) V68, and (C) F46/L29 (413.1
nm excitation). The genetic background is indicated by the subscript: sw ) sperm whale, h ) human, and p ) pig). The dotted line is the result of curve fitting with 50% Gaussian/50% Lorentzian, using 10 cm-1bandwidths.
Table 1: Vibrational Frequencies and Isotope Shifts (cm-1) for 6-Coordinate Fe[II]NO Recombinant Myoglobin
proteina ν(14N-O), curvefit ν( 14N-O), avg ν( 15N-O), curvefit ν( 15N-O), avg ∆15NOb ν(Fe-NO) ∆15NOb human WT 1620/1604 1612 1586 1586 27 552 5 pig WT 1612 1612 1589 1589 23 551 3 sperm whale WTc 1614 1614 1590 1590 24 550 11 H64Qh 1625/1613 1619 1589 1589 30 555 3 H64Ghc 1636/1629 1633 1613 1602 31 554 5 H64Ah 1631 1631 1607/1589 1598 33 555 4 H64Vh 1634 1634 1613/1587 1600 34 557 8 H64Ih 1640/1636 1638 1620/1609 1615 24 558 10 H64Lhc 1635 1635 1614 1614 21 563 10 V68Fsw 1611/1598 1605 1585/1564 1575 30 570 15b V68Sp 1614 1614 1588 1588 26 547 11 V68Np 1595 1595 1566 1566 29 551 10 V68Gh 1620 1620 1588 1588 32 549 20b V68Ah 1623/1611 1617 1589 1589 28 551 15b V68Thc 1632 1632 1602 1602 30 548 6 V68T/H64Vp 1631 1631 1615/1591 1603 28 553 13b F46Wsw 1618 1618 1588 1588 30 552 4 F46Lsw 1621/1616 1619 1595/1583 1589 30 550 5 F46Vsw 1623 1623 1590 1590 33 552 9 F46Asw 1636 1636 1615/1591 1603 33 551 5 F46Isw 1640/1629 1635 1611/1590 1601 34 548 4 L29Wswc 1622/1608 1615 1586 1586 29 559 10 L29Fsw 1609/1592 1601 1583/1561 1572 29 551 3 L29F/H64Qsw 1626/1602 1614 1593/1581 1587 27 558 11
aSubscripts indicate the genetic background of the mutant proteins; h ) human, p ) pig, and sw ) sperm whale.bThe values of the isotope shift are not precisely determined because of the broad bandwidth of the ν(Fe-NO) band, as well as overlap with porphyrin modes.cAlso reported by Tomita et al. (19).
slope is a signature of back-bonding, we infer that the deviant behavior shown by the mutants reflects an additional source of variability peculiar to NO. The likeliest source involves changes in the FeNO geometry as a result of steric and electronic interactions with the protein.
DFT Estimation of the SensitiVity to FeNO Geometry.To
gauge the possible effects of geometry alteration, we turned to model calculations on the complex (NO)Fe(P)(ImH) (P ) porphine and ImH ) imidazole) using DFT. DFT is known to give a good account of geometries and vibrational frequencies for metalloporphyrins (38, 39) and was applied to (NO)Fe(P) (17). When the ImH ligand was added to the 5-coordinate model, DFT was found to miss the pronounced trans-labilizing effect of the NO (17). The computation produced a normal Fe-ImH bond length, and appreciable lengthening of the Fe-NO bond, contrary to experiment.
However, the FeNO angle was accurately calculated and changed very little upon adding the ImH, consistent with experiment (40).
Consequently, DFT is likely to provide a qualitatively correct account of the consequences of altering the FeNO angle, even if the quantitation is uncertain. To gauge this effect, we applied the same methodology as described in ref
17, constraining the FeNO angles to values which are 10°
FIGURE 4: RR spectra (413.1 nm excitation) in the ν(Fe-NO)
region for the indicated MbNO mutants.
FIGURE5: 15/14NO difference bands (413.1 nm excitation) of
ν(N-O) for 5-coordinate NO-heme protein adducts: horseradish per-oxidase at pH 3.0 (phosphate-HCl buffer), three Mb variants (the sperm whale L29I mutant and wild-type human and horse Mbs) at pH 4.0 (phosphate-acetic acid buffer), and the H93Y Mbhmutant
at pH 7.0 (phosphate buffer).
FIGURE 6: ν(N-O)/ν(C-O) correlation for the indicated Mb
mutants. Data taken from Table 2. Outliers are marked with open diamondsssee text for explanation.
Table 2: Vibrational Frequencies (cm-1) for NO and COaAdducts of Mb Mutants
proteinb
ν(Fe-NO) ν(N-O) ν(Fe-CO) ν(C-O)
human WT 552 1612 508 1941 pig WT 551 1612 490 1944 sperm whale WT 550 1614 580 1945 H64Qh 555 1619 507 1945 H64Gh 554 1633 492 1965 H64Ah 555 1631 490 1966 H64Vh 557 1634 488 1967 H64Ih 558 1638 490 1968 H64Lh 563 1635 490 1965 V68Fsw 570 1605 n.d.c 1940 V68Sp 547 1614 n.d. 1949 V68Np 551 1595 526 1922 V68Gh 549 1620 n.d. 1939 V68Ah 551 1617 n.d. 1943 V68Th 548 1632 493 1961 H64V/V68Tp 553 1631 478 1984 F46Wsw 552 1618 n.d. 1947 F46Lsw 550 1619 n.d. 1962 F46Vsw 552 1623 489 1962 F46Asw 551 1636 n.d. 1963 F46Isw 548 1635 n.d. 1959 L29Wsw 559 1615 n.d. 1949 L29Fsw 551 1601 525 1932 L29F/H64Qsw 558 1614 513 1942
aCO data taken from refs 12, 15, and 33-35.bSubscripts as in Table 1.cn.d.: not determined.
larger and smaller than the calculated equilibrium angle, 141.6°. All other structural parameters were allowed to optimize in response to the angle constraints.
The results are given in Table 3. As might be expected, the bending potential is soft. Opening the angle by 10°costs 0.94 kcal/mol, while closing it 10° costs 1.18 kcal/mol. However, the effects on the calculated frequencies are large, and they are asymmetrical. The mode labeled νFeN has contributions from Fe-N-O bending and from porphyrin coordinates, as noted above, but Fe-N stretching is the largest contributor (over 65% of the potential energy (17)), and the15N isotope shift is as observed in the RR spectra.
Closing the angle by 10°produces large reductions in both νNO (-74 cm-1) and νFeN (-41 cm-1), whereas opening the angle by 10°increases νNO substantially (+30 cm-1)
but leaves νFeN essentially unaltered (-1 cm-1). The
electronic contribution to these shifts can be seen in the calculated bond distance changes (Table 3). Closing the angle by 10° lengthens the NO bond by 0.0031 Å and the Fe-NO bond by 0.024 Å, while opening the angle by 10°shrinks the NO bond by 0.0015 Å and the Fe-NO bond by 0.006 Å. The νNO shifts scale roughly with the NO distance changes; the νNO downshift for -10° is about twice the upshift for +10°. Correspondingly, the νFeN upshift at +10°
should be about one-fourth the downshift at -10°, but the small expected upshift is canceled by a kinematic effect since
opening the angle increases the effective mass of the oscillator (20).
The calculated frequencies are plotted in Figure 8, and a line with the experimental back-bonding slope for 5-coor-dinate NO adducts is drawn through the 141.6° (natural angle) point. We see that external influences that widen the FeNO angle are expected to increase νNO from the value expected on the basis of back-bonding alone, with little change in νFeN, while closing the angle decreases both νNO and νFeN.
DISCUSSION
The present results reveal similarities and also striking differences in the pattern of vibrational frequencies for NO-heme adducts vis a vis their CO-NO-heme counterparts. To understand these patterns, we refer to the valence isomer bonding model (17) illustrated in Figure 9. For both CO and NO, the bonding is dominated by electron back-donation from the filled dπorbitals on Fe to the ligand π* orbitals.
The π* orbitals are empty for CO, and back-bonding is maximized by the upright geometry of isomer I. However, NO has an electron in its π* orbitals, which creates an antibonding interaction and induces FeNO bending. The bending reduces the π overlap in one plane (shown as xz in Figure 9); the relief of the antibonding interaction is paid for by the loss in back-bonding. However, back-bonding is undiminished in the xy plane and is actually strengthened, relative to CO, by the lower π* orbital energy of NO than of CO (because of the higher effective nuclear charge on N than on C). These offsetting factors, loss of back-bonding in the bending plane and increased back-bonding in the perpendicular plane, leave NO with about the same extent of back-bonding as CO, as reflected in similar slopes for the νFeX/νXO correlations of 5-coordinate adducts (17) and also in the near-unity slope of the νNO/νCO correlation (Figure 6) of the Mb mutant adducts in this study.
FIGURE 7: ν(Fe-NO)/ν(N-O) correlations. The points for
5-coordinate NO adducts are from ref 17 except MbNO (pH 4) (0), which is from ref 20, while the points for the Mb mutants are from Table 2. Dotted lines connect mutations at the indicated positions: L29 (2), H64 (+), V68 (b), and F46 (O). The dashed line is the suggested back-bonding correlation for the 6-coordinate MbNO adducts in the absence of distal steric or polar influences.
Table 3: DFT Calculated Energies (kcal/mol), Vibrational Frequencies (cm-1), and Structural Parameters (Å) for an
Fe(P)(Im)(NO) Adduct under Distortion Fe-NO Angle parameters 131.6° 141.6° 151.6° Fe-NO (Å) 1.810 1.786 1.780 N-O (Å) 1.204 1.201 1.120 ν(Fe-NO) 499 541 540 ν(N-O) 1614 1687 1718 energy (kcal/mol) 1.18 0 0.94
FIGURE8: DFT computed ν(Fe-NO) and ν(N-O) frequencies for
the equilibrium angle, 141.6°, and for (10°changes in angle. The solid line is drawn through the equilibrium data point with a slope of -0.40, the back-bonding slope for 5-coordinate No adducts.
In protein-free adducts, the FeNO angle is ca. 145°
(41-43). This value can be viewed as resulting from the valence
isomer equilibrium (Figure 7) between a 120°Fe[III](NO-)
unit with a NdO double bond (isomer II) and a linear Fe[I](NO+) unit with a NtO triple bond (isomer I) (17).
(Two structures are not observed in the RR spectra, implying that equilibration is rapid on the vibrational time scale; the term resonance could be applied instead, except that the nuclei are significantly displaced between the two resonance forms.) The transition between isomer II and I requires transfer of a pair of electrons from NO-to the Fe[III]; one
of these electrons fills the vacancy in the dxzorbital, while the other enters the dz2 orbital, thereby repelling the trans ligand, L. This is the origin of the strong trans effect exerted by NO (41-43).
Binding of L to 5-coordinate NO-heme is expected to shift the equilibrium toward isomer II, decreasing the FeNO angle. In protein-free 6-coordinate NO adducts, the reported decrease in the FeNO angle is small, ∼7°, whereas the L-Fe distance is long, ∼2.3 Å (41-43). Thus, the L-Fe bond is insufficiently strong to shift the equilibrium very far toward isomer II. However, the situation may be different in a heme protein where the interaction with the proximal ligand is enforced by the polypeptide structure. This view is strongly supported by the surprisingly acute FeNO angle, 112°, determined by X-ray crystallography on MbNO (44), a value consistent with earlier single-crystal EPR measurements (45,
46) (although a frozen solution multiple-scattering EXAFS
study indicates a much shallower angle, 150°(47)). The extra bending is attributable to the combination of H-bonding from the distal histidine (44) and strengthened proximal bonding; the Fe-His bond is reported to be as short as that of the CO adduct (44). In contrast, the NO adduct of lupin leghemo-globin (48), which has a 145°bond angle, does not have a close interaction with the distal histidine, and its Fe-His bond is reported to be longer than that of the CO adduct. (However, there is some question about the absolute bond length, which is given as 2.22 Å, essentially the same as that of MbNO, 2.18 Å.)
The 112°angle implies a shift of the valence equilibrium entirely to isomer II, and the Fe-NO bond should be correspondingly weakened; the DFT computations predict lengthening of this bond with decreasing FeNO angle (Table
3). A weakened Fe-NO bond would increase the slope of the νFeN/νNO back-bonding line because the sensitivity of νFeX to changes in Fe-XO back-bonding increases when the Fe-X distance increases (17).
This consideration leads us to a hypothesis about the meaning of the fan-shaped νFeN/νNO plot (Figure 7) for the 6-coordinate Mb mutant adducts. We propose that the back-bonding reference point for the 6-coordinate protein adducts is not the wild-type protein but rather one of the mutants in which the distal histidine is replaced by a sterically neutral hydrophobic residue (e.g., H64L or H64I). These mutants express the back-bonding influence of the proximal Fe-His bond without additional polar or steric influences. The appropriate back-bonding line might then be something like the dashed line in Figure 7, with a larger slope than the 5-coordinate line. The points for the remaining mutants and for wild-type protein would then be below the back-bonding line appropriate for the proximal Fe-His bond of Mb. These deviations are in the direction suggested by the model DFT calculation for FeNO angles less than the equilibrium value; they could result from steric crowding by distal residues and from adjustments in the FeNO angle that optimize polar interactions. The fan then represents deviations that depend on the exact position of the distal residue being substituted. The deviations converge toward the wild-type protein, presumably because it has the smallest FeNO angle as a result of steric and polar interaction with His64.
One may ask why similar influences are not manifested for the CO adducts of the Mb mutants, even though νCO and νNO show similar sensitivity to polar influences. The reason is that modest displacements from the electronically preferred 180° FeCO angle do not materially affect the vibrational frequencies (38). In contrast, small changes in the FeNO angle produce large changes in vibrational frequencies (Table 3) because of the electronic effects of the valence isomer equilibrium, especially when this equi-librium is displaced toward smaller angles by enforced proximal ligation. The bonding becomes highly sensitive to steric as well as polar influences.
It would be helpful to have vibrational data on protein-free 6-coordinate NO-heme adducts, to calibrate the pos-tulated constraining effect of the protein. Lipscomb et al. (49) reported RR bands for some 6-coordinated (NO)Fe[II]-(OEP)L adducts, but the cited νFeN frequencies are close to those of 5-coordinate adducts, as pointed out by Tomita et al. (19), who were unable to obtain 6-coordinate spectra because of the lability of the trans ligand. We also tried to obtain spectra in the presence of a large excess of various imidazole ligands but without seeing any change in the 5-coordinate signals. It is possible that the Raman laser drives off the weakly bound trans ligand since infrared spectra have been reported for (NO)Fe[II](protoporphyrin)(N-methyl-imidazole) with νNO in the 6-coordinate range (50, 51). Interestingly, the value in aprotic solvents, 1616-1618 cm-1,
is distinctly lower than the ∼1635 cm-1value exhibited by
the hydrophobic pocket Mb mutants. We suggest that this difference is a reflection of the altered back-bonding slope resulting from the strengthened proximal ligand bond in the protein. (Without a value for νFeN, we are unable to test this interpretation by locating the 6-coordinate model com-pound in the back-bonding plot.)
FIGURE9: Valence isomer bonding model for heme-NO adducts.
CONCLUSIONS
The analysis of metal-ligand vibrational frequencies is more complex for FeNO than FeCO in heme proteins. The additional complexity stems from the extra antibonding electron on NO, which bends the FeNO unit and poises the structure between two isomeric forms, with differing bond orders. The vibrational frequencies are sensitive both to electronic polarization, which tunes the degree of back-bonding, and to the strength of the bond to the trans axial ligand, which alters the valence isomer equilibrium and therefore the FeNO angle. As a result of this equilibrium, the FeNO angle is also sensitive to steric and polar forces. Consequently, a plot of νFeX/νXO shows much more scatter for NO than CO. Within the scatter, some trends emerge that point to the importance of the heme pocket geometry in determining the frequencies. Thus, the data contain poten-tially valuable structural information. However, extracting this information will require improvements both in compu-tational capabilities and in the available database. Encourag-ingly, the νNO values correlate very well with νCO for a common set of proteins, reflecting similar sensitivity to the electrostatic potential. It is likely that deviations from this correlation reflect altered distal interactions for NO relative to CO.
REFERENCES
1. Ignarro, L. J., Barry, B. K., Gruetter, D. Y., Ohlstein, E. H., Gruetter, C. A., Kadowitz, P. J., and Baricos, W. H. (1981)
Biochim. Biophys. Acta 673, 394-407.
2. White, K. A., and Marletta, M. A. (1992) Biochemistry 31, 6627-6631.
3. McMillan, K., Bredt, D. S., Hirsch, D. J., Snyder, S. H., Clark, J. E., and Masters, B. S. S. (1992) Proc. Natl. Acad. Sci. U.S.A. 89, 11141-11145.
4. Stuehr, D. J., and Ikeda-Saito, M. (1992) J. Biol. Chem. 267, 20547-20550.
5. Bourassa, J. L., Ives, E. P., Marqueling, A. L., Shimanovich, R., and Groves, J. T. (2001) J. Am. Chem. Soc. 123, 5142-5143. 6. Deinum, G., Stone, J. R., Babcock, G. T., and Marletta, M. A.
(1996) Biochemistry 35, 1540-1547.
7. Ding, X. D., Weichsel, A., Andersen, J. F., Shokhireva, T. K., Balfour, C., Pierik, A. J., Averill, B. A., Montfort, W. R., and Walker, F. A. (1999) J. Am. Chem. Soc. 121, 128-138. 8. Ribeiro, J. M. C., Hazzard, J. M. H., Nussenzveig, R. H.,
Champagne, D. E., and Walker, F. A. (1993) Science 260, 539-541.
9. Yu, N. T. (1986) Methods in Enzymology (Hirs, C. H. W., and Timasheff, S. N., Eds.) Vol. 130, pp 350-409, Academic Press, Orlando.
10. Spiro, T. G., and Li, X. Y. (1988) Biological Applications of
Raman Spectroscopy(Spiro, T. G., Ed.) Vol. 3, pp 1-38, John Wiley and Sons, Inc., New York.
11. Kerr, E. A., and Yu, N. T. (1988) Biological Applications of Raman
Spectroscopy(Spiro, T. G., Ed.) Vol. 3, pp 39-96, John Wiley
and Sons, Inc., New York.
12. Li, T. S., Quillin, M. L., Phillips, G. N., and Olson, J. S. (1994)
Biochemistry 33, 1433-1446.
13. Li, X. Y., and Spiro, T. G. (1988) J. Am. Chem. Soc. 110, 6024-6033.
14. Ray, G. B., Li, X. Y., Ibers, J. A., Sessler, J. L., and Spiro, T. G. (1994) J. Am. Chem. Soc. 116, 162-176.
15. (a) Phillips, G. N., Teodoro, M. L., Li, T. S., Smith, B., and Olson, J. S. (1999) J. Phys. Chem. B 103, 8817-8829. (b) Park, E. S., and Boxer, S. G. (2000) J. Phys. Chem. B 106, 5800-5806. (c) Franzen, S. (2002) J. Am. Chem. Soc. 124, 13271-13281. 16. Enemark, J. H., and Feltham, R. D. (1974) J. Am. Chem. Soc. 96,
5002-5004.
17. Vogel, K. M., Kozlowski, P. M., Zgierski, M. Z., and Spiro, T. G. (1999) J. Am. Chem. Soc. 121, 9915-9921.
18. Olson, J. S., and Phillips, G. N. (1997) J. Biol. Inorg. Chem. 2, 544-552.
19. Tomita, T., Hirota, S., Ogura, T., Olson, J. S., and Kitagawa, T. (1999) J. Phys. Chem. B 103, 7044-7054.
20. Hu, S. Z., and Kincaid, J. R. (1991) J. Am. Chem. Soc. 113, 9760-9766.
21. Carver, T. E., Brantley, R. E., Singleton, E. W., Arduini, R. M., Quillin, M. L., Phillips, G. N., and Olson, J. S. (1992) J. Biol.
Chem. 267, 14443-14450.
22. Ikeda-Saito, M., Hori, H., Andersson, L. A., Prince, R. C., Pickering, I. J., George, G. N., Sanders, C. R., Lutz, R. S., McKelvey, E. J., and Mattera, R. (1992) J. Biol. Chem. 267, 22843-22852.
23. Smerdon, S. J., Dodson, G. G., Wilkinson, A. J., Gibson, Q. H., Blackmore, R. S., Carver, T. E., and Olson, J. S. (1991)
Biochemistry 30, 6252-6260.
24. Cameron, A. D., Smerdon, S. J., Wilkinson, A. J., Habash, J., Helliwell, J. R., Li, T. S., and Olson, J. S. (1993) Biochemistry
32, 13061-13070.
25. Varadarajan, R., Szabo, A., and Boxer, S. G. (1985) Proc. Natl.
Acad. Sci. U.S.A. 82, 5681-5684.
26. Springer, B. A., and Sligar, S. G. (1987) Proc. Natl. Acad. Sci.
U.S.A. 84, 8961-8965.
27. Dodson, G., Hubbard, R. E., Oldfield, T. J., Smerdon, S. J., and Wilkinson, A. J. (1988) Protein Eng. 2, 233-237.
28. Duprat, A. F., Traylor, T. G., Wu, G. Z., Coletta, M., Sharma, V. S., Walda, K. N., and Magde, D. (1995) Biochemistry 34, 2634-2644.
29. Benko, B., and Yu, N. T. (1983) Proc. Natl. Acad. Sci. U.S.A. 80, 7042-7046.
30. Tsubaki, M., and Yu, N. T. (1982) Biochemistry 21, 1140-1144. 31. Proniewicz, L. M., and Kincaid, J. R. (1997) Coord. Chem. ReV.
161, 81-127.
32. Anderton, C. L., Hester, R. E., and Moore, J. N. (1997) Biochim.
Biophys. ActasProtein Struct. Mol. Enzymol. 1338, 107-120.
33. Ling, J. H., Li, T. S., Olson, J. S., and Bocian, D. F. (1994)
Biochim. Biophys. ActasBioenerg. 1188, 417-421.
34. Morikis, D., Champion, P. M., Springer, B. A., and Sligar, S. G. (1989) Biochemistry 28, 4791-4800.
35. Biram, D., Garratt, C. J., and Hester, R. E. (1991) Spectroscopy
of Biological Molecules(Hester, R. E., and Girling, R. B., Eds.) pp 433-434, Royal Society of Chemistry, Cambridge, UK. 36. Lai, H. H., Li, T. S., Lyons, D. S., Phillips, G. N., Olson, J. S.,
and Gibson, Q. H. (1995) Proteins 22, 322-339.
37. Vogel, K. M., Kozlowski, P. M., Zgierski, M. Z., and Spiro, T. G. (2000) Inorg. Chim. Acta 297, 11-17.
38. Spiro, T. G., and Kozlowski, P. M. (1998) J. Am. Chem. Soc.
120, 4524-4525.
39. Spiro, T. G., and Kozlowski, P. M. (1997) J. Biol. Inorg. Chem.
2, 516-520.
40. Scheidt, W. R., Duval, H. F., Neal, T. J., and Ellison, M. K. (2000)
J. Am. Chem. Soc. 122, 4651-4659.
41. Scheidt, W. R., and Piciulo, P. L. (1976) J. Am. Chem. Soc. 98, 1913-1919.
42. Scheidt, W. R., Brinegar, A. C., Ferro, E. B., and Kirner, J. F. (1977) J. Am. Chem. Soc. 99, 7315-7322.
43. Nasri, H., Haller, K. J., Wang, Y. N., Huynh, B. H., and Scheidt, W. R. (1992) Inorg. Chem. 31, 3459-3467.
44. Brucker, E. A., Olson, J. S., Ikeda-Saito, M., and Phillips, G. N. (1998) Proteins 30, 352-356.
45. Hori, H., Ikeda-Saito, M., and Yonetani, T. (1981) J. Biol. Chem.
256, 7849-7855.
46. Chien, J. C. W. (1969) J. Chem. Phys. 51, 4220.
47. Rich, A. M., Armstrong, R. S., Ellis, P. J., and Lay, P. A. (1998)
J. Am. Chem. Soc. 120, 10827-10836.
48. Edwards, S. L., and Poulos, T. L. (1990) J. Biol. Chem. 265, 2588-2595.
49. Lipscomb, L. A., Lee, B. S., and Yu, N. T. (1993) Inorg. Chem.
32, 281-286.
50. Maxwell, J. C., and Caughey, W. S. (1976) Biochemistry 15, 388-396.
51. Yoshimura, T. (1978) Bull. Chem. Soc. Jpn. 51, 1237-1238. BI026395B
![Table 1: Vibrational Frequencies and Isotope Shifts (cm -1 ) for 6-Coordinate Fe[II]NO Recombinant Myoglobin protein a ν( 14 N - O),](https://thumb-eu.123doks.com/thumbv2/123doknet/14194536.478794/5.918.101.818.76.387/vibrational-frequencies-isotope-shifts-coordinate-recombinant-myoglobin-protein.webp)