conservation of long noncoding RNAs in tumorigenesis
The MIT Faculty has made this article openly available.
Please share
how this access benefits you. Your story matters.
Citation
Carlevaro-Fita, Joana et al. "Cancer LncRNA Census reveals
evidence for deep functional conservation of long noncoding RNAs
in tumorigenesis." Communications Biology 3, 1 (February 2020): 56
© 2020 The Author(s)
As Published
http://dx.doi.org/10.1038/s42003-019-0741-7
Publisher
Springer Science and Business Media LLC
Version
Final published version
Citable link
https://hdl.handle.net/1721.1/129450
Terms of Use
Creative Commons Attribution 4.0 International license
Cancer LncRNA Census reveals evidence for deep
functional conservation of long noncoding RNAs
in tumorigenesis
Joana Carlevaro-Fita
1,2,3,126, Andrés Lanzós
1,2,3,126, Lars Feuerbach
4, Chen Hong
4, David Mas-Ponte
5,6,7,
Jakob Skou Pedersen
8, PCAWG Drivers and Functional Interpretation Group, Rory Johnson
1,2,3* & PCAWG
Consortium
Long non-coding RNAs (lncRNAs) are a growing focus of cancer genomics studies, creating the need for a resource of lncRNAs with validated cancer roles. Furthermore, it remains debated whether mutated lncRNAs can drive tumorigenesis, and whether such functions could be conserved during evolution. Here, as part of the ICGC/TCGA Pan-Cancer Analysis of Whole Genomes (PCAWG) Consortium, we introduce the Cancer LncRNA Census (CLC), a compilation of 122 GENCODE lncRNAs with causal roles in cancer phenotypes. In contrast to existing databases, CLC requires strong functional or genetic evidence. CLC genes are enriched amongst driver genes predicted from somatic mutations, and display characteristic genomic features. Strikingly, CLC genes are enriched for driver mutations from unbiased, genome-wide transposon-mutagenesis screens in mice. We identified 10 tumour-causing mutations in orthologues of 8 lncRNAs, including LINC-PINT and NEAT1, but not MALAT1. Thus CLC represents a dataset of high-confidence cancer lncRNAs. Mutagenesis maps are a novel means for identifying deeply-conserved roles of lncRNAs in tumorigenesis.
https://doi.org/10.1038/s42003-019-0741-7 OPEN
1Department of Medical Oncology, Inselspital, University Hospital and University of Bern, 3010 Bern, Switzerland.2Department of Biomedical Research,
University of Bern, 3008 Bern, Switzerland.3Graduate School for Cellular and Biomedical Sciences, University of Bern, 3012 Bern, Switzerland.4Applied Bioinformatics, Deutsches Krebsforschungszentrum, 69120 Heidelberg, Germany.5Centre for Genomic Regulation (CRG), The Barcelona Institute of Science and Technology, Dr. Aiguader 88, Barcelona 08003, Spain.6Universitat Pompeu Fabra (UPF), Barcelona, Spain.7Institut Hospital del Mar d’Investigacions Mèdiques (IMIM), Dr. Aiguader 88, 08003 Barcelona, Spain.8Department for Molecular Medicine, Aarhus University Hospital, Palle Juul-Jensens Boulevard
99, 8200 Aarhus N, Denmark.126These authors contributed equally: Joana Carlevaro-Fita, Andrés Lanzós. PCAWG Drivers and Functional Interpretation Working Group authors and their affiliations appear at the end of the paper. PCAWG Consortium members and their affiliations appear in the Supplementary Information. *email:rory.johnson@dbmr.unibe.ch
123456789
T
umorigenesis is driven by a series of genetic mutations that promote cancer phenotypes and consequently experience positive selection1. The systematic discovery of such drivermutations, and the genes whose functions they alter, has been made possible by tumour genome sequencing. By collecting the entirety of such genes for every cancer type, it should be possible to develop a comprehensive view of underlying processes and pathways, and thereby formulate effective, targeted therapeutic strategies.
The cast of genetic elements implicated in tumorigenesis has recently grown as diverse new classes of non-coding RNAs and regulatory features have been discovered. These include the long non-coding RNAs (lncRNAs), of which tens of thousands have been catalogued2–5. LncRNAs are >200 nt long transcripts with no protein-coding capacity. Their evolutionary conservation and regulated expression, combined with a number of well-characterised examples, have together led to the view that lncRNAs are bona fide functional genes6–9. Current thinking holds that lncRNAs function by forming complexes with proteins and RNA both inside and outside the nucleus10,11.
LncRNAs have been shown to play important roles in various cancers. For example, MALAT1, an oncogene across numerous cancers, is restricted to the nucleus and plays a housekeeping role in splicing12,13. MALAT1 is overexpressed in a variety of cancer types, and its knockdown potently reduces not only proliferation but also metastasis in vivo in mouse xenograft assays14. MALAT1
is subjected to elevated mutational rates in human tumours, although it has not yet been established whether these mutations drive tumorigenesis15,16. On the other hand, lncRNAs may also
function as tumour suppressors. LincRNA-p21 acts as a down-stream effector of p53 regulation through recruitment of the repressor hnRNP-K17.
Demonstrably conserved functions between human and mouse is potent evidence for gene’s importance, both in cancer and more generally. For well-known protein-coding genes with cancer roles in human, such as TP53 and MYC, mutations in mouse models can recapitulate the human disease18,19. For lncRNAs, evolutionary evidence has been mainly limited to discovery of sequence or positional orthologues, with no evidence for conserved functions20.
Further doubt has been introduced by the fact that mouse knock-outs of iconic cancer-related lncRNAs MALAT1 and NEAT1 dis-play little to no aberrant phenotype21–24. However, a recent study of
human and mouse orthologues of LINC-PINT showed that both have tumour-suppressor activity in cell lines, acting through a relatively short, conserved region25. Nevertheless, it remains unclear
whether this generalises to other identified lncRNAs, and whether mutations in them can induce tumours.
These and other examples of lncRNAs linked to cancer, raise the question of how many more remain to be found amongst the ~99% of annotated lncRNAs that are presently uncharacterised5,26,27. Recent tumour genome sequencing studies, in step with advanced bioinformatic driver-gene prediction methods, have yielded hun-dreds of new candidate protein-coding driver genes28. For eco-nomic reasons, these studies initially restricted their attention to exomes or the ~2% of the genome covering protein-coding exons29.
Unfortunately such a strategy ignores mutations in the remaining ~98% of genomic sequence, home to the majority of lncRNAs5,12.
Driver-gene identification methods rely on statistical models that make a series of assumptions about and simplifications of complex tumour mutation patterns30. It is critical to test the performance of such methods using true-positive lists of known cancer driver genes. For protein-coding genes, this role has been fulfilled by the Cancer Gene Census (CGC)31, which is collected and regularly updated by manual annotators. Comparison of driver predictions to CGC genes facilitates further method refinement and comparison between methods32–35.
In addition to its benchmarking role, the CGC resource has also been useful in identifying unique biological features of cancer genes. For example, CGC genes tend to be more con-served and longer. Furthermore, they are enriched for genes with transcription regulator activity and nucleic acid binding functions36,37.
Until very recently, efforts to discover cancer lncRNAs have depended on classical functional genomics approaches of differ-ential expression using microarrays or RNA sequencing17,27.
While valuable, differential expression per se is not direct evi-dence for causative roles in tumour evolution. To more directly identify lncRNAs that drive cancer progression, a number of methods, including several within the Pan-Cancer Analysis of Whole Genomes (PCAWG) Network16, have recently been developed to search for signals of positive selection using muta-tion maps of tumour genomes. OncodriveFML utilises nucleotide-level functional impact scores like those inferred from predicted changes in RNA secondary structure together with an empirical significance estimate, to identify lncRNAs with an excess of high-impact mutations34. Another method, ExInAtor,
identifies candidates with elevated mutational load, using trinucleotide-adjusted local background15. Furthermore, The
ICGC/TCGA Pan-Cancer Analysis of Whole Genomes
(PCAWG) Consortium aggregated whole genome sequencing data from 2658 cancers across 38 tumour types generated by the ICGC and TCGA projects38, and applied diverse tools to identify
cancer driver lncRNAs16. A clear impediment in such analyses has been the lack of true-positive set of known lncRNA driver genes, analogous to CGC. Valuable resources of cancer lncRNAs have been created, notably LncRNADisease39and Lnc2Cancer40.
These include minimally filtered data from numerous sources, which is beneficial in creating inclusive gene lists, but has drawbacks arising from permissive criteria for inclusion (including expression changes), and inconsistent gene identifiers. To facilitate the future discovery of cancer lncRNAs, and gain insights into their biology, we have compiled a highly-curated set of cases with roles in cancer processes. Here we present the Cancer LncRNA Census (CLC), the first compendium of lncRNAs with direct functional or genetic evidence for cancer roles. We demonstrate the utility of CLC in assessing the per-formance of driver lncRNA predictions. Through analysis of this gene set, we demonstrate that cancer lncRNAs have a unique series of features that may in future be used to assist de novo predictions. Finally, we show that CLC genes have conserved cancer roles across the ~80 million years of evolution separating humans and rodents.
Results
Definition of cancer-related lncRNAs. As part of recent efforts to identify driver lncRNAs by the Drivers and Functional Inter-pretation Group (PCAWG-2-5-9-14) within the ICGC/TCGA Pan-Cancer Analysis of Whole Genomes Network (henceforth PCAWG)16,38, we discovered the need for a high-confidence
reference set of cancer-related lncRNA genes, which we hence-forth refer to as cancer lncRNAs. We here present Version 1 of the Cancer LncRNA Census (CLC).
Cancer lncRNAs were identified from the literature using defined and consistent criteria, being direct experimental (in vitro or in vivo) or genetic (somatic or germline) evidence for roles in cancer progression or phenotypes (see Methods). Alterations in expression alone were not considered sufficient evidence. Importantly, only lncRNAs with GENCODE identifiers were included to allow direct integration and comparison between large-scale genomic projects41. For every cancer lncRNA, one or
Attesting to the value of this approach, we identified several cases in semi-automatically annotated cancer lncRNA databases of lncRNAs that were misassigned GENCODE identifiers, usually with an overlapping protein-coding gene39. We also excluded a
number of published lncRNAs for which we could not find evidence to meet our criteria, for example CONCR, SRA1 and KCNQ1OT142–44. We plan to collect these excluded lncRNAs in
future versions of CLC.
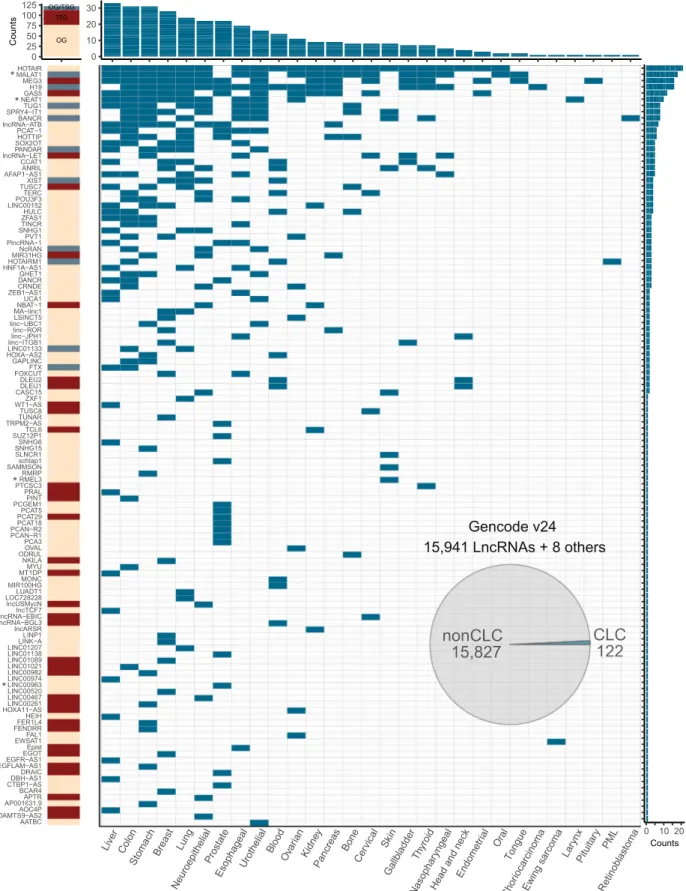
Version 1 of CLC contains 122 lncRNA genes, however, eight of them are annotated as pseudogenes rather than lncRNAs by GENCODE. The remaining 114 CLC genes correspond to 0.72% of a total of 15,941 lncRNA gene loci annotated in GENCODE v245,45
(Fig. 1). For comparison, the Cancer Gene Census (CGC) (COSMIC v78, downloaded 3 October 2016) lists 561 or 2.8% of protein-coding genes31. The entire remaining set of 15,827 lncRNA loci is henceforth referred to as non-CLC (Fig. 1). The full CLC dataset is found in Supplementary Data 1.
The cancer classification terminology used amongst the source literature for CLC was not uniform. Therefore, using the International Classification of Diseases for Oncology46, we
reassigned the cancer types described in the original research articles to a reduced set of 29 (Fig.1and Supplementary Fig. 1). Altogether, CLC contains 333 unique lncRNA-cancer type relationships. Out of 122 genes, 77 (63.1%) were shown to function as oncogenes, 35 (28.7%) as tumour suppressors, and 10 (8.2%) with evidence for both activities depending on the tumour type (Fig.1and Supplementary Fig. 1). It is unclear whether the difference in the frequencies of oncogenes and tumour suppres-sors has a biological explanation, or is simply the result of ascertainment bias. For protein-coding genes in the CGC (COSMIC v85, downloaded 25 May 2018), approximately equal numbers of oncogenes and tumour-suppressor genes are recorded (43% and 44%, respectively). It is important to take into account that the oncogene and tumour-suppressor classifications were deduced from the collected references. While a gene has shown oncogenic properties in a particular cancer type, future publica-tions could show that it funcpublica-tions as tumour suppressor in a different tissue, for example, the most studied lncRNAs in CLC (top of Fig.1) are enriched in dual functions.
The most prolific lncRNAs, with ≥16 recorded cancer types, are HOTAIR, MALAT1, MEG3 and H19 (Fig.1and Supplemen-tary Fig. 1). It is not clear whether this reflects their unique pan-cancer functionality, or is simply a result of their being amongst the most early-discovered and widely-studied lncRNAs.
In vitro experiments were the most frequent evidence source, usually consisting of RNAi-mediated knockdown in cultured cell lines, coupled to phenotypic assays such as proliferation or migration (Supplementary Fig. 1). Far fewer have been studied in vivo, or have cancer-associated somatic or germline mutations. Nineteen lncRNAs had three or more independent evidence sources (Supplementary Fig. 1).
CLC and other databases. There are a number of relevant lncRNA databases presently available: the Lnc2Cancer database (n= 654)40, the LncRNADisease database (n= 121)39 and
lncRNAdb (n= 191)26. CLC covers between 17% and 31% of these databases (Lnc2Cancer and LncRNADisease, respectively) but none of these resources contain the complete list of genes presented here (Fig. 2a). It is important to note that the other databases also include a minority of non-GENCODE genes, ranging from 40 to 316 (33 and 48%) (Fig. 2a). In addition, we intersected the four databases (Supplementary Fig. 2) using only GENCODE-annotated genes. It is clear that CLC has the greatest overlap with the other three, suggesting that it has the greatest specificity.
We sought to use recent unbiased proliferation screen data to independently compare cancer lncRNA databases9,47. Using only GENCODE-annotated genes, CLC is the resource that overall has the most nearly-significant (p-value = 0.08, Fisher’s exact test) fraction of independently-identified proliferation lncRNAs, although the sparse nature of the data means that this conclusion is not definitive (Fig.2b).
Finally, we downloaded and collected 8416 bioinformatically-predicted Gencode v24 lncRNAs from a recent TCGA publica-tion48, but found no significant overlap with CLC (69 gene;
p-value= 0.13, Fisher’s exact test).
CLC for benchmarking lncRNA driver prediction methods. One of the primary motivations for CLC is to develop a high-confidence functional set for benchmarking and comparing methods for identifying driver lncRNAs. In the domain of protein-coding driver-gene predictions, the Cancer Gene Census (CGC) has become such a gold standard training set31. Typically,
the predicted driver genes belonging to CGC are judged to be true positives, and the fraction of these amongst predictions is used to estimate the positive predictive value (PPV), or precision. This measure can be calculated for increasing cutoff levels, to assess the optimal cutoff.
First, we used CLC to examine the performance of the lncRNA driver predictor ExInAtor15 in recalling CLC genes using
PCAWG tumour mutation data16. A total of 2687 GENCODE
lncRNAs were tested here, of which 82 (3.1%) belong to CLC. Driver predictions on several cancers at the standard false discovery rate (q-value) cutoff of 0.1 are shown for selected cancers in Fig.3a. That panel shows the CLC-defined precision
(y-axis) as a function of predicted driver genes ranked by q-value (x-axis). We observe rather heterogeneous performance across cancer cohorts. This may reflect a combination of intrinsic biological differences and differences in cohort sizes, which differs widely between the datasets shown. For the merged pan-cancer dataset, ExInAtor predicted three CLC genes amongst its top ten candidates (q-value < 0.1), a rate far in excess of the background expectation (baseline, fraction of all lncRNAs in CLC). Similar enrichments are observed for other cancer types. These results support both the predictive value of ExInAtor, and the usefulness of CLC in assessing lncRNA driver predictors. In addition, we repeated the same analysis for each of the three mentioned databases (lnc2cancer, lncRNAdb and lncRNAdisease) (q-value < 0.2) (Supplementary Fig. 3). The precision level of all databases is around 40%, except lncRNAdisease that shows the overall lowest precision. As deduced from Fig.2, the low number of intersecting genes does not allow a definitive conclusion. However, it is interesting to notice that CLC shows a similar performance to the other databases in terms of sensitivity while increasing specificity. This is likely due to the stringent, function-based inclusion criteria of CLC.
Finally, we assessed the precision (i.e. positive predictive value) of PCAWG lncRNA and protein-coding driver predictions across all cancers and all prediction methods16. Using a q-value cutoff of
0.1, we found that across all cancer types and methods, a total of 8 (8.5%) of lncRNA predictions belong to CLC (Fig. 3b), while a total of 139 (23.1%) of protein-coding predictions belong to CGC (Fig.3c). In terms of sensitivity, 9.8% and 25.1% of CLC and CGC genes are predicted as candidates, respectively. Despite the lower detection of CLC genes in comparison with CGC genes, both sensitivity rates significantly exceed the prediction rate of non-CLC and nonCGC genes (p-value= 0.007 and p-value < 0.001 Fisher’s exact tests, respectively), again highlighting the usefulness of the CLC gene set (Fig.3c).
Liver Colon StomachBreast Lung Neuroepithelial Prostate Esophageal Urothelial Blo od Ov arian Kidne y Pancreas Bone Cer vical Skin Gallb ladder Thyroid Nasopha ryngeal
Head and neck Endomet rial Oral Tongue Cho riocarcinoma Ewing sarcoma Lar ynx Pituita ry PML Retinob lastoma 0 10 20 30 0 10 20 Counts AATBC ADAMTS9−AS2AOC4P AP001631.9APTR BCAR4 CTBP1−ASDBH−AS1 DRAIC EGFLAM−AS1EGFR−AS1 EGOTEpist EWSAT1FAL1 FENDRRFER1L4 HEIH HOXA11−ASLINC00261 LINC00467 LINC00520 LINC00963 LINC00974 LINC00982 LINC01021 LINC01089 LINC01138 LINC01207LINK−A LINP1 lncARSR lncRNA−BGL3lncRNA−EBIC lncTCF7 lncUSMycN LOC728228LUADT1 MIR100HG MONC MT1DPMYU NKILA ODRUL OVAL PCA3 PCAN−R1 PCAN−R2 PCAT18 PCAT29PCAT5 PCGEM1 PINT PRAL PTCSC3RMEL3 RMRP SAMMSONschlap1 SLNCR1 SNHG15 SNHG6 SUZ12P1TCL6 TRPM2−AS TUNARTUSC8 WT1−ASZXF1 CASC15 DLEU1 DLEU2 FOXCUTFTX GAPLINC HOXA−AS2LINC01133 linc−ITGB1 linc−JPH1linc−ROR linc−UBC1LSINCT5 MA−linc1 NBAT−1UCA1 ZEB1−AS1CRNDE DANCRGHET1 HNF1A−AS1HOTAIRM1 MIR31HGNcRAN PlncRNA−1PVT1 SNHG1 TINCR ZFAS1HULC LINC00152 POU3F3TERC TUSC7XIST AFAP1−AS1ANRIL CCAT1 lncRNA−LETPANDAR SOX2OTHOTTIP PCAT−1 lncRNA−ATB BANCR SPRY4−IT1TUG1 NEAT1 GAS5H19 MEG3 MALAT1HOTAIR OG/TSG TSG OG 0 25 50 75 100 125 Counts * * * *
Fig. 1 Overview of the Cancer LncRNA Census. Rows represent the 122 CLC genes, columns represent 29 cancer types. Asterisks next to gene names indicate that they are predicted as drivers by PCAWG, based either on gene or promoter evidence (see Supplementary Data 1). Blue cells indicate evidence for the involvement of a given lncRNA in that cancer type. Left column indicates functional classification: tumour suppressor (TSG), oncogene (OG) or both (OG/TSG). Above and to the right, barplots indicate the total counts of each column/row. The piechart shows the fraction that CLC represents within GENCODE v24 lncRNAs. Note that 8 CLC genes are classified as “pseudogenes” by GENCODE. “nonCLC” refers to all other GENCODE-annotated lncRNAs, which are used as background in comparative analyses.
CLC genes are distinguished by function- and disease-related features. We recently found evidence, using a smaller set of cancer-related LncRNAs (CRLs), that cancer lncRNAs are dis-tinguished by various genomic and expression features indicative of biological function15. We here extended thesefindings using a large series of potential gene features, to search for those features distinguishing CLC from non-CLC lncRNAs (Fig. 4a).
First, associations with expected cancer-related features were tested (Fig.4b). CLC genes are significantly more likely to have
their transcription start site (TSS) within 100 kb of cancer-associated germline SNPs (cancer SNPs 100 kb TSS), and more likely to be either differentially expressed or epigenetically-silenced in tumours49 (Fig. 4b). Intriguingly, we observed a
tendency for CLC lncRNAs to be more likely to lie within 1 kb of known cancer protein-coding genes (CGC 1 kb TSS). While searching for additional evidence of functionality for CLC genes, we found that they are significantly closer to non-cancer, phenotype-associated germline SNPs (non-cancer SNPs 100 kb TSS) in comparison with non-CLC genes (Fig.4b). Proximity to cancer and non-cancer SNPs support the both cancer roles and general biological functionality of CLC genes.
We next investigated the properties of the genes themselves. As seen in Fig.4c, and consistent with our previousfindings15, CLC
genes (gene length) and their spliced products (exonic length) are significantly longer than average. No difference was observed in the ratio of exonic to total length (exonic content), nor overall exon repetitive sequence coverage (repeats coverage), nor GC content.
CLC genes also tend to have greater evidence of function, as inferred from evolutionary conservation. Base-level conservation at various evolutionary depths was calculated for lncRNA exons and promoters (Fig.4d). Across all measures tested, using either average base-level scores or percent coverage by conserved elements, we found that CLC genes’ exons are significantly more conserved than other lncRNAs (Fig.4d). The same was observed for conservation of promoter regions.
High levels of gene expression in normal tissues are known to correlate with lncRNA conservation, and are hypothesized to be a Lnc2cancer CLC Gencode 233 Others 316 105 17 LncRNAdisease CLC Gencode 44 Others 40 37 85 LncRNAdb CLC Gencode 63 Others 81 47 75 A B
CLC Lnc2cancer LncRNAdb LncRNAdisease
N=36,34 N=63,56 N=31,26 N=23,18
% of genes also identified in screen 0.0 2.5 5.0 7.5 CRISPR/Cas-9 screening Liu et al. 2016 N=75 Zhu et al. 2016 N=45 FTX TUG1 ZFAS1 HOTAIR MYU AL121845 FTX TUG1 ZFAS1HOTAIRMYU
TUG1 ZFAS1 HOTAIR TUG1 ZFAS1 HOTAIR p -value=1 p
-value=0.23 p-value=0.14 p-value=1
p -value=1 p -value=0.11 p -value=1 p -value=0.08 SLC44A3-AS1
Fig. 2 Intersection of CLC with public databases. a Proportional Venn diagrams displaying the overlap between CLC set and the three indicated databases. Shown are the total numbers of unique human lncRNAs contained in each intersection (note that for LncRNADisease, numbers refer only to cancer-related genes). Databases are divided into genes that belong to GENCODE v24 annotation and others.b Barplot shows the percent of GENCODE v24 lncRNAs of each database that is present in the final list of cancer lncRNA candidates of two CRISPR/Cas-9 cancer screenings (Liu et al.9and Zhu et al.47).N represents the number of GENCODE v24 lncRNAs from each database that were tested in each of the two CRISPR/Cas-9 screenings. Names of the genes that overlap between the databases and the screenings are shown in each bar.p-values were calculated using Fisher’s exact test.
A B C 0 2 4 6 8 10 0 20 40 60 80 100 ExInAtor q-value < 0.1
Genes ranked by q−value
Percentage of genes in CLC list
ColoRect AdenoCA (n=0/3) Lymph tumors (n=2/5) Pan-cancer (n=3/10) Skin Melanoma (n=1/2) Uterus AdenoCA (n=0/2) Baseline CLC NonCandidate nonCLC 8 74 86 2,519
CLC vs nonCLC PCAWG candidates
Candidate
p-value = 0.007
CGC vs nonCGC PCAWG candidates
CGC NonCandidate nonCGC Candidate 463 139 414 19,156 p-value < 2-2e-16
Fig. 3 CLC as benchmark for cancer driver predictions. a CLC benchmarking of ExInAtor driver lncRNA predictions using PCAWG whole genome tumours atq-value (false discovery rate) cutoff of 0.1. Genes sorted increasingly by q-value are ranked on x-axis. Percentage of CLC genes amongst cumulative set of predicted candidates at each step of the ranking (precision), are shown on they-axis. Black line shows the baseline, being the percentage of CLC genes in the whole list of genes tested. Coloured dots represent the number of candidates predicted under theq-value cutoff of 0.1. “n” in the legend shows the number of CLC and total candidates for each cancer type.b Rate of driver-gene predictions amongst CLC and non-CLC genesets (q-value cutoff of 0.1) by all the individual methods and the combined list of drivers developed in PCAWG.p-value is calculated using Fisher’s exact test for the difference between CLC and non-CLC genesets.c Rate of driver-gene predictions amongst CGC and nonCGC genesets (q-value cutoff of 0.1) by all the individual methods and the combined list of drivers developed in PCAWG.p-value is calculated using Fisher’s exact test for the difference between CGC and nonCGC genesets.
reflection of functionality50. In addition, genes with oncogenic
roles tend to be highly expressed in cancer samples36. We found that CLC has consistently higher steady-state expression levels compared with non-CLC genes across PCAWG tumours (Fig.4e), as well as healthy organs and cultured cell lines (Supplementary Fig. 4). As deduced from proximity to cancer and non-cancer SNPs, high levels of expression in cancer and normal samples reflect important functionality for CLC genes.
Finally, we investigated whether CLC transcripts might be initiated by any types of Transposable Elements (TEs) (see Methods). We found that CLC TSSs are enriched for one category,“Simple repeats” (Supplementary Fig. 5).
Evidence for genomic clustering of non-coding and protein-coding cancer genes. In light of recent evidence for colocalisation and coexpression of disease-related lncRNAs and protein-coding
Features FEATURE 3 FEATURE 4 FEATURE 2 FEATURE 1 Feature of study CLC noCLC mean mean CLC mean nonCLC mean
(
)
Log2 Fold Difference * Statistical significance * Fold Difference Wilcoxon test F old Diff erence (CLC vs nonCLC mean) (Log2)
Conservation
Phastc mean(100 vertebrates) Phastc mean (20 mammals)
Elements (100 vertebrates)Elements (7 vertebrates)Elements (20 mammals)
Elements (100 vertebrates) Elements (7 vertebrates) Elements (20 mammals)
Phastc mean(7 vertebrates)
Phastc mean (100 vertebrates)Phastc mean (20 mammals) Phastc mean (7 vertebrates)
0.0 0.5 1.0 1.5 0 2 4 6 8 a a Exons Promoters -Log10 p-value F old Diff
erence (CLC vs nonCLC mean) (Log2)
Tumour RNAseq
-Log10 p-value
B
C
D
E
-Log10 p-value
Odds Ratio (CLC vs nonCLC) (Log2)
Cancer Association −0.5 0.0 0.5 1.0 1.5 2.0 0 5 10 15 20 25 F o ld Diff e
rence (CLC vs nonCLC mean) (Log2)
Sequence Properties -Log10 p-value Gene length Exonic length GC content (Gene) GC content (Exons) Exonic content Repeats coverage
A
Cancer associated epigenetically silenced lncRNA genes
Differentially expressed genes Cancer SNPs 10kb TSS Cancer SNPs 100kb TSS Noncancer SNPs 1kb TSS Cancer SNPs 1kb TSS Noncancer SNPs 100kb TSS CGC 1kb TSS Noncancer SNPs 10kb TSS 0 2 4 0 5 10 15 a a a COSMIC GWAS Catalog Yan et al. paper
Biliar y−AdenoCABladder−TCC Bone−Leio my o Breast−AdenoCa Breast−Lo bularCa Cer vix−SCC ColoRect−AdenoCA Eso−AdenoCa Head−SCC Kidn ey−RCC Liver−HCC Lung−AdenoCA Lung−SCC Ova ry−AdenoCA Panc−AdenoCA Prost−AdenoCA Skin−Melanoma Stomach−AdenoCA Ute rus−AdenoCA CNS−GBM Lymph−CLL Lymph−NOS Thy−AdenoCA CNS−Oligo Kidn ey−ChRCC Lymph−BNHL 0 2 4 6 0 5 10
Fig. 4 Distinguishing features of CLC genes. a Panel showing a hypothetic feature analysis example to illustrate the content of the followingfigures. All panels in thisfigure display features (dots), plotted by their log-fold difference (odds ratio in case of panel (b)) between CLC/non-CLC genesets (y-axis) and statistical significance (x-axis). In all plots dark and light green dashed lines indicate 0.05 and 0.01 significance thresholds, respectively. b Cancer and non-cancer disease-related data from indicated sources:y-axis shows the log2 of the odds ratio obtained by comparing CLC to non-CLC by Fisher’s exact test;x-axis displays the estimated p-value from the same test. “CGC 1 kb TSS” refers to the fraction of genes that have a nearby known CGC cancer protein-coding gene. This is explored in more detail in the next Figure.“Non-cancer SNPs” refers to GWAS SNPs associated with diseases/traits other than cancer. c Sequence and gene properties:y-axis shows the log2 fold difference of CLC/non-CLC means; x-axis represents the p-value obtained. d Evolutionary conservation:“Phastc mean” indicates average base-level PhastCons score; “Elements” indicates percent coverage by PhastCons conserved elements (see Methods). Colours distinguish exons (blue) and promoters (purple).e Tumour RNA-seq: expression levels of lncRNA genes in different cancer tissues obtained from RNA-seq expression data from PCAWG. For (b–d), statistical significance was calculated using Wilcoxon test.
genes51, we were curious whether such an effect holds for
cancer-related lncRNAs and protein-coding genes. We asked, more specifically, whether CLC genes tend to be closer to CGC genes than expected by chance, and whether this is manifested in a more co-regulated expression.
To this aim, we computed TSS-TSS distances from lncRNAs to protein-coding genes and we found that CLC genes on average tend to lie moderately closer to protein-coding genes of all types, compared with non-CLC lncRNAs (Supplementary Fig. 6A, B). Since CLC genes are enriched for functional features (i.e. expression and conservation), we could not rule out the possibility that proximity to protein-coding genes is a feature of functional lncRNAs rather than cancer lncRNA genes. In order to further investigate this possibility, we repeated the analysis dividing the non-CLC set into potentially functional non-CLC genes (PF-non-CLC) (non-CLC genes sampled to match CLC expression and conservation, N= 149, Supplementary Fig. 7) and “other nonCLC” (the rest of non-CLC). Interestingly, when comparing distances to any type of protein-coding genes, both CLC and PF-non-CLC are significantly closer than the rest of lncRNA (Wilcoxon test, p-value = 0.03 and 0.007, respectively), being the PF-non-CLC genes the closest ones (median 21.9, 29 and 37.8 kb, for PF-non-CLC, CLC and other non-CLC, respectively) (Supplementary Fig. 6C). However, when assessing specifically for distance to CGC genes, only CLC set is significantly closer than the rest of lncRNAs (Wilcoxon test, p-value= 0.0008) and it represents the group with the lowest distance (median 1122, 1330 and 1607 kb for CLC, PF-non-CLC and other PF-non-CLC, respectively) (Fig. 5a). Thus, although proximity to protein-coding genes seems to be a feature of potentially functional lncRNAs, CLC genes are closer to cancer genes compared with other lncRNAs with similar function-like properties.
It has been widely proposed that proximal lncRNA/protein-coding gene pairs are involved in cis-regulatory relationships, which is reflected in expression correlation52. We next asked
whether proximal CLC-CGC pairs exhibit this behaviour. An important potential confounding factor, is the known positive correlation between nearby gene pairs53, and this must be
controlled for. Using gene expression data across 11 human cell lines, we observed a positive correlation between CLC-CGC gene pairs for each cell type (Fig. 5b). To control for the effect of proximity on correlation, we next randomly sampled a similar number of non-CLC lncRNAs with matched distances (TSS-TSS) from the same CGC genes, and found that this correlation was lost (Fig.5b,“nonCLC-CGC”). To further control for a possible correlation arising from the simple fact that both CGC and CLC genes are involved in cancer, and CLC genes are in general enriched for conservation and expression, we next randomly shuffled the CLC-CGC pairs 1000 times, again observing no correlation (Fig.5b,“Shuffled CLC-CGC”). Together these results show that genomically proximal protein-coding/non-coding gene pairs exhibit an expression correlation that exceeds that expected by chance, even when controlling for genomic distance.
These results prompted us to further explore the genomic localization of CLC genes relative to their proximal protein-coding gene and the nature of their neighbouring genes. Next, we observed an unexpected difference in the genomic organisation of CLC genes: when classified by orientation with respect to nearest protein-coding gene5, we found a significant enrichment of CLC
genes immediately downstream and on the same strand as protein-coding genes (“Samestrand, pc up”, Fig. 5c). Moreover, CLC genes are approximately twice as likely to lie in an upstream, divergent orientation to a protein-coding gene (“Divergent”, Fig.5c). Of these CLC genes, 20% are divergent to a CGC gene, compared with 5% for non-CLC genes (p-value= 0.018, Fisher’s exact test) (Fig.5d), and several are divergent to protein-coding
genes that have also been linked or defined to be involved in cancer, despite not being classified as CGCs (Supplementary Data 2).
Given this noteworthy enrichment of CGC genes among the divergent protein-coding genes of the CLC set, we next inspected the functional annotation of those protein-coding genes. Examining their Gene Ontology (GO) terms, molecular pathways and other gene function related terms, we found this group of genes to be enriched in GO terms for “sequence-specific DNA binding”, “DNA binding”, “tube development” and “transcrip-tional misregulation in cancer” (Fig.5e and Supplementary Data 3), contrary to the GO terms of the divergent protein-coding genes of the non-CLC set (Supplementary Data 4). These results were confirmed by another, independent GO-analysis suite (see Methods). Interestingly, three out of the top four functional groups were observed previously in a study of protein-coding genes divergent to long upstream antisense transcripts in primary mouse tissues54.
Thus, CLC genes appear to be non-randomly distributed with respect to protein-coding genes, and particularly their CGC subset.
Evidence for anciently conserved cancer roles of lncRNAs. In mouse, numerous studies have employed unbiased forward genetic screens to identify genes that either inhibit or promote tumorigenesis55. These studies use engineered, randomly-integrating transposons carrying bidirectional polyadenylation sites as well as strong promoters. Insertions, or clusters of insertions, called “common insertion sites” (CIS) that are iden-tified in sequenced tumour DNA, are assumed to act as driver mutations55, and thereby implicate the overlapping or
neigh-bouring gene locus as either an oncogene or tumour-suppressor gene. Although these studies have traditionally been focused on identifying protein-coding driver genes, they can in principle also identify non-coding RNA driver loci55.
We thus reasoned that comparison of mouse CISs to orthologous human regions could yield independent evidence for the functionality of human cancer lncRNAs (Fig.6a). To test this, we collected a comprehensive set of CISs in mouse56, consisting of 2906 loci from seven distinct cancer types (Supplementary Data 5). These sites were then mapped to orthologous regions in the human genome, resulting in 1301 non-overlapping human CISs, or hCISs. 6.9% (90) of these CISs lie outside of protein-coding gene boundaries.
Mapping hCISs to lncRNA annotations, we discovered altogether eight CLC genes (6.6%) carrying at least one insertion within their gene span: DLEU2, GAS5, MONC, NEAT1, PINT, PVT1, SLNCR1, XIST (Table1). Two cases, DLEU2 and MONC, each have two independent hCIS sites. In contrast, just 64 (0.4%) non-CLC lncRNAs contained hCISs (Fig.6b). A good example is SLNCR1, shown in Fig.6c, which drives invasiveness of human melanoma cells57, and whose mouse orthologue contains a CIS
discovered in pancreatic cancer. It is noteworthy that no hCIS was found to overlap MALAT1 despite its being amongst the most widely-studied cancer lncRNAs14. This agrees with the lack
of strong phenotypic effects when deleting this gene in mouse models, as discussed in the Introduction21–23. We examined the
possibility that hCIS insertions in these CLC genes could in fact be caused by nearby, protein-coding cancer genes. However, none of these eight CLC genes are within 100 kb of a CGC gene, with the exception of PVT1 lncRNA, lying 58 kb from c-MYC oncogene.
This analysis would suggest that CLC genes are enriched for hCISs; however, there remains the possibility that this is confounded by their greater length and possible overlap with
protein-coding genes. To account for this, we only selected hCIS elements that do not overlap protein-coding regions (90 hCIS) and we performed two separate validations using only regions that do not overlap protein-coding genes from the CLC and non-CLC genesets. First, groups of non-non-CLC genes with non-CLC-matched length were randomly sampled, and the number of intersecting hCISs per unit gene length (Mb) was counted (Supplementary
Fig. 8A). Second, CLC genes were randomly relocated in the genome, and the number of genes intersecting at least one hCIS was counted (Supplementary Fig. 8B). Both analyses showed that the number of intersecting hCISs per Mb of CLC gene span is far greater than expected in comparison with both non-CLC genes (Supplementary Fig. 8A) and intergenic space (nucleotides that do not overlap neither lncRNAs neither protein-coding genes)
A
B
C
D
E
D
0.0 0.1 0.2 0.3 Samestrand, Linc up Divergent Samestrand, pc upConvergentIntronic ASIntronic SSExonic ASExonic SSIntergenic
Frequency Genomic Classification 20 5 11 3 8 3 19 43 2 < 10kb distance Overlapping >10kb p-value = 0.004 Type CLC nonCLC 0 5 10 15 20 % of CGC genes 1222 divergent lncRNAs 4 CGC 61 CGC 0.0 0.5 1.0 CLC −CGC nonCLC −CGC Shuffled CLC −CGC
Genes correlation within cells
11 cells 11 cells 11 cells 1000 times Correlation p-value = 0.02 p-value = 0.04 ncRNA C GC 20 CLC 1202 nonCLC p-value = 0.0004 p -value = 0.01 CGC gene TSS-TSS Distance LncRNA < 10kb Divergent gene LncRNA Cum u lativ e percentage 0.25 0.50 0.75 1.00 4 5 6 7
Log10 distance to closest CGC gene TSS
Median=1,607 kb Median=1,122 kb Median=1,330 kb CLC other nonCLC PF-nonCLC 0.00 7 5 4 4 11 9 3 3 3 3 3 0 1 2 3 Enrichment 0.3 0.4 0.5 0.6 0.7
Morphogenesis of a branching epithelium Hypoplastic heart Tube morphogenesis Abnormal lung lobation Congenital malformation of the left heart Hypoplastic left heart Branching morphogenesis of an epithelial tube DNA binding Transcriptional misregulation in cancer Tube development Sequence−specific DNA binding
−Log10 p-Value 20 pc-genes divergent to CLC Enr ichment 0.3 0.4 0.5 0.6 0.7 < 10kb distance Same Strand Divergent Convergent Overlapping Same Sense (SS) Antisense (AS) > 10kb distance Intergenic
(Supplementary Fig. 8B). Interestingly, non-CLC genes also show an enrichment for hCIS sites in comparison with intergenic regions (Supplementary Fig. 8C), suggesting that more cancer lncRNAs remain to be discovered.
We further compared the enrichment of hCIS in protein-coding genes, lncRNA genes and other intergenic space. Compared with the genomic space they occupy, there is a clear enrichment of hCIS elements in both protein-coding CGC genes, as well as CLC lncRNAs (Fig.6d). Expressed as insertion rate per megabase of gene span, it is clear that CLC genes are targeted more frequently than background intergenic DNA and non-cancer-related lncRNA genes. Of note are the non-background insertion rates for non-cancer-related protein-coding (nonCGC) and lncRNA genes (non-CLC), suggesting that there remain substantial numbers of undiscovered cancer genes in both groups. Together these analyses demonstrate that CLC genes are orthologous to mouse cancer-causing genomic loci at a rate greater than expected by random chance. These identified cases, and possibly other CLC genes, display cancer functions that have been conserved over tens of millions of years since human-rodent divergence.
Discussion
We have presented the Cancer LncRNA Census, the first con-trolled set of GENCODE-annotated lncRNAs with demonstrated roles in tumorigenesis or cancer phenotypes.
The present state of knowledge of lncRNAs in cancer, and indeed lncRNAs generally, remains incomplete. Consequently, our aim was to create a gene set with the greatest possible con-fidence, by eliminating the relatively large number of published cancer lncRNAs with as-yet unproven functional roles in disease processes. Thus, we defined cancer lncRNAs as those having direct experimental or genetic evidence supporting a causative role in cancer phenotypes. By this measure, gene expression changes alone do not suffice. By introducing these well-defined inclusion criteria, we hope to ensure that CLC contains the highest possible proportion of bona fide cancer genes, giving it maximum utility for de novo predictor benchmarking. In addi-tion, its basis in GENCODE ensures portability across datasets and projects. Inevitably some well-known lncRNAs did not meet these criteria (including SRA1, CONCR, KCNQ1OT1)42–44; these
may be included in future when more validation data becomes available. We believe that CLC will complement the established lncRNA databases such as lncRNAdb, LncRNADisease and Lnc2Cancer, which are more comprehensive, but are likely to have a higher false-positive rate due to their more relaxed inclusion criteria26,39,40.
De novo lncRNA driver-gene discovery is likely to become increasingly important as the number of sequenced tumours grow. The creation and refinement of statistical methods for driver-gene discovery will depend on the available of high-quality
true-positive genesets such as CLC. It will be important to con-tinue to maintain and improve the CLC in step with anticipated growth in publications on validated cancer lncRNAs. Very recently, CRISPR-based screens9,47 have catalogued large num-bers of lncRNAs contributing to proliferation in cancer cell lines, which will be incorporated in future versions.
We used CLC to estimate the performance of de novo driver lncRNA predictions from the PCAWG project, made using the ExInAtor pipeline15. Supporting the usefulness of this approach,
we found an enrichment for CLC genes amongst the top-ranked driver predictions. Extending this to the full set of PCAWG driver predictors, approximately ten percent of CLC genes (9.8%) are called as drivers by at least one method16, which is lower to the
rate of CGC genes identified (25.1%).
The low rate of concordance between de novo predictions and CLC genes may be due to technical or biological factors. Indeed, it is important to state that we do not yet know whether CLC holds “cancer driver” lncRNAs, and indeed, how many such genes exist. In principle, lncRNAs may play two distinct roles in cancer:first, as driver genes, defined as those whose mutations are early and positively-selected events in tumorigenesis; or second, as “downstream genes”, which do make a genuine contribution to cancer phenotypes, but through non-genetic alterations in cellular networks resulting from changes in expression, localisation or molecular interactions. These downstream genes may not display positively-selected mutational patterns, but would be expected to display cancer-specific alterations in expression. A key question for the future is how lncRNAs break down between these two categories, and the utility of CLC in benchmarking de novo driver predictions will depend on this. However, the identification of lncRNAs whose silencing or overexpression is sufficient for tumour formation in mouse, would seem to suggest that they are true“driver genes”.
Analysis of the CLC gene set has broadened our understanding of the unique features of cancer lncRNAs, and generally supports the notion that lncRNAs have intrinsic biological functionality. Cancer lncRNAs are distinguished by a series of features that are consistent with both roles in cancer (e.g. tumour expression changes), and general biological functionality (e.g. high expres-sion, evolutionary conservation). Elevated evolutionary con-servation in the exons of CLC genes would appear to support their functionality as a mature RNA transcript, in contrast to the act of their transcription alone58. Another intriguing observation has been the colocalisation of cancer lncRNAs with known protein-coding cancer genes: these are genomically proximal and exhibit elevated expression correlation. This points to a regulatory link between cancer lncRNAs and protein-coding genes, perhaps through chromatin looping, as described in previous reports for CCAT1 and MYC, for example59.
One important caveat for all features discussed here is ascer-tainment bias: almost all lncRNAs discussed have been curated Fig. 5 Evidence for genomic clustering of non-coding and protein-coding cancer genes. a Cumulative distribution of the genomic distance of lncRNA transcription start site (TSS) to the closest Cancer Gene Census (CGC) (protein-coding) gene TSS. LncRNAs are divided into CLC (n = 122), potentially functional non-CLC genes (PF-non-CLC) (n = 149), and other non-CLC genes (n = 15,678). b Boxplot shows the distribution of the gene expression correlation between CLC and their closest CGC genes in 11 human cell lines, including two control analyses (distance-matched non-CLC-CGC pairs, and shuffled CLC-CGC pairs). Correlation was calculated for gene pairs within each cell type, using Pearson method. p-value for Kolmogorov–Smirnov test is shown.c Genomic classification of lncRNAs. Genes are classified according to distance and orientation to the closest protein-coding gene, and these are grouped into three categories: genes closer than 10 kb to closest protein-coding gene, genes overlapping a protein-coding gene and intergenic genes (>10 kb from closest protein-coding gene).p-values for Fisher’s exact tests are shown. d The percentage of divergent CLC (left bar) and non-CLC (right bar) genes divergent to a cancer protein-coding gene (CGC). Numbers represent numbers of genes with which the percentage is calculated.p-value for Fisher’s exact test is shown. e Functional annotations of the 20 protein-coding genes (pc-genes) divergent to CLC genes from panel (c). Bars indicate the –log10 (corrected) p-value (see Methods) and are coloured based on the “enrichment”: the number of genes that contain the functional term divided by the total number of queried genes. Numbers at the end of the bars correspond to the number of genes that fall into the category.
from published, single-gene studies. It is entirely possible that selection of genes for initial studies was highly non-random, and influenced by a number of factors—including high expression, evolutionary conservation and proximity to known cancer genes— that could bias our inference of lncRNA features. This may be the explanation for the observed excess of cancer lncRNAs in divergent configuration to protein-coding genes. However, the general
validity of some of the CLC-specific features described here— including high expression and evolutionary conservation—were also observed in recent unbiased genome-wide screens9,15,
sug-gesting that they are genuine.
Despite the relatively low concordance of CLC genes with PCAWG driver predictions, the results of this study strongly support the value and key cancer role of identified lncRNAs in Scale
chr17:
200 kb hg38
72,150,000 72,200,000 72,250,000 72,300,000 72,350,000 72,400,000 72,450,000 72,500,000 72,550,000 72,600,000 72,650,000 Basic Gene Annotation Set from GENCODE Version 24 (Ensembl 83)
SOX9-AS1 SOX9-AS1 SOX9-AS1 SOX9-AS1 AC007461.2 SOX9-AS1 SOX9-AS1 SOX9-AS1 SOX9 SOX9-AS1 SOX9-AS1 LINC00511 RP11-1124B17.1 LINC00511 LINC00511 LINC00511 LINC00511 RP11-57A1.1 LINC00511 CTD-3010D24.3 SLC39A11 SLC39A11 RN7SKP180 Scale chr11: hCIS 200 kb mm10 112,800,000 112,850,000 112,900,000 112,950,000 113,000,000 113,050,000 113,100,000 113,150,000 113,200,000 113,250,000 Basic Gene Annotation Set from ENCODE/GENCODE Version M11 (Ensembl 86)
CCGD clusters Sox9 Gm11681 4933434M16Rik 2610035D17Rik 2610035D17Rik 4732490B19Rik Slc39a11 Slc39a11 Slc39a11 Human hg38 Mouse mm10 SLNCR1 CLC Not OverlapOverlap
nonCLC
8
114 15,763
CLC and hCIS loci
p-value = 7.39e-08 64
C
A
B
LncRNA Insertional mutagenesis hotspot Chain alignment Cancer phenotypeE
10 32 148 1,063 48 0.0 0.5 1.0 1.5 2.0 2.5CLC nonCLC CGC nonCGC intergenic
hCIS / Mb Gene type CLC nonCLC CGC nonCGC intergenic 0.00 0.25 0.50 0.75 1.00 0.2% 2.0% 8.9% 39.1% 49.8% 0.8% 2.5% 3.7% 11.4% 81.7% 1,063 148 48 10 32
D
Gene type CLC nonCLC CGC nonCGC intergenic hCIS Density Number of basepairs (as proportion of whole genome) hCIS elements ProportionFig. 6 Evidence for ancient conserved cancer roles of lncRNAs. a Functional conservation of human CLC genes was inferred by the presence of Common Insertion Sites (CIS), identified in transposon-mutagenesis screens, at orthologous regions in the mouse genome. Orthology was inferred from Chain alignments and identified using LiftOver utility. b Number of CLC and non-CLC genes that contain human orthologous common insertion sites (hCIS) (see Table1). Significance was calculated using Fisher’s exact test. c UCSC browser screenshot of a CLC gene (SLNCR1, ENSG00000227036) intersecting a CIS (yellow arrow).d Number of basepairs and number of overlapping hCIS for cancer driver protein-coding genes (CGC), non-cancer driver protein-coding genes (nonCGC), cancer-related lncRNAs (CLC), rest of GENCODE lncRNAS (non-CLC) and the rest of the genome that do not overlap any of the previous element types (intergenic). Arrows indicate the number of hCIS and the percentage for each element type.e Number of overlapping hCIS per megabase of genomic span for each gene class.
cancer. Most notably, the existence of a core set of eight lncRNAs with independently-identified mouse orthologues with similar cancer functions, is a powerful evidence that these genes are bona fide cancer genes, whose overexpression or silencing can drive tumour formation. To our knowledge this is the most direct demonstration to date of anciently conserved functions and dis-ease roles for lncRNAs. It will be intriguing to investigate in future whether more human-mouse orthologous lncRNAs have been identified in such screens.
Methods
Manual curation. All lncRNAs in lncRNAdb and those listed in Schmitt and Chang’s recent review article were collected26,60. To these were added all cases from
LncRNADisease and Lnc2Cancer databases39,40. This primary list formed the basis
for a manual literature search: all available publications for each gene were iden-tified by keyword search in PubMed. If publications were found conforming to at least one of the inclusion criteria (below) and the gene has a GENCODE ID, then it was added to CLC, with appropriate information on the associated cancer, biolo-gical activity. For the numerous cases where no GENCODE ID was supplied in the original publication, any available ID, or primer or siRNA sequence was used to identify the gene using the UCSC Genome Browser Blat tool61.
Inclusion criteria sufficient to define a cancer lncRNA and link it to a cancer type were
Class t: In vitro demonstration that their knockdown and/or overexpression in cultured cancer cells results in changes to cancer-associated phenotypes. These typically include proliferation rates, migration, sensitivity to apoptosis, or anchorage-independent growth.
Class v: In vivo demonstration that their knockdown and/or overexpression in cancer cells alters their tumorigenicity when injected into animal models.
Class g: Germline mutations or variants that predispose humans to cancer. Class s: Somatic mutations that show evidence for positive selection during tumour formation.
An additional criterion was allowed to link an lncRNA to a cancer type, only if at least one of the above criteria was already met for another cancer:
Class p: Prognosis, the lncRNAs expression is statistically linked to disease progression or response to treatment.
If an lncRNA was found to promote tumorigenesis or cancer phenotype, it was defined as “oncogene”. Conversely those found to inhibit such phenotypes were defined as “tumour suppressor”. Several lncRNAs were found to have both activities recorded in different cancer types, and were given both labels. For every lncRNA-cancer association, a single representative publication is recorded. Finally, it is important to note that no lncRNAs were included based on evidence from previous driver-gene discovery studies of the types represented by OncodriveFML, ExInAtor, ncdDetect or others described in PCAWG15,16,34,62.
CLC set at this stage relies on GENCODE v24 annotation, and therefore all CLC genes have a GENCODE v24 ID assigned. However, data relative to GENCODE v24 was not available for all types of data and analyses used in this study (i.e. all data relative to PCAWG is based on GENCODE v19). Thus, for some analyses only genes also present in GENCODE v19 could be used (specified in the corresponding methods sections) and the total number of genes analyzed in these cases is slightly lower (107 instead of 122 CLC genes and 13,503 instead of 15,827 non-CLC). LncRNA and coding driver prediction analysis. LncRNA and protein-coding predictions for ExInAtor and the rest of PCAWG methods, as well as the combined list of drivers, were extracted from the consortium database16.
Para-meters and details about each individual methods and the combined list of drivers
can be found on the main PCAWG driver publication16and false discovery rate
correction was applied on each individual cancer type for each individual method in order to define candidates (q-value cutoffs of 0.1 and 0.2, specified in the corresponding sections). This way, we combined the predicted candidates of each individual method in each individual cancer type (including pan-cancer). To cal-culate sensitivity (percentage of true positives that are predicted as candidates) and precision (percentage of predicted candidates that are true positives) for lncRNA and protein-coding predictions we used the CLC and CGC (COSMIC v78, downloaded 3 October 2016) sets, respectively. To assess the statistical significance of sensitivity rates, we used Fisher’s exact test.
Feature identification. We compiled several quantitative and qualitative traits of GENCODE lncRNAs and used them to compare CLC genes to the rest of lncRNAs (referred to as“non-CLC”). Analysis of quantitative traits were performed using Wilcoxon test while qualitative traits were tested using Fisher' exact test. These methods principally refer to Figs.4and5as well as Supplementary Figs. 4, 5, 6 and 7.
Cancer SNPs: On 4 October 2016, we collected all 2192 SNPs related to “cancer”, “tumour” and “tumor” terms in the NHGRI-EBI Catalog of published genome-wide association studies63,64(https://www.ebi.ac.uk/gwas/home). Then we
calculated the closest SNP to each lncRNA TSS using closest function from Bedtools v2.1965(GENCODE v24).
Non-cancer SNPs: On 31 July 2017, we collected all 29,813 SNPs not related to “cancer”, “tumour” and “tumor” terms in the NHGRI-EBI Catalog of published genome-wide association studies63,64(https://www.ebi.ac.uk/gwas/home). Then we
calculated the closest SNP to each lncRNA TSS using closest function from Bedtools v2.1965(GENCODE v24).
Epigenetically-silenced lncRNAs: We obtained a published list of 203 cancer-associated epigenetically-silenced lncRNA genes present in GENCODE v2449.
These candidates were identified due to DNA methylation alterations in their promoter regions affecting their expression in several cancer types.
Differentially expressed in cancer: We collected a list of 3533 differentially expressed lncRNAs in cancer compared with normal samples49(GENCODE v24).
Sequence/gene properties: Exonic positions of each gene were defined as the the union of exons from all its transcripts. Introns were defined as all remaining non-exonic nucleotides within the gene span. Repeats coverage refers to the percent of exonic nucleotides of a given gene overlapping repeats and low complexity DNA sequence regions obtained from RepeatMasker data housed in the UCSC Genome Browser66. Exonic content refers to the fraction of total gene span covered by
exons. For this section we used GENCODE v19.
Evolutionary conservation: Two types of PhastCons conservation data were used: base-level scores and conserved elements. These data for different multispecies alignments (GRCh38/hg38) were downloaded from UCSC genome browser66. Mean scores and percent overlap by elements were calculated for exons
and promoter regions (GENCODE v24). Promoters were defined as the 200 nt region centred on the annotated gene start.
Expression: We used polyA+RNA-seq data from 10 human cell lines produced by ENCODE67,68, from various human tissues by the Illumina Human Body Map
Project (HBM) (www.illumina.com; ArrayExpress ID: E-MTAB-513), and from cancer samples from PCAWG RNA-seq expression data16. In this last case, for
each cancer type we computed the expression mean of genes across all RNA-seq samples belonging to that cancer type (GENCODE v19).
Transposable elements: We downloaded 5,520,016 transposable elements from the UCSC table browser69on 3 August 2017. We separated them by element types
and counted how many of them intersected or not with the transcription start sites of CLC and non-CLC genes, in order to detect any association with the Fisher' exact test.
Distance to protein-coding genes and CGC genes: For each lncRNA we calculated the TSS to TSS distance to the closest protein-coding gene (GENCODE
Table 1 List of intergenic CIS human (GRCh38)/mouse (GRCm38) gene pairs.
Human CLC name
Human CLC ID Chr human Start human End human Chr mouse Start mouse End mouse PubMed ID Cancer type mouse DLEU2 ENSG00000231607 chr13 50,048,971 50,049,063 chr14 61,631,880 61,631,972 24316982 Liver DLEU2 ENSG00000231607 chr13 50,049,117 50,049,206 chr14 61,632,026 61,632,110 24316982 Liver GAS5 ENSG00000234741 chr1 173,864,370 173,864,435 chr1 161,038,091 161,038,156 25961939 Sarcoma MONC ENSG00000215386 chr21 16,539,096 16,539,161 chr16 77,598,935 77,599,000 23685747 Nervous System MONC ENSG00000215386 chr21 16,561,654 16,561,655 chr16 77,616,439 77,616,440 24316982 Liver
NEAT1 ENSG00000245532 chr11 65,444,511 65,444,512 chr19 5,825,497 5,825,498 24316982 Liver PINT ENSG00000231721 chr7 131,049,455 131,049,456 chr6 31,179,149 31,179,150 22699621 Pancreatic PVT1 ENSG00000249859 chr8 128,007,970 128,007,971 chr15 62,186,646 62,186,647 22699621 Pancreatic SLNCR1 ENSG00000227036 chr17 72,507,275 72,507,276 chr11 113,137,613 113,137,614 22699621 Pancreatic XIST ENSG00000229807 chrX 73,841,539 73,841,540 chrX 103,473,862 103,473,863 24316982 Liver
v24) or CGC gene (downloaded on 3 October 2016 from Cosmic database)31using
closest function from Bedtools v2.1965. In order to divide non-CLC genes into
potentially functional non-CLC (PF-non-CLC) and others, we sampled the list of all non-CLC genes to get a subsample that has a matched distribution to CLC genes in conservation (% of conserved elements, from Vertebrate Multiz Alignment 100 Species from UCSC genome browser data, in exonic regions). Then we sampled again the resulting subset to get afinal subset that also matches CLC genes in terms of expression (median of expression across 16 human tissues, data from Illumina Human Body Map Project (HBM)). To create the non-CLC samples we used the matchDistribution script:https://github.com/julienlag/matchDistribution.
Coexpression with closest CGC gene: We took CLC-CGC gene pairs whose TSS-TSS distance was <200 kb. RNA-seq data from 11 human cell lines from ENCODE was used to assess expression levels67,68. ENCODE RNA-seq data were
obtained from ENCODE Data Coordination Centre (DCC) in September 2016,
https://www.encodeproject.org/matrix/?type=Experiment. All data is relative to GENCODE v24. We calculated the expression correlation of gene pairs within each of the
11 cell lines, using the Pearson measure. To control for the effect of proximity, we randomly sampled a subset of non-CLC-CGC pairs matching the same TSS-TSS distance distribution as above, and performed the same expression correlation analysis (“non-CLC-CGC”). Finally, to further control for the fact that CLC and CGC are both cancer genes, which may influence their expression correlation, we shuffled CLC-CGC pairs 1000 times, and tested expression correlation for each set (“Shuffled CLC-CGC”).
Genomic classification: We used an in-house script ( https://github.com/gold-lab/shared_scripts/tree/master/lncRNA.annotator) to classify lncRNA transcripts into different genomic categories based on their orientation and proximity to the closest protein-coding gene (GENCODE v24): a 10 kb distance was used to distinguish“genic” from “intergenic” lncRNAs. When transcripts belonging to the same gene had different classifications, we used the category represented by the largest number of transcripts.
Functional enrichment analysis: The list of protein-coding genes (GENCODE v24) that are divergent and closer than 10 kb to CLC genes (or non-CLC) was used for a functional enrichment analysis (20 unique genes in the case of CLC analysis and 1202 in the case of non-CLC analysis). We show data obtained using g:Profiler web server70, g:GOSt, with default parameters for functional enrichment analysis of
protein-coding genes divergent to CLC and using Bonferroni correction for protein-coding gene divergent to non-CLC. For CLC analysis we performed the same test with independent methods: Metascape (http://metascape.org)71and
GeneOntoloy (Panther classification system)72,73. In both cases similar results
were found.
Mouse mutagenesis screen analysis. We extracted the genomic coordinates of transposon common insertion sites (CISs) in Mouse (GRCm38/mm10)http:// ccgd-starrlab.oit.umn.edu/about.php56. This database contains target sites identi-fied by transposon-based forward genetic screens in mice. LiftOver61was used at
default settings to obtain aligned human genome coordinates (hCISs) (GRCh38/ hg38). We discarded hCIS regions longer than 1000 nucleotides for all the analyses; and also those that overlap protein-coding genes (except for Fig.6b). The remainders (90 hCISs) were intersected with the genomic coordinates of CLC and non-CLC genes that do not overlap protein-coding genes.
To correctly assess the statistical enrichment of CLC in hCIS regions, we performed two control analyses:
Length-matched sampling: To calculate if the enrichment of hCIS intersecting genes in CLC set is higher and statistically different from non-CLC set, while controlling by gene length, we created 1000 samples of non-CLC genes with the same gene length distribution as CLC genes. Each sample was intersected with hCIS, and the number of intersecting hCISs per Mb of gene length was calculated. To create the non-CLC samples we used the matchDistribution script:https:// github.com/julienlag/matchDistribution. Finally, we calculated an empirical p-value by counting how many of the simulated non-CLC enrichments were higher or equal than the real CLC value.
Randomly repositioning of CLC and non-CLC genes: We randomly relocated CLC/non-CLC genes 10,000 times within the non-protein-coding regions of the genome using the tool shuffle from BedTools v1965. In each iteration, we calculated
the number of genes that intersected at least one hCIS, and created the distribution of these simulated values. Finally, we calculated an empirical p-value by counting how many of the simulated values were higher or equal than the real values. This analysis was performed separately for CLC and non-CLC genes.
Reporting summary. Further information on research design is available in the Nature Research Reporting Summary linked to this article.
Data availability
The data reported in this study are summarized in the manuscript and its Supporting Informationfiles. The list of CLC genes are also available from the GOLD Lab website (https://www.gold-lab.org/clc). Somatic and germline variant calls, mutational signatures, subclonal reconstructions, transcript abundance, splice calls and other core data generated by the ICGC/TCGA Pan-cancer Analysis of Whole Genomes Consortium is
described here38and available for download athttps://dcc.icgc.org/releases/PCAWG.
Additional information on accessing the data, including raw readfiles, can be found at
https://docs.icgc.org/pcawg/data/. In accordance with the data access policies of the ICGC and TCGA projects, most molecular, clinical and specimen data are in an open tier which does not require access approval. To access potentially identification information, such as germline alleles and underlying sequencing data, researchers will need to apply to the TCGA Data Access Committee (DAC) via dbGaP (https://dbgap.ncbi.nlm.nih.gov/ aa/wga.cgi?page=login) for access to the TCGA portion of the dataset, and to the ICGC Data Access Compliance Office (DACO;http://icgc.org/daco) for the ICGC portion. In addition, to access somatic single nucleotide variants derived from TCGA donors, researchers will also need to obtain dbGaP authorisation.
Code availability
Custom code are available from the corresponding author upon request. The core computational pipelines used by the PCAWG Consortium for alignment, quality control and variant calling are available to the public athttps://dockstore.org/search? search=pcawgunder the GNU General Public License v3.0, which allows for reuse and distribution.
Received: 23 March 2018; Accepted: 31 August 2018;
References
1. Yates, L. R. & Campbell, P. J. Evolution of the cancer genome. Nat. Rev. Genet. 13, 795–806 (2012).
2. Guttman, M. et al. Chromatin signature reveals over a thousand highly conserved large non-coding RNAs in mammals. Nature 458, 223–7 (2009). 3. Jia, H. et al. Genome-wide computational identification and manual
annotation of human long noncoding RNA genes. RNA 16, 1478–87 (2010). 4. Cabili, M. N. et al. Integrative annotation of human large intergenic
noncoding RNAs reveals global properties and specific subclasses. Genes Dev. 25, 1915–27 (2011).
5. Derrien, T. et al. The GENCODE v7 catalog of human long noncoding RNAs: analysis of their gene structure, evolution, and expression. Genome Res. 22, 1775–89 (2012).
6. Grote, P. et al. The tissue-specific lncRNA Fendrr is an essential regulator of heart and body wall development in the mouse. Dev. Cell 24, 206–214 (2013). 7. Sauvageau, M. et al. Multiple knockout mouse models reveal lincRNAs are
required for life and brain development. Elife 2, e01749 (2013).
8. Ulitsky, I. & Bartel, D. P. lincRNAs: genomics, evolution, and mechanisms. Cell 154, 26–46 (2013).
9. Liu, S. J. et al. CRISPRi-based genome-scale identification of functional long noncoding RNA loci in human cells. Science 355, eaah7111 (2017). 10. Guttman, M. & Rinn, J. L. Modular regulatory principles of large non-coding
RNAs. Nature 482, 339–46 (2012).
11. Johnson, R. & Guigó, R. The RIDL hypothesis: transposable elements as functional domains of long noncoding RNAs. RNA 20, 959–76 (2014). 12. Gutschner, T. & Diederichs, S. The hallmarks of cancer: a long non-coding
RNA point of view. RNA Biol. 9, 703–19 (2012).
13. Engreitz, J. M. et al. RNA-RNA interactions enable specific targeting of noncoding RNAs to nascent Pre-mRNAs and chromatin sites. Cell 159, 188–99 (2014).
14. Gutschner, T. et al. The noncoding RNA MALAT1 is a critical regulator of the metastasis phenotype of lung cancer cells. Cancer Res. 73, 1180–9 (2013). 15. Lanzós, A. et al. Discovery of cancer driver long noncoding RNAs across 1112
tumour genomes: new candidates and distinguishing features. Sci. Rep. 7, 41544 (2017).
16. Rheinbay, E. et al. Analyses of non-coding somatic drivers in 2,658 cancer whole genomes. Nature.https://doi.org/10.1038/s41586-020-1965-x(2020). 17. Huarte, M. et al. A large intergenic noncoding RNA induced by p53 mediates
global gene repression in the p53 response. Cell 142, 409–19 (2010). 18. Symonds, H. et al. p53-Dependent apoptosis suppresses tumor growth and
progression in vivo. Cell 78, 703–711 (1994).
19. Corcoran, L. M., Adams, J. M., Dunn, A. R. & Cory, S. Murine T lymphomas in which the cellular myc oncogene has been activated by retroviral insertion. Cell 37, 113–122 (1984).
20. Hezroni, H. et al. Principles of long noncoding RNA evolution derived from direct comparison of transcriptomes in 17 species. Cell Rep. 11, 1110–1122 (2015).
21. Nakagawa, S. et al. Malat1 is not an essential component of nuclear speckles in mice. RNA 18, 1487–1499 (2012).
22. Zhang, B. et al. The lncRNA Malat1 is dispensable for mouse development but its transcription plays a cis-regulatory role in the adult. Cell Rep. 2, 111–23 (2012).