Cannibalization Effects of Products in Zara's Stores and Demand Forecasting
byEvelyne L. Kong B.S., Mechanical Engineering
Ecole Centrale Paris, 2007
Submitted to the MIT Sloan School of Management and the Engineering System Division Department in Partial Fulfillment of the Requirements for the Degrees of
Master of Business Administration and
Master of Science in Engineering Systems
In conjunction with the Leaders for Global Operations Program at the
Massachusetts Institute of Technology June 2015
ARCHIVS
MASSACHUETT 1NfYTIITm OF ECHNOLOLG,MAY 28 2015
LIBRARIES
2015 Evelyne L. Kong. All rights reserved.The author hereby grants to MIT permission to reproduce and to distribute publicly paper and electronic copies of this thesis document in whole or in part in any medium now known or hereafter created.
Signature redacted
Signature of Author ...MIT Engineering Sylems Division, MIT Sloan School of Management
Signature redacted
May 8, 2015Certified by...
Georgia Perakis, Thesis Supervisor William F. Pounds Professor of Management Science
Signature redacted.
MIT Sloan School of ManagementC ertified by ... ...
Bruce Cameron, Thesis Supervisor Director of the System Architecture Lab
Signature red
acted
turer
in Engineering SystemsAccepted by... ...
Maura Herson Director of MIT Sloan MBA Program
Signature redacted
MIT Sloan School of ManagementA ccepted by ... ...
Munther A. Dahleh William A. Coolidge Professor of Electrical Engineering and Computer Science Chair, ESD Education Committee
Cannibalization Effects of Products in Zara's Stores and Demand
Forecasting
By Evelyne L. Kong
Submitted to the MIT Sloan School of Management on May 8, 2015 in Partial Fulfillment of
the Requirements for the Degrees of Master of Business Administration and Master of Science in Engineering Systems
Abstract
Because of short product life cycles, large product offerings and fickle consumer tastes, product demand in the apparel retail industry is volatile and difficult to predict. It is also thought to be impacted significantly by the presence of other products in the store, which may cannibalize or complement sales. This thesis explores the interactions among products in Zara's stores, and uses this information to improve the existing demand forecast. It focuses on attribute-based and price-based cannibalization effects for the trousers product category.
A necessary preliminary step to study cannibalization is to obtain an accurate classification of all products according to distinct features. We present such a classification for the trousers product category according to three main characteristics-fit, color and color lightness. The text mining and picture color detection techniques used here are of independent interest and can be used for the classification of other product categories.
We then use Zara's RFID system and sales databases to estimate cannibalization effects among products in stores. To this purpose, we introduce similarity factors and define a linear regres-sion model with fixed and time effects. We obtain statistically significant cannibalization effects. However, these effects tend to account for only a small portion of demand variations.
Finally, we propose various improvements to the demand forecast method, incorporating display, availability and cannibalization effects. The resulting demand forecast represents a significant im-provement over the base forecasting model. It reduces the forecasting error by over 10% for the sample stores in Madrid, Barcelona and London and by over 7% with only partial display informa-tion.
Thus the implementation of the present work will reduce overstock and lost sales. It also constitutes the first step towards product assortment optimization at Zara.
Thesis Supervisor: Georgia Perakis
Title: Williams F. Pounds Professor of Management Science - MIT Sloan School of Management
Thesis Supervisor: Bruce Cameron
Title: Director of the System Architecture Lab, Lecturer in Engineering Systems - MIT Engineering System Division
Acknowledgments
During six months in 2014, I had the opportunity and immense pleasure to work in La Corufia at Inditex's headquarters. This was possible thanks to the long-standing collaboration between Zara and the Leaders for Global Operations program at MIT. I feel blessed for having the chance to discover the fashion industry at Zara and for the friends I have made during my internship. The environment at Zara has been very supportive of my work since my very first day in June 2014 and I am very grateful for the exciting project the distribution team has given me.
I would like to thank my supervisors and colleagues Martin N6voa Vidal, Ane Insausti Altuna and Ivin Escudero Rial, who were always available for any questions on a daily basis. Their insights and experiences were invaluable for my work and I could not have done this thesis without their contribution. I am thankful to Alberte Dapena Mora who did a fantastic job helping me understand the structure of Zara's database. Thank you also to Begofia Valle Vilela, Sergio Marquez, Patricia Arribas Davila, Yago Vera Cuartero and the rest of Zara's distribution team for creating a joyous atmosphere at work and for constantly bringing pastries from Panaderia Rozas.
The project would not have been possible without the support of the LGO Program and of my advisors. Georgia Perakis has been instrumental in providing structure to my thesis and I would like thank her for giving a considerable amount of her time on a weekly basis. I am very grateful to Bruce Cameron, for his invaluable advice on how to define the objectives of my internship early on, and how to keep my focus throughout.
Finally, my family and friends have always been present for me during my six months in Spain. I am particularly thankful to my amazing husband, who was there at every step of my experience at Zara and has always encouraged me to pursue my goals in life.
Contents
Acknowledgments List of Figures List of Tables
1 Overview
1.1 Thesis Motivation and Problem Statement 1.2
1.3 1.4
Proposed Approach and Contributions . . . . Insights and Summary of the Results . . . . Thesis Layout . . . . 2 Background
2.1 Zara in the Fashion Industry . . . . 2.2 Fashion Product Demand and Product Categories . . . 2.3 Zara's Supply Chain . . . . 2.4 Implementation of the RFID Technology . . . . 3 Description of the Approach
3.1 Existing Replenishment Method and Demand Forecast 3.2 Literature Review . . . . 3.2.1 Definition of cannibalization and substitution . 3.2.2 Cannibalization Models . . . . 3.3 Proposed Approach . . . . 4 Data Collection and Product Classification
4.1 Data Description and Selection . . . . 4.2 Classification Methods Used . . . . 4.2.1 Text M ining . . . . 4.2.2 Color Detection Algorithm . . . . 4.3 Results of the Classification . . . .
5 Modeling of the Cannibalization and Complementarity of Store at Zara . . . . 5 9 10 11 11 11 12 13 15 15 15 17 18 20 20 . . . . 21 . . . . 22 . . . . 23 . . . . 25 27 27 28 28 28 29 Products within a 33 Discussion on the Model Selection . . . . 33
Specification of the Product Demand Model with Cannibalization and Complemen-tarity effects . . . . 34
5.2.1 Description of the Notation . . . . 34 5.1
5.2.2 Demand Model . . . 36
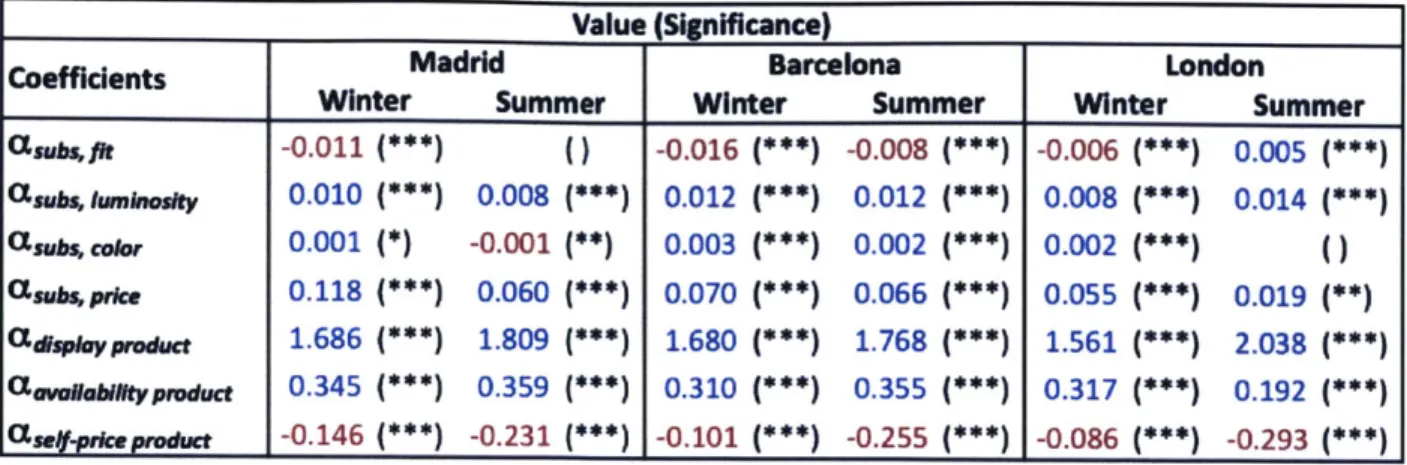
5.3 R esults . . . 37
5.4 Limitations of the Model . . . 39
6 Forecast of the Product Demand 41 6.1 Specification of the Forecasting Models . . . 41
6.1.1 MO - Base Forecast Model . . . . 41
6.1.2 Ml - Pure Auto-regression Model . . . . 41
6.1.3 M2 - Model with Lag Sales, Display, Availability and Price Parameters . . . . 42
6.1.4 M3 - Model with Cannibalization and Complementarity Effects . . . . 42
6.2 Results - Parameter Estimation . . . . 43
6.3 Results - Comparison of the Accuracy of the Forecasts . . . . 45
6.3.1 In-sample wMAPE . . . . 46
6.3.2 Out-of-sample wMAPE . . . . 46
7 Demand Forecast with the Estimated Display 48 7.1 An Uncertain Display . . . . 48
7.2 Estimation of the Display a Week Ahead . . . . 48
7.3 Forecasting Models with the Estimated Display . . . . 50
8 Conclusions 53 8.1 C ontributions . . . . 53
8.2 Im plem entation . . . . 54
8.3 Future Improvements. . . . . 55
List of Figures
1 Examples of product life cycles in a store. . . . . 16
2 RFID technology benefits . . . . 18
3 Representation of the two cycles for the decision making process of the distribution at Z ara . . . .. . . . 20
4 Illustration of the Color Detection Methods . . . . 29
5 Classification of the products by characteristics . . . . 30
6 Trends over the year of the products presenting various features for some stores in M adrid . . . . 31
7 Hierarchy of the various product groupings in a store for the study of the product dem an d . . . . 35
8 Examples of themes in Zara's stores for the Spring-Summer 2014 collection . . . . . 40
9 wMAPE of the display estimation, by quartile of sales. . . . . 50
10 Examples of products in the clusters (1/2) . . . . 58
List of Tables
1 Summary of the cannibalization or complementarity effects by attribute and price . . 12
2 Improvement in wMAPE by city with the new demand forecast model relative to the base m odel . . . . . . . . 13
3 Value of the Coefficients obtained for the Cannibalization Model . . . . 38
4 Results of the type II Anova test - Sum of Squares for all covariants . . . . 39
5 Coefficients and their significance for the Models M1, M2 and M3. . . . . 44
6 Adjusted R2 for the different models . . . . 45
7 Akaike's Information Criteria for the different models . . . . 45
8 In-Sample wMAPE for the six data samples . . . . 46
9 Out-of-Sample wMAPE for the six data samples . . . . 47
10 wMAPE for the two methods to estimate the display of the week w +I . . . . 49 11 Coefficients and their significance for the Models M2 and M3 with an estimated display
covariates. . . . .
12 In-Sample and Out-of-Sample wMAPE for the six data samples. . . . . 13 Summary of the cannibalization or complementarity effects by attribute and price . .
14 Improvement in wMAPE by city with the new demand forecast model . . . . 15 list of the product clusters . . . .
51 52
53
54
1
Overview
1.1
Thesis Motivation and Problem Statement
Every year, Zara delivers 11,000 distinct products to 2,000 stores across the world. With new products arriving in the stores twice a week and an affordable product offering, Zara has successfully attracted customers to its stores to shop for the latest fashion trends and has become the world largest fashion retailer. To respond quickly to the demand of its customers, the company has developed a very responsive supply chain. Still, even with a design to store delivery lead time of a few weeks, predicting customers' volatile demand is key to Zara's success. Given the short life cycle and fickle customer taste, it is not uncommon to observe forecasting errors of 60% of more at the
SKU level in the apparel industry. This leads traditional fashion retailers to sell up to 50% of the
merchandise on markdowns ([1).
Therefore, an accurate forecast of the store-level demand is essential to minimize stock-outs and overstocks. In Zara's current demand forecasting method, each product is considered in isolation. In practice, however, products interact with one another in the store. For example, the presence of a product on the shop floor may reduce or increase the sales of other products. Similarly, there can be cross-price effects, with sales of a product being affected by the prices of other products. Product cannibalization within a store is the subject of considerable research ([2, 3]), especially for the study of product assortment for the supermarket retail industry. However, no significant research has been done on finding evidence of cannibalization among products in the apparel retail industry.
Identifying cannibalization patterns among products requires access to detailed data about prod-uct attributes, sales, inventory or display information. For example, a retailer may not perfectly know if a given product is present on the shop floor, as data only show the total inventory in the store, which includes inventory on the shop floor and in the stock room. However, the recent de-ployment of the RFID technology in Zara's stores has given us access to a wealth of information which was not available before and is crucial to know the product assortment at any given time in a store. The current work presented here is one of the first projects using the new RFID database, which can ultimately help optimize product assortment planning for Zara.
Thus, the present thesis focuses on understanding these cannibalization and complementarity effects among products within Zara's stores and how this information can be used to improve the store demand forecast at the product level.
1.2
Proposed Approach and Contributions
To understand cannibalization and improve Zara's product demand forecast, we adopted the fol-lowing approach to the problem:
* Collect data and build a new product classification. The project requires using store
sales data and information collected by Zara's new RFID system. Because we expect moresignificant cannibalization or complementarity effects among similar products, we created a new product classification that allows to identify easily similar or dissimilar garments. The product classification was implemented using as much as possible automated methods, such as text mining and color detection techniques.
* Develop, test and validate a model of demand at the product level, and of the cannibalization and complementarity effects among articles. This step consists in developing a model to quantify cannibalization effects on demand. The model focuses on cannibalization patterns based on similarities between products among one product category: trousers. For this step, we defined an attribute-based regression model using similarity factors among products, and fixed and time effects to isolate specific store and seasonal impacts. * Develop, test and validate a demand forecast model at the product level. We used the
most significant covariates determined in the step above to improve Zara's current forecasting methods. We compared the accuracy of the different models tested against the base model. " Create a forecast model with estimated display information. We also improved the
forecast using estimated display information, given that the actual display in a given week is not always known. Finally, we defined a simple method to estimate the display based on past information.
1.3 Insights and Summary of the Results
The results of the thesis are summarized below.
We estimated cannibalization and complementarity effects using a demand model with fixed and time effects across stores, for three different cities and for the Fall-Winter 2013 and the Spring-Summer 2014 seasons. Table 1 summarizes the main findings of the model. The sales of products with a similar fit cannibalize each other, whereas the sales of products with similar color or color lightness are complementary. The price of similar products also has an impact on the sales of a given product - an increase in the price of the former tends to increase the sales of the latter. All of these effects are consistent across seasons and stores; however, the measured effects are fairly small. This in turn can be rationalized by attenuation bias from measurement error, but also by other effects, such as product location in the store.
Coefficients Effect
Qsu fit
Qas, color ightess +
Ta :aloor +
USU4s price +
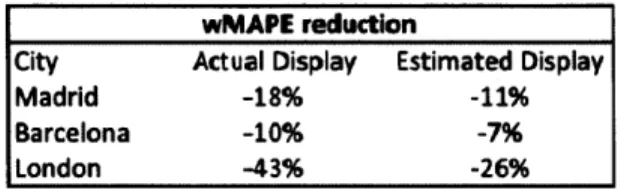
In a second step, we used these results on cannibalization to improve the demand forecast. A model with display, availability and price effects results in substantial improvement in forecast accuracy, compared to the base model, which is a simplified version of Zara's existing forecast method, as one can see in Table 2. Adding cannibalization effects also improves slightly the accuracy of the forecast. However, it also requires a, significant amount of data preparation. Hence, Zara should consider whether to add these effects to its forecasting model in light of this tradeoff. We generated the new forecast using both the actual product display information as well as a model that estimates the display given the information available to Zara's distribution team. The results with the estimated display are less accurate than the ones with the accurate display, but still present a significant improvement compared to the base method.
wMAPE reduction
City Actual Display Estimated Display
Madrid -18% -11%
Barcelona -10% -7%
London -43% -26%
Table 2: Improvement in wMAPE by city with the new demand forecast model relative to the base model
These results can be implemented in Zara's processes, by improving the integration of the various databases used and the current product classification efforts. More precise results can also be obtained with more historical data for various stores.
1.4 Thesis Layout
The thesis is organized with the following structure:
" After the present overview of the thesis, we introduce background information on Zara in Chapter 2. We describe characteristics of fashion products, Zara's supply chain and the recent implementation of the RFID technology in Zara's stores.
" Chapter 3 presents Zara's existing forecasting method used for the short term replenishment and a literature review related to the study of cannibalization.
" Chapter 4, describes the work done to create additional attributes for the products. It also explains why we limit our study to one year of sales for the pants product category.
" The modeling of the product demand with cannibalization effects and the results are presented in Section 5.
" Chapters 6 and 7 focus on the demand forecast, by testing different models and comparing their accuracy with the one of the base model.
* Lastly, Chapter 8 summarizes the results. It also discusses the implementation of this project into Zara's processes and the next steps of the project.
2
Background
Zara has grown in forty years into the largest fashion retailer in the world, by offering a large choice of affordable clothes. Despite the short life cycle and high demand variability of fashion products, the company has been able to respond very quickly to customers' demand by developing a fast supply chain, from the design stage to the delivery in the stores. Moreover, the recent development of RFID technology has provided additional operational benefits, which gives valuable insight into the product interactions within a store.
2.1 Zara in the Fashion Industry
Zara is a world leading fashion brand, with close to 2,000 stores in about 90 different markets. It is the flagship company within the group Inditex, which also includes seven other brands (Massimo Duti, Zara Home, Berksha, Oysho, Stradivarius, Pull & Bear and Uterqiie). Altogether, the group represented more than -16B of sales in 2013 (14]), leading in revenues ahead of the rest of the fashion retailing companies in the world.
Zara is very well known in the industry for having successfully implemented the fast fashion con-cept. It offers a large collection to cosmopolitan, fashion-conscious and budget-minded customers, with new products delivered every week in the stores, to appeal to its most fashion-forward audience. One of Zara's competitive strengths is its ability to respond very quickly to customers' demand by offering the latest trends, with a turnaround from design to store delivery of a couple of weeks. Zara is able to offer 18,000 distinct products each year, while traditional competitors propose 2,000 - 4,000 models ([5]). This strategy allows Zara to develop a customer base that returns to the store several times during the year to check out the latest fashion trends.
Inditex has a very strong presence in its home country, Spain, which represents 20% of its yearly sales. The United Kingdom, France and Italy also are large markets for the company in Europe, which totals 46% of Inditex's sales ([41), while the company is expanding its Asia markets very fast, notably with its online sales.
Thus, Zara's success is based on following quickly the demand for fashion products. The next section presents the main characteristics of this demand, which is notoriously volatile.
2.2 Fashion Product Demand and Product Categories
Fashion garment products generally have a short product life cycle, high variability and very seasonal sales.
Products usually only last at most a season, i.e. five or six months -a trend that the fast fashion movement has accentuated. Zara defines two broad categories of products: the basic clothes, which have a longer life in the store and appeal to a large customer base; and the "fantasia" products. The latter have a trendier customer target, limited stock availability, and (as a result) may last in the store only for a couple of weeks. The two types of products are illustrated in Figure 1.
. 12 --- ---- --
-8 --- ---- - -
--9 11 13 15 17 19
week
Figure 1: Examples of product life cycles in a store.
The blue line represents the demand for basic products, whereas the orange line represents an example of demand for "fantasia" products.
The weekly sales at the product level in each specific store also present a high variability. A product usually sells at a rate of a few units per week. Popular products sell a dozen units per week in certain stores, while many products are not purchased in a week - those articles tend to be replaced in Zara's stores with new references. Given this low average demand level, the demand sees a high variability, as a one unit difference represents a high percentage of the product weekly sales.
Moreover, the product demand can present a seasonal profile. The year is structured in two main seasons - the Fall-Winter season, which runs from July to December, and the Spring-Summer season, from January to June. The two seasons offering, and therefore the demand for particular products, are adapted to the weather at that time of the year. Special events during the year also impact the demand. For example, the store sales increase during Christmas in the US or Ramadan in the Middle East (a more detailed discussion on the demand seasonality is available in [6]). The end of the fashion season is also marked by significant markdowns in Europe. These periods have their own sales dynamics, and are the subject of a previous MIT thesis [7].
Therefore, the demand at the product level can show a high variability from week to week, while presenting seasonal patterns.
We now introduce Zara's current classification, which will be a useful reference for the rest of this thesis. Zara Women uses the following terminologyl:
" At the higher level, Zara Women is organized in three collections - Woman, Basic and Trafaluc. " The largest product category within a collection is the product family, such as shirts, skirts,
pants. Zara defines about thirty different product families.
" The following level in the classification is the product level, also called MCC at Zara (in Spanish, Modelo/Calidad/Color).
'Because the project was in Zara Woman Distribution team, we looked specifically at the classification in the Women Department of Zara but similar classifications have been pursued in the other departments.
* Finally, the SKU is represented by a product in a specific size -this level is also called MCCt in Zara's jargon (t for "talla").
2.3 Zara's Supply Chain
To be able to respond quickly to demand, Zara has a very centralized and rather vertically integrated organization that focuses on regular customer feedback through the supply chain.
At the headquarters in La Corufia, hundred of designers, in close collaboration with the buyers, decide on the collection 6 to 8 months in advance, taking into account the latest fashion trends and the customer feedback received at the stores. The buyers procure the garment through three channels. For basic items, a long circuit sourcing is chosen - products are manufactured in Asia in large quantities for a low cost, with a lead time of about 12 weeks. With proximity sourcing, on the other hand, buyers procure garment manufactured in European and Mediterranean countries, such as Morocco, Turkey, Portugal or Spain. This channel allows for a shorter lead time (4 to 6 weeks) for a moderate manufacturing cost. Finally, in-house manufacturing is used for higher-priced "fantasia" products and allow Zara to react quickly to new trends. In-house manufacturing refers to a network of local suppliers in the region of La Corufia that have built long-term partnerships with Zara. Between these three channels, Zara can adapt its supply chain based on the profile of its product sales.
All the products, whether they are manufactured in Asia or locally, are transported to the distribution centers in Spain for the distribution to the stores. This centralized structure, though costly, also enables Zara to control its stock more closely and optimize the distribution to the different stores depending on the local demand. The garment is then transported, almost always by air, to the 2,000 stores in the world.
Lastly, all the stores in the world receive deliveries of new products or replenishment twice a week. Stores manage the in-store replenishment and product assortment processes. Every evening and every morning after the potential arrival of the trucks, they rearrange the store product assort-ment. They remove products for which the main sizes (S, M, L) are no longer available, follow the merchandizing guidelines by reproducing windows as shown in pictures of pilot stores in La Corun-a, and place the new products on display. During the day, the sales associates regularly replenish the shop floor from the stockroom, as products are bought by customers. More generally, the stores play a crucial role in transmitting the customers' feedback back to the product managers at La
Coruia, who communicate with the designers and buyers.
Thus, Zara is structured to be able to collect feedback from its stores and react quickly to the demand. Its organization and operational strategy allow the company to keep lower inventory than its competitors, which results in a lower percentage of its merchandise sold on markdowns (according to [1], 15% versus 50% for traditional fashion retailers). The RFID deployment in Zara's stores has also contributed to improving Zara's operations in the stores and to enhancing the agility of its supply chain.
2.4
Implementation of the RFID Technology
Recently, Zara has been deploying the RFID technology in its stores. The technology offers many benefits to the company's operations for the in-store operations:
" Easy and fast in-store inventory - at the moment of the delivery of new products in the store, the RFID technology allows for an almost instantaneous inventory, as opposed to the long manual process that consists in checking every box number against the listing and counting the number of articles received for each reference.
* Instant knowledge of units displayed on the shop floor for each product -this is particularly useful for the shop floor replenishment during the day. The store can immediately know how many units of each product it needs to bring from the stock room. In the past, the store checked throughout the day which products were sold within the last hour and used this information to replenish the shop floor.
" Instant knowledge of the inventory level - the regularly audits of the inventory in the store is largely facilitated by the RFID chips on the products. In addition, the stores also know the inventory levels of the other stores in the region. They can reorient a customer looking for a particular product to the nearest store where the product is still in stock, therefore improving the customer experience in the store.
" Finally, the RFID technology can in the long run provide invaluable information about the product display in the store. In particular, the information collected from the RFID database are essential for the study of the interactions among products in the stores or can be used to understand the impact of marketing or merchandising strategies within the stores.
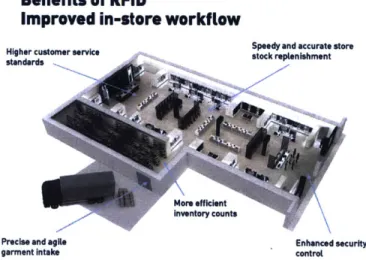
Benefits of RFID
Improved in-store workflow
Higher customer service Speedy and accurate store
standardsstck replenishment
Mom effickent Inventory counts
Precise and agle Enhanced security
garment intake control
Figure 2: RFID technology benefits (source [91)
[8] provides additional details on the benefits and business value of RFID deployment for fashion retailers and Figure 2 illustrates the benefits of RFID in the stores.
Almost all the clothes in the stores carry an RFID tag. Currently, Zara has rolled out the RFID technology in more than 700 of its stores and expects to complete the deployment in all its 2,000 stores by 2016.
Zara's strategy relies on a flexible, responsive supply chain to respond rapidly to its customers' needs. The RFID deployment in Zara's stores enhances the customer's value chain, but also provides access to new information that can be used to improve the understanding of the demand in the store. The present project focuses on that objective, by analyzing the cannibalization or complementarity effects among products in a store. We start in the following chapter by reviewing Zara's current forecasting method and the existing literature on cannibalization and describing our approach to the problem.
3
Description of the Approach
Before adopting an approach to study cannibalization and improve the demand forecast, one should understand the current demand forecast at Zara and the existing literature on cannibalization effects.The short-term replenishment from the distribution centers to the stores requires to predict the demand a week ahead. Zara's existing forecast method, detailed below, currently does not take into account any interaction among products displayed together in the stores. We then review in Chapter 3.2 the current literature on cannibalization modeling and finally describe our approach to understand cannibalization effects on the shop floor.
3.1 Existing Replenishment Method and Demand Forecast at Zara
Demand forecast is needed in various processes in Zara's operations: it is needed for financial planning; buyers prepare long term procurement plans using 6 to 8 month ahead demand forecast; for the distribution team, the forecast horizon is one week ahead. The work presented in this thesis focuses on the product demand forecast for the distribution team, and therefore only tackles one week ahead demand forecast.
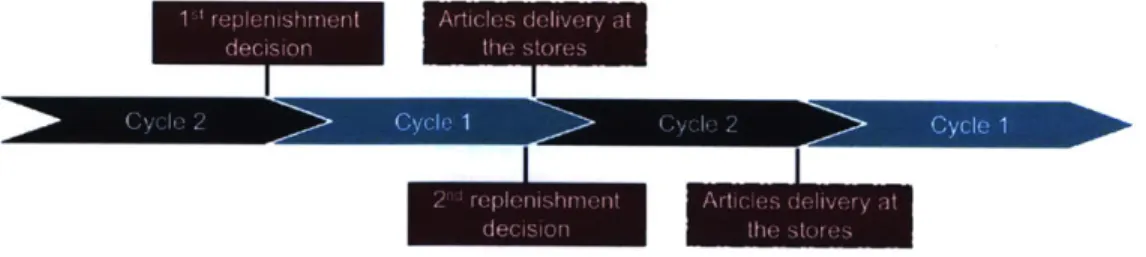
The decision process for the replenishment from the distribution centers in Spain and for the first delivery of new products is centralized in La Corufia for all 2,000 stores. Zara sends products twice a week to the stores. At the beginning of the replenishment cycle, the demand of each product for the week ahead is estimated. The amount to be delivered to the store is the difference between the demand, adjusted for a given target inventory level, and the current stock at the store, as expressed in Equation 1 for each product k in each store s:
Replenishment Quantityk,, ~ Daily Demandk,, * target inventory level (days) - store inventory,
(1)
The products are then sent to the stores in about 48 hours, before the beginning of a new replenishment cycle. Figure 3 illustrates the replenishment cycles from the distribution to the stores.
Figure 3: Representation of the two cycles for the decision making process of the distribution at Zara
For products already in the stores, the daily product demand is determined using the last two weeks of sales. For simplification purposes, Zara's existing forecasting method can be approximated
as a two week rolling average of the demand. Adjustments can be made to account for stock-outs, the differentiated weights of the weekdays, and, when it comes to the demand at the size level (MCCt), for the profile of size sales at the store. The detailed calculation of the adjusted demand is explained in [101. For the present thesis, we are interested in the demand at the product level. Therefore, we will consider that the current demand forecast for product k, in week w, in the store s, is expressed as follows:
average daily ale~k, = average daily salesk,w1,,-
+
average daily salesk,w-2,, (2)where the average daily sales of the previous weeks are adjusted for stockout. For example, for week w - 1, the average daily sales are as follows:
E
saleskday._1,saverage daily salesk,w_1,S - dayin w k -1 (3)
DPk,w-1,s
where DPVk,w_1,8 represents the sales adjusted by possible days of sales (DPV - dfas posibles de ventas). The possible days of sales exclude the days of the week when the product was out of stock or when the store was closed.
Finally, a different process is in place for the demand forecast of new products. This was the object of a previous MIT project with Zara ([101), which the reader can refer to for further details. The forecast of new products relies on the use of products similar to the new product going to the store. The sales of these comparable products serve as the basis of the new product demand forecast for the first weeks.
Thus, the forecast of the product demand one week ahead is crucial to Zara to minimize stock-outs and overstocks. To estimate the product demand, Zara uses a method based on two-week rolling average of the product sales. With this method, it assumes that products are independent of each other in the store. However, this assumption is debatable. Customers have a limited budget going into the stores and have therefore to choose among products to stay within their budget. One can also think that if many similar products are displayed together, it may negatively or positively impact the sales of each of these products individually. Thus, products interact with each other in the stores and this may impact of the sales. The study of the cannibalization and complementarity effects among products is one of the objectives of the present work.
3.2 Literature Review
The study of cannibalization is the object of multiple fields of research in operations research (for product assortment problems) and in economics. We first take a look at how cannibalization is defined, in particular in relation to substitution; we then present various commonly used models to measure cannibalization.
3.2.1 Definition of cannibalization and substitution
Cannibalization is defined in different ways in the literature and is closely related to substitution. Cannibalization has been defined as "the process by which a new product gains sales by diverting the sales from existing products" ([11, 12]). This definition, fairly consistent across the marketing literature ([13, 14]), is often employed for new product introduction. However, one can also be interested in studying the decrease in sales of existing products due to the mere presence of other products. This is closer to the definition of substitution, term that is more often used in the economics literature. Substitution is more broadly defined as the extent to which a customer chooses a product to replace another product, whether it is because the latter was not available or because the customers had a personal preference. Consequently, the sales of the existing or unavailable product decrease. Hence, the definitions of cannibalization and substitution are closely related and in the rest of this thesis, we will indiscriminately use the two terms.
The literature has defined a number of distinct substitution effects. In the context of assortment planning for retailers, A. Giirhan Kdk ([2]) defines three distinct patterns of substitution. The first type of substitution, called stock-out based substitution, is based on the assumption that a customer will replace an unavailable good that he/she was planning to buy with a similar product available in the store. Another substitution, based on the assortment choice made by the retailer, sees the customer choose among the products displayed in the store, to replace an article seen elsewhere. These two patterns are often encountered for food products and the second one is of less interest for our study, given the scope of the thesis. Finally, the third type of substitution listed in [2] can be more often encountered for fashion retailers. It is a substitution based on consumer preferences. The customer looks at the available products in the store. He/she considers an article based on the utility he/she gains from its purchase and selects the article which maximizes his/her utility. Because the latter is very common in the fashion industry, we will focus on this particular pattern of substitution.
Within consumer preference-based substitution, [15] identifies further types of cannibalization. The multi-product pack cannibalization and combo-product cannibalization both relate to different products which, because they are packaged together impact negatively the sales of products sold individually. In the context of our project at Zara, we are more interested in the two other types of cannibalization defined in [15]. The first is inter-product substitution, which deals with patterns of substitution between articles belonging to different product categories. For example, it would be the purchase of a pair of pants instead of a skirt. The intra-product cannibalization is related to competing products within the same product category, for example two different shirts.
Substitution can occur at various levels. It happens between competitors - for example, the opening of a new store can cannibalize the sales of competitors in the neighborhood. For a same brand, the substitution can occur between the various stores or even between difference channels of sales. For instance, the fast growth in Zara's internet sales may impact the sales in the stores2.
2
The brick and mortar and e-retail sales can present both substitution and complementary effects. Customers may prefer to buy online instead of in the stores, but the integration of the brick and click businesses can also complement
However, in the scope of this work, we will restrict the substitution to patterns occurring within the same store of Zara.
We still need to determine which articles within a store are most probable to be substituted. For the case of Zara, given the large number of articles on the shop floor at the same time (500 to 2,000 articles, depending in a given store), and the very limited time an article is displayed, it is virtually impossible to measure all the substitution patterns of a given article with the rest of the articles displayed on the shop floor at the same time. S. R. Srinivasan et al. in [15, 161 discuss that the cannibalization happens most often based on product attributes. These attributes include brand, product family, and individual product attributes (for example color, pattern, fabric or price for garment products). Therefore, as explained in [171, two products from a different product family with different functions, such as a scarf and a skirt, are seen as less likely to substitute each other. [18] is an example of paper that adopts the same attribute-based approach to model its demand. Cannibalization and substitution are often very similarly defined in the literature, and we will used both terms in the rest of the thesis without any distinction. A large number of substitution patterns exist within a store; however, the present work will focus on patterns based on consumer preferences between products with similar features. Given this focus, we present models of substitution in the next section.
3.2.2 Cannibalization Models
Different approaches can be adopted to model product demand with cannibalization effects. We will detail the most widely used model, the Multinomial Logit Model, then we will give a brief overview of other approaches that can be taken.
Multinomial Logit Model A very popular model of choice is the multinomial logistic (or logit) model, as described in [19, 20]. The multinomial logistic (MNL) model relies on the assumption that customers maximize their utility by choosing among a finite choice set. For a given alternative j, the utility of the customer n can be written linearly as follows:
Uni = /xnj + k3 + Enj, (4)
where xnj is a vector of variables that describe alternative j for individual n, 3 are the vector coefficients for these variables, kj is a constant that is specific to alternative j and Enj is the unob-served portion of the utility. Assuming that each Eni is independently and identically distributed according to an extreme value distribution, the logit choice probability that the individual n chooses alternative
j
is:- e)3xnj+kj
= Eexni+ki i
As discussed in [20], the MNL model has limitations. Notably, it only allows proportional substi-tutions across alternatives. The model assumes that the Independence from Irrelevant Alternatives (IIA) property is valid. This entails that when a new alternative appears in the choice set, the rest of alternatives probability decreases by the same percentage. This model is appropriate for many situations, but inadequate for others such as the famous example of the red bus-blue bus problem. Let us imagine that an individual has a choice of either taking a car or a blue bus and that a new choice, the red bus, is available to the individual. Under the IIA assumption, the probabilities that the individual chooses the car and the blue bus decrease by the same percentage. However, it seems logical that the probability for the blue bus decreases more, given the similarity of the blue bus and red bus alternatives. In this situation, the MNL overestimates the proportion of individuals that take the bus and underestimate the car option.
A second important restriction of this model is that it provides shares of the market for the various products, without indicating if the overall market has increased with the introduction of the new products. In other words, we do not know if the sales of the new product have cannibalized the sales of the existing products or has increased the size of the market. A final limitation of the MNL model is that it is usually used for a fairly small set of choices and therefore it would be computational intensive to use the model for the thousand of products displayed in a Zara's store.
Despite these limitations, the MNL model has been extensively used in the literature to study substitution patterns. To overcome the restrictions on the substitution patterns made by the MNL, other generalized linear models can be used. The nested multinomial model is very common, allowing to provide a hierarchy in the set of choices -for example the red bus and blue bus on the one hand, and the car on the other hand. [20] describes other models for discrete choice models similar to the MNL, and gives many examples.
Therefore, for the present work, MNL models presented some issues. First, with a large number of displayed products (at least 100 of products displayed at the same time), the estimation of the parameters for the MNL models proceeds to be be time-consuming. In addition, MNL model outputs provide percentages of sales shares for the various products, which may not always be appropriate. With only the prediction of percentages, it is difficult to know if a new product has cannibalized the sales of other products or has increased the volume of sales without impacting the sales of the other products.
Combined Clustering and Regression Methods Another approach to model cannibalization is to use data mining methods to group products together, and then study the cannibalization within the product groupings.
Several classifications methods can be used to create clusters of products. Two methods easy to implement are the k-means and k-medofds clustering. The first step of both methods is to measure the inter-product distances, which is a measure of how similar, in terms of attributes, two products are. Different weights can be attributed to the different attributes. The next step is to try to find, for a given number of clusters k, centers that are representative of the clusters. Products are then
associated with the cluster whose center they are the nearest to. Other methods are available, such as hierarchical clustering, decision regression trees or support vector machines. The reader can refer to [21] to get an overview of the various techniques.
Once the products are grouped together, analysis using regression methods can be used to measure cannibalization. Iterations may be necessary to find the best groups of products, depending on how much weights is given to each attribute. For this purpose, [22] adopts a technique that seems particularly appropriate for the current problem, as it enables to cluster and run the regression simultaneously.
However, the method based on clustering presents the drawback of being difficult to implement dynamically, as clusters have to be recalculated as new products are introduced in the stores.
Attribute-based Regression Models The last approach discussed uses the classical linear re-gression method. [18] uses a log-log model to estimate the product demand and uses similarity factors to measure cannibalization among products. This method has the benefit of using few pa-rameters. In the study of [18], the products considered are detergents sold in supermarkets, which is an easier product to study. Detergents generally present a smoother demand and have a longer shelf life than fashion products. In addition, the number of displayed products (only 31) is limited. However, this method can be adapted to fit the context of this thesis.
Hence, the various methods described above presents various alternatives to model substitution. MNL is a very popular model but may not be adapted to a very large choice set. Methods combining clustering and regression are also used in the literature, but may be difficult to use in the case of short product life cycles. Finally, regression models using similarity factors have also been employed but need to be adapted to fashion products. The latter approach is the basis of our model, which is presented in the following sections.
3.3 Proposed Approach
We describe below the approach taken to study cannibalization and to improve the demand forecast at the product level.
The literature review showed that for all the methods to study the cannibalization among prod-ucts, it is essential to obtain attributes for each product. This becomes even more a necessity when the number of products studied at any time reaches one hundred or more. We reviewed the current product classification at Zara in detail and we found that additional work was required to be able to distinguish the products based on their attributes. In fact, limited information was available on the specific features for each product. Therefore, the first step consisted in collecting data to create the appropriate product classification. This was done using text mining methods and color detection techniques on the pictures of the products. We limited the study here on the trousers product category, but this approach can be adapted to other product categories. The product classification and results are presented in Chapter 4.
Once an adequate product classification was determined, we focused on the study of cannibal-ization or complementarity effects. We chose to adopt an approach similar to the attribute-based regression models described in Section 3.2.2. The differences with the model in [181 reside in how the similarity factors was calculated and how we defined product clusters to account for the products that have the exact same set of features. We made the study on various stores in different cities to benefit from a high statistical power coming from a large sample. To identify the cannibalization or complementarity effects and isolate the store-, feature- or time-specific effects, we chose to in-troduce fixed and time effects. Using this model, we estimated the attribute-based and price-based cannibalization effects. The results are discussed in Chapter 5.
After the study of the cannibalization, we created a demand forecast model (see Chapter 6). We had to adapt the model to study the cannibalization effects, as time and fixed effects were inadequate for forecasting. Therefore, to integrate information about the products, we included sales lags of order 1 and 2. We specified and estimated models with incremental improvements. We then compared and discussed their forecasting accuracy.
Another step necessary to implement the findings of this thesis into Zara's processes was to work with imperfect display information for the products. The reasons to have only partial information on the display from the perspective of Zara's distribution department are explained in Section 7.1. We first estimated whether a product is displayed in the week w using the display information of the week w - 1 and the information about the planned delivery of new products for the week w.
This approach proved to be sufficient to obtain an estimate of the product display one week ahead. We defined again forecast models using the estimated display information. We also compared their forecast accuracy against the existing forecast and the forecasts using the actual product display.
Finally, we summarized the results in the last chapter and discussed potential improvements or directions to improve the accuracy of the demand forecast. We also identified the steps necessary to implement the work on this thesis into Zara's tools.
4
Data Collection and Product Classification
Before being able to study cannibalization effects, it is necessary to create a classification of the products, based on their attributes. The following chapter discusses the current classification and the work done to obtain additional information on the product attributes.
4.1 Data Description and Selection
Part of the initial work was to select the appropriate and available dataset for the study of canni-balization.
Inditex has an extensive data collection system which provides information on each article at the SKU level (each reference, at the size level) in every store. This database provides daily sales, product family information, and an estimate of the available stock, for each store and each product broken down by size. The size of the daily product-level sales data for one store for a period of one year can amount to 3 million rows. If we were to work with the sales data of all Zara's stores at the same granularity, the data size would exceed 2 billion rows.
The second source of information available was the one collected from the RFID system. This technology is in the process of being deployed worldwide in all Inditex's stores -at the time of the project, only data for Spain, Portugal and the United Kingdom were available for a period of a year or more. As a result, our analysis was restricted to these three countries. Still, the recorded RFID information results in database of the same size as the sales database described above. The RFID database provides exact information on whether an article is on the shop floor or in the stockroom for each day of sales, the desired inventory position on the shop floor and the stock room inventory. Given the complexity of comparing multiple stores, we also selected stores that did not undergo a major renovation in the past two years, which restricted the eligible stores to a few hundred.
Finally, as we studied cannibalization effects among products having similar features, it was necessary to obtain information related to the product attributes, such as color, fit, existing patterns, neck, fabric, etc. Some of these attributes, such as the fabric, were readily available as a field in the database. However, features like fit or existing patterns on the garment were information that had to be extracted from free description fields of Zara's database. The current classification of the colors of the products were particularly complex and had to be reprocessed to be consistently used in our analysis. The collection of relevant attributes for the articles was therefore a time-consuming task. Given the time constraint of the internship, we limited our study to one product family-we decided to focus on the trousers product category. This product family still provides a wide variety of choices to the customers, with more than 800 distinct references offered throughout one year. Depending on the number of products a store receives, the size of the final dataset for the trousers product category is 20,000 to 35,000 rows per store.
4.2 Classification Methods Used
4.2.1 Text Mining
We employed text mining methods to obtain attributes that are not yet collected systematically into Zara's database. We used the following methodology:
" Identify fields in the database containing valuable information for the classification.
" Based on the recurrences of the words, identify attributes used by the buyers to describe a product. For the pants product category, the fit, the existence of patterns, the color and the color lightness were attributes very commonly described in the analyzed fields.
" Create lexicons for each attribute. Words found in the various fields were in different languages (mostly Spanish and English) or had typos. Algorithms, available in packages in R, can recognize typos and can be used to process the data faster.
" We added manually missing information for some of the products to complete the classification of the collection for the season Fall-Winter 2013 and Spring Summer 2014.
The benefits of such an approach is that if the description provided by the buyers is accurate enough and defined with a keyword approach, it will be easier to detect trends among the collections or patterns of sales. This method was used to determine the fits and patterns for each product in the trousers product family.
4.2.2 Color Detection Algorithm
Zara already had an existing classification for the colors but this classification was mostly qualitative and difficult to simplify.
To have a more systematic approach, we created a code to analyze the pictures of the products and detect the color of the garment. Two methods were used. The first attempted to detect the garment in the picture and then gave the average color of the area where the garment was detected. The second method used the fact that all pictures had a similar layout and that we could find a fixed area for all the pictures where the garment was positioned. We then calculates the average color of that area. The results of both methods are shown in Figure 4. The second method gave better results given the generic layout of the product pictures. The first method had a disadvantage when it came to detect the contours of light-colored products.
Once the new system of color was obtained, we classified it in three different main colors - grey (which groups black, grey and white), blue, and colored (all other colors). To additionally simplify the classification, we added patterned products as "colors". An additional feature classification was also created to represent the lightness of the color (dark, medium and light).
JMJ
MM
Ocm
0
M JA
M
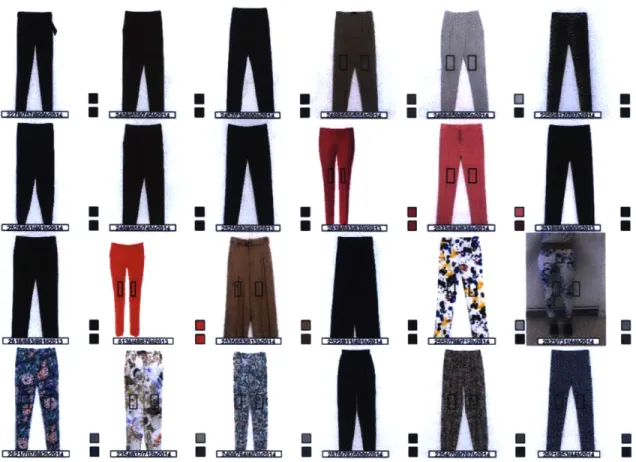
Figure 4: Illustration of the Color Detection Methods
For each image, the boxes at the bottom-right cormer represent the color detected by the algorithm. The bottom box is the color obtained when trying to detect the location of the product in the image. The detection of the product contours in the image is not optimal, especially for light-colored pants. The top box shows the color obtained when assuming that the product can always be found in the
same region of the image. Given the generic layout of the pictures, this method produced better results.
4.3 Results of the Classification
Figure 5 below shows the distribution of classified products across the above-defined categories. For the colors, the more represented groups are blue and grey, whereas there is a smaller number of patterned products and of products of colors other than grey and blue. For the fit, the collection includes a very large number of slim models, which is consistent with the fashion trend of the last few years. Finally, pants in the collection tend to be medium or dark-colored.
The sales of each trend can also be observed in Figure 6 for some stores in Madrid, from September 2013 to May 2014.
Percentage of Products by Feature
Color
flower/animal geometric grey -colored -blue -0% 10% 20% 30%Color lightness
light medium dark -I I I I 0% 10% 20% 30% 40%Fit
large straight -slim -0 Woman Trafaluc Basic -I I I I I % 10% 20% 30% 40%Buyer
I I I I I 0% 10% 20% 30% 40%Season
W13- S14-I I 0% 20%Figure 5: Classification of the products by characteristics (color, fit, color lightness, buyer and season)
The buyer classification represents Zara's three product lines.
Sales by Feature - Stores in Madrid
Fit
60% 40% -20% -Jan - jogging - large - slim - straight AprColor
- blue - colored - floweranimal geom - grey Jan AprColor Lightness
80%-60% -40% -20% - 0%-Oct JanFigure 6: Trends over the year of the products presenting various features for some stores in Madrid (fit, color, color lightness).
The lines represent the percentage of trousers by feature over time.
0% -Oct 60% 40% 20% -0% -Oct - dark - light - medium Apr
We present below the findings for the stores in Madrid based on the observations of Figures 5 and 6. However, the same trends were observed for the other stores in the data samples in London and Barcelona.
As expected, dark-colored, blue, grey and slim pants represent the majority of the sales. How-ever, two trends are interesting to note. The sales of the dark-colored, grey and blue pants decrease closer to summer, and lighter-colored and colored pants become more popular. This phenomenon is well-known as colors tend to sell better during the summer, while people tend to wear more neutral colors during the winter. In addition, the slim fit pants see their sales decline as the summer approaches, while large fit pants sales increase. The explanation for this trend may be less obvious - this could be a seasonal effect or a longer term trend.
Thus, additional work was necessary to obtain adequate attributes for each product in the trousers product category. The various methods used in this chapter can be adapted to the other product families. With this classification, we can therefore study the cannibalization or complementarity effects among products in a store.