Cancer-Stimulated Mesenchymal Stem Cells Create
a Carcinoma Stem Cell Niche via Prostaglandin E
The MIT Faculty has made this article openly available.
Please share
how this access benefits you. Your story matters.
Citation
Li, Hua-Jung, Ferenc Reinhardt, Harvey R. Herschman, and Robert
A. Weinberg. “ Cancer-Stimulated Mesenchymal Stem Cells Create
a Carcinoma Stem Cell Niche via Prostaglandin E₂ Sgnaling.” Cancer
Discovery 2, no. 9 (July 3, 2012): 840–855.
As Published
http://dx.doi.org/10.1158/2159-8290.CD-12-0101
Publisher
American Association for Cancer Research (AACR)
Version
Author's final manuscript
Citable link
http://hdl.handle.net/1721.1/116971
Terms of Use
Creative Commons Attribution-Noncommercial-Share Alike
Cancer-stimulated mesenchymal stem cells create a carcinoma
stem-cell niche via Prostaglandin E2 signaling
Hua-Jung Li1, Ferenc Reinhardt1, Harvey R. Herschman2, and Robert A. Weinberg1,3,4
1Whitehead Institute for Biomedical Research, Cambridge, MA 02142, USA
2Departments of Biological Chemistry and Pharmacology, Molecular Biology Institute, and
Jonsson Comprehensive Cancer Center, UCLA, Los Angeles, CA 90095, USA
3Department of Biology, Massachusetts Institute of Technology, Cambridge, MA 02139, USA 4MIT Ludwig Center for Molecular Oncology, Cambridge, MA 02139, USA
Abstract
Mesenchymal cells of the tumor-associated stroma are critical determinants of carcinoma cell behavior. We focus here on interactions of carcinoma cells with mesenchymal stem cells (MSCs), which are recruited to the tumor stroma and, once present, are able to influence the phenotype of the carcinoma cells. We find that carcinoma cell-derived interleukin-1 (IL-1) induces
prostaglandin E2 (PGE2) secretion by MSCs. The resulting PGE2 operates in an autocrine manner, cooperating with ongoing paracrine IL-1 signaling, to induce expression of a group of cytokines by the MSCs. The PGE2 and cytokines then proceed to act in a paracrine fashion on the carcinoma cells to induce activation of β-catenin signaling and formation of cancer stem cells. These
observations indicate that MSCs and derived cell types create a cancer stem-cell niche to enable tumor progression via release of PGE2 and cytokines.
Keywords
prostaglandin E2; mesenchymal stem cell; cancer stem cell; epithelial-mesenchymal transition; Interleukin-1
Introduction
Carcinoma cells recruit mesenchymal cells into the tumor-associated stroma; these mesenchymal cells then proceed to modify the stroma, helping to establish a tissue microenvironment that favors tumor progression. Paracrine signals emanating from the resulting tumor-associated stroma can subsequently modulate the behavior of the carcinoma cells (1).
Among the recruited stromal cells are bone marrow-derived mesenchymal stem cells (MSCs), which are known to exhibit multipotent differentiation potential (2). In the context of cancer pathogenesis, MSCs contribute to the formation of fibroblast and myofibroblast populations in the tumor-associated stroma (3, 4) and promote the growth, progression and
Corresponding author: Robert A. Weinberg, Whitehead Institute for Biomedical Research, 9 Cambridge Center, Cambridge, MA 02142, phone: 1-617-258-5159, fax: 1-617-258-5230, weinberg@wi.mit.edu.
NIH Public Access
Author Manuscript
Cancer Discov
. Author manuscript; available in PMC 2013 November 19.Published in final edited form as:
Cancer Discov. 2012 September ; 2(9): . doi:10.1158/2159-8290.CD-12-0101.
NIH-PA Author Manuscript
NIH-PA Author Manuscript
metastasis of tumors (3, 5, 6). Precisely how MSCs influence tumor progression is, however, poorly understood.
Elevated cyclo-oxygenase-2 (COX2) mRNA and protein levels are found in many malignant tissues and are often associated with poor clinical outcome (7). The tumor-enhancing effects of COX2 are generally ascribed to its role in producing prostaglandin E2 (PGE2), which has pleiotropic effects on cell proliferation, survival, angiogenesis, motility and invasiveness (8). In addition to the neoplastic cells themselves, cells of the tumor-associated stroma contribute to elevated COX2 expression (9, 10). However, it has been unclear whether the PGE2 that promotes tumor progression derives from neoplastic cells, fibroblasts, macrophages, or some combination of these cell types.
Independent of these questions is the issue of heterogeneity of the neoplastic cells within carcinomas. Observations of a variety of human cancer types have revealed the existence of tumor-initiating cells (TICs), often called cancer stem cells (CSCs), which coexist as minority populations within tumors together with a majority population of cancer cells that lack tumor-initiating ability (11). Passage by neoplastic epithelial cells through an epithelial-mesenchymal transition (EMT) allows these cells to approach the stem-cell state (12, 13). Moreover, EMT programs are known to be induced by heterotypic signals that epithelial cells receive from the microenvironment (14). However, the nature of these heterotypic signals and the identities of the stromal cells that release them remain poorly understood. We demonstrate here that, in response to stimulation by carcinoma cells, MSCs express greatly elevated levels of PGE2. The resulting PGE2, together with cytokines also induced in the MSCs, contribute to entrance of nearby carcinoma cells into a stem-cell-like state.
Results
PGE2 induction in MSCs following interaction with carcinoma cells
We initially studied the interactions in culture of LoVo and SW1116 human colorectal carcinoma cells with MSCs. Minimal PGE2 accumulation was observed in pure LoVo, SW1116 or MSC cultures monitored over a 72 h period (Fig. 1Aa and Supplementary Fig. S1A). However, PGE2 levels increased ~6.5 fold when the LoVo cells were cocultured with twice the number of MSCs for 48 h, and increased by ~60 fold after 72 h of coculture. Correspondingly, levels of the COX2 enzyme were also increased in the coculture (Fig. 1Ab). In contrast, there was no PGE2 increase in SW1116/MSC cocultures. Of note, PGE2 production was induced equally strongly in [LoVo][MSC] transwell cocultures, which only permitted their intercommunication via soluble factors (Supplementary Fig. S1B) and in MSCs treated with LoVo-conditioned medium (LoVoCM; Supplementary Fig. S1C and S1D). Hence, soluble factors secreted by LoVo cells were responsible for inducing PGE2 production by MSCs.
Other work (in Supplemental Data, Section 1; Supplementary Figure S1E) demonstrated that the secretion of IL-1β and IL-1α by carcinoma cell populations was correlated with their respective abilities to elicit PGE2 production in co-cultured MSCs. Thus, when MSCs were treated with recombinant IL-1β or IL-1α, the induced PGE2 levels were similar to or higher than those induced by LoVoCM (Fig. 1Ba). Conversely, IL-1α- and IL-1β-neutralizing antibodies attenuated by 60% the production of LoVoCM-induced PGE2 (Fig. 1Ba). In addition, shRNAs directed against IL-1α and IL-1β mRNAs expressed in LoVo cells decreased by 84% the ability of their CM to induce PGE2 in MSCs (Fig. 1Bb) and recombinant IL-1ra, a natural antagonist of the IL-1 receptor, attenuated by 73% the LoVoCM-induced PGE2 production by MSCs (Fig. 1Bc). IL-1 α/β secreted by the
NIH-PA Author Manuscript
NIH-PA Author Manuscript
carcinoma cells was largely responsible for the PGE2 production by MSCs, while IL-1ra could antagonize this induction.
Relationship of IL-1 production by carcinoma cells to their ability to induce PGE2
The levels of the IL-1α, IL-1β and IL-1ra mRNAs and secreted proteins were quantified in six human breast carcinoma cell lines and the SW1116 colorectal carcinoma cell line, in addition to the LoVo cells examined above. Cells of the LoVo, HCC1806, BT549, SUM149 and SUM159 lines expressed elevated levels of IL-1α and/or IL-1β, but relatively low levels of IL-1ra; conversely, MDA-MB-453, MDA-MB-231 and SW1116 cells secreted little or no detectable IL-1α/β and/or relatively high levels of IL-1ra (Supplementary Fig. S1F and Fig. 1Ca).
When cultured individually, the carcinoma cell lines expressed low or undetectable PGE2 levels (Fig. 1Cb). However, upon coculture with MSCs, the IL-1α/β-secreting carcinoma cells induced ~80–500-fold increases of COX2 and PGE2 production, while the carcinoma cells secreting low levels of IL-1α/β failed to stimulate COX2 or PGE2 formation
(Supplementary Fig. S1G and Fig. 1Cb). In addition, IL-1α-/IL-1β-neutralizing antibodies and IL-1ra attenuated PGE2 production induced in MSCs by the conditioned media from the various IL-1-secreting carcinoma cells (Supplementary Fig. S1H). Hence, the ability to stimulate PGE2 in MSCs appeared to be a frequent but not universal property of breast and colon carcinoma cells and was directly correlated with their abilities to signal via secreted IL-1α/β. Because IL-1α and IL-1β were both capable of PGE2 induction, we use the term “IL-1” to refer to both IL-1α and IL-1β in the text that follows.
Induction of cytokines in MSCs following their interaction with carcinoma cells
In addition to PGE2, GRO-α, IL-6, IL-8 and RANTES in the culture media of LoVoMSC cocultures increased by 34, 10, 79 and 21 fold respectively following 120 h of coculture (Fig. 2A). In [LoVo][MSC] transwell cultures, where direct contact between the LoVo cells and MSCs was prevented, PGE2, GRO-α, IL-6 and IL-8 were induced to comparable levels; in contrast, RANTES expression was not elevated (Fig. 2A). Following direct coculture, RANTES production occurred far more rapidly than did the accumulation of the other cytokines or PGE2 (Supplementary Fig. S2A).
We also found that GRO-α, IL-6 and IL-8, like PGE2, were induced by LoVoCM in MSCs (Supplementary Fig. S1B). To determine whether IL-1 was able, by itself, to induce concomitant production in MSCs of the three cytokines and PGE2, we assessed mRNAs levels in MSCs that had been treated for 48 h with vehicle or recombinant IL-1 (Fig. 2B). The resulting 10-fold and 4-fold increases in MSCs of COX2 and mPGES1 (a second PGE2 biosynthetic enzyme) mRNAs, the increase of COX-2 protein, and the 10~100-fold decrease of 15-PGDH mRNA (encoding the PGE2-degrading enzyme) confirmed the key role of IL-1 in modulating the levels of enzymes governing PGE2 production and accumulation in MSCs. Moreover, IL-1 treatment alone elicited substantial increases (36–440 fold) of IL-6, IL-8 and GRO-α mRNAs in MSCs. COX2, IL-6, IL-8 and GRO-α mRNA induction was detectable within 30 minutes of IL-1 exposure and reached a maximum at 1–2 h thereafter (Supplementary Fig. S2B). This key role of IL-1 was further confirmed by knocking down IL1α/β mRNAs in LoVo cells, resulting in a 60–90% decrease in the induced levels of IL-6, IL-8 and GRO-α mRNAs (Supplementary Fig. S2C). Thus, IL-1 was both necessary and sufficient to induce PGE2, IL-6, IL-8 and GRO-α production in MSCs.
We also confirmed that LoVoCM and IL-1 could induce comparable levels of PGE2 (Supplementary Fig. S2D) and cytokine (Supplementary Fig. S2E) in other types of mesenchymal cells that may arise from the differentiation of MSCs (4), including human
NIH-PA Author Manuscript
NIH-PA Author Manuscript
breast mesenchymal stem cells (bMSCs) isolated from a breast cancer patient, human colonic myofibroblasts (CCD-18co), and primary human mammary stromal fibroblasts.
Autocrine PGE2 cooperation with IL-1 paracrine signaling leading to PGE2 and cytokine production by MSCs
IL-8 and IL-6 are known to be induced in certain cells by PGE2 (15). To determine whether PGE2 played a role in the induction of these cytokines in MSCs, PGE2 production by MSCs was blocked with indomethacin, which inhibits the COX1 and COX2 enzymes. In LoVo/ MSC cocultures, GRO-α, IL-6 and IL-8 protein induction was reduced by 85–98% by indomethacin; moreover this induction could be partially rescued by providing PGE2 to indomethacin-treated cocultures (Fig. 2C). While PGE2 treatment alone could not induce GRO-α, IL-6 or IL-8 expression in LoVo cells or MSC cells, additional PGE2 potentiated the cytokine induction in LoVo/MSC cocultures and in IL-1-treated MSCs (Fig. 2C and Supplementary Fig. S2F).
MSCs expressed two distinct PGE2 cell-surface receptors, EP2 and EP4 (Supplementary Fig. S2G). To support the notion that MSC-derived PGE2 acted in an autocrine fashion, the EP2 and EP4 receptor antagonists AH6809 and GW627368X were added to MSC cultures, along with either LoVoCM or IL-1. LoVoCM- and IL-1-induced IL-6, IL-8 and GRO-α mRNA was suppressed by 60–80% by these EP receptor antagonists (Fig. 2D). Figure 2E summarized our model that (i) COX2, mPGES1 and PGE2 are initially induced in MSCs by IL-1 released by carcinoma cells and that (ii) the resulting PGE2, acting in an autocrine manner on MSCs, then cooperates with ongoing IL-1 paracrine signaling to trigger IL-6, IL-8 and GRO-α production by MSCs (Fig. 2E).
Effects of MSCs on carcinoma cell mesenchymal and invasive traits
Before further analyzing the interactions between the carcinoma cells and MSCs, we confirmed that, as reported by others (5, 16), MSCs are indeed recruited to IL-1-secreting tumors in vivo (described in Supplemental Data, Section 2; Supplementary Fig. S3A–B). Having done so, we further investigated the influence of MSCs on carcinoma cell behavior, more specifically by analyzing the effects of MSC coculture on the expression by the tumor cells of markers of EMT, a cell-biological program that imparts motility, invasiveness, and self-renewal to carcinoma cells (14). After culturing, either alone or together with tdTomato-MSCs (5 days), LoVo and HCC1806 cells were isolated by FACS and analyzed for E-cadherin, vimentin, fibronectin and β-actin protein expression (Fig. 3A). E-E-cadherin, the key epithelial marker, was decreased by 98–100% in both LoVo and HCC1806 cells cocultured with MSCs. Conversely, vimentin and fibronectin proteins – both mesenchymal markers – were robustly induced in both carcinoma cells (Fig. 3A). Moreover, expression of the Snail protein, an EMT-inducing transcription factor (EMT-TF), was increased 5–69 fold in the MSC:carcinoma cocultures (Fig. 3A).
We then determined whether PGE2 and/or the cytokines produced by MSCs in LoVo/MSC cocultures could elicit an EMT-like response in LoVo cells. PGE2 was able, on its own, to cause a decrease in E-cadherin protein in LoVo cells (Fig. 3B, ~70% decrease) but failed to elicit concomitant robust increases of mesenchymal markers, i.e., vimentin, and the Zeb1, Snail and Twist1 EMT-TFs (Fig. 3B).
In contrast to PGE2, IL-6 alone induced Zeb1 (7 fold), Snail (3 fold), and vimentin (3 fold) protein expression in LoVo cells, but was unable to decrease E-cadherin protein. However, treatment of LoVo cells with PGE2 together with the four cytokines induced both a decrease of E-cadherin protein expression (~80%) and increases of vimentin (9 fold), Zeb1 (14 fold), Snail (13 fold) and Twist1 (10 fold) protein expression (Fig. 3B). Hence, activation of a
NIH-PA Author Manuscript
NIH-PA Author Manuscript
more complete EMT program in the carcinoma cells required the concomitant activation of multiple signaling pathways, specifically those triggered in these cells by PGE2 acting together with the indicated cytokines.
Significantly more carcinoma cells invaded in LoVo/MSC cultures than in cultures of LoVo cells alone (Fig. 3C). To examine whether PGE2 played a critical role in the MSC-induced carcinoma cell invasiveness, LoVo/MSC cocultures were treated with NS398, a COX2 inhibitor; this treatment resulted in an 80% reduction of MSC-induced LoVo cell invasiveness (Fig. 3C). Greater than 60% of this inhibition could be reversed by adding PGE2 to these cocultures.
Also, LoVo cell invasion was significantly reduced by antibodies that neutralize either IL-6, GRO-α or RANTES (Fig. 3D). Accordingly, the MSC-induced carcinoma cell invasiveness appeared to derive from a confluence of PGE2, IL-6, GRO-α and RANTES signals
impinging on the LoVo cells.
We also examined possible effects of MSCs on carcinoma cell invasion in vivo. The carcinoma cells injected on their own formed reasonably well-encapsulated tumors (Fig. 3E, a, b, c). In contrast, the carcinoma cells co-injected with MSCs formed extensive invasive fronts that extended into adjacent muscle layers (Fig. 3E, d, e, f). In addition, we observed the intravasation of carcinoma cells into nearby microvessels (Fig. 3E, insert). To
summarize, these data indicated that MSCs facilitated LoVo cell invasion both in vitro and in vivo.
Effects of MSCs on tumor initiation by carcinoma cells
Since transformed epithelial cells that have undergone EMT contain larger subpopulations of TICs (12, 13, 17), we determined whether EMT induction of carcinoma cells by MSCs was similarly accompanied by an increase in tumor-initiating ability. When populations of 5 × 10⁴ IL-1-secreting carcinoma cells were co-injected with 2 × 10⁵ MSCs, their ability to give rise to palpable tumors was measurably increased (1/6 to 6/6 for LoVo, 1/6 to 6/6 for HCC1806, 0/6 to 5/6 for SUM159 and 1/6 to 5/6 for SUM149, Fig. 3F). In contrast, tumor initiation by 5 × 10⁴ MDA-MB-231 or MDA-MB-453 cells, neither of which secrete IL-1, was not increased by co-injection with 2 × 10⁵ MSCs.
We quantified these interactions more precisely by implanting limiting dilutions of LoVo cells at four dosages, together with 5 × 10⁵ admixed MSCs. The presence of admixed MSCs increased the tumor-initiating frequencies of 5 × 10⁵, 5 × 10⁴ and 5 × 10³ implanted LoVo cells from 4/6, 1/6 and 0/6 to 6/6, 6/6 and 6/6. (Fig. 3G). As judged by the ELDA (Extreme limiting dilution analysis) (18), the frequency of TICs in cultured LoVo cells was 9 × 10⁻⁷ – 6 × 10⁻⁵; in the presence of admixed MSCs this frequency increased to 1 × 10⁻³ – 1 × 10⁻² (Fig. 3H).
MSC-induced increases in ALDHhigh CSC-enriched population and tumor initiation
CSCs, which have some characteristics associated with normal stem cells, are cells defined operationally by their tumor-initiating ability (19). We validated the use of aldehyde dehydrogenase as a marker of tumor-initiating cells and thus CSCs (20, 21) (described in Supplemental Data, Section 3; Supplementary Fig. S4A–C and S5A–B). We observed that a 5-day coculture of LoVo or HCC1806 cells with MSCs resulted in ~7-fold and ~20-fold increases, respectively, in ALDH1 protein levels in the carcinoma cells (Fig. 4A and Supplementary Fig. S5C). To extend this observation, we cultured an unfractionated LoVo cell population or already-sorted ALDHhigh or ALDHlow LoVo cell subpopulations (Supplementary Fig. S4Ba), either alone or in the presence of a two-fold excess of
tdTomato-labeled MSCs, for 5 days. All three LoVo cell populations, when cocultured with
NIH-PA Author Manuscript
NIH-PA Author Manuscript
MSCs, developed larger subpopulations of ALDHhigh cells (59%, 38% and 18%) than when cultured alone (38%, 20% and 7%), i.e., 1.6- to 2.6-fold increases in ALDHhigh cells (Fig. 4Ba).
We also used FACS to remove the tdTomato-MSCs from LoVoMSC cocultures, then further propagated the LoVo cells for 5 days in the absence of MSCs. We found that the levels of the ALDHhigh LoVo cell subpopulations that had previously been increased by coculture with MSCs reverted to levels comparable to those observed in LoVo cells that had never experienced MSC coculture (Fig. 4Bb). Our data indicated that maintenance of elevated numbers of ALDHhigh LoVo cells depended on continuous interactions of the LoVo cells with MSCs.
Use of the ALDH marker as the sole stem-cell marker is likely to have led to an underestimate in the increase of the number of CSCs, since ALDHhigh cells are a CSC-enriched population rather than being a pure CSC population. In order to refine the markers used to identify CSCs, we determined that a LoVo subpopulation more enriched for CSCs could be identified by concomitant use of the ALDHhigh and CD133+ markers, which have been used to define CSCs in various cancer cell populations (22–25) (described in Section 3, Supplemental Data; Supplementary Fig. S6A–C). Indeed, in the LoVo cells cocultured for five days with MSCs, the ALDHhigh/CD133+ LoVo cells were increased from 1.4% to 16.4% of the overall cell population, i.e., a 11.7-fold increase (Supplementary Fig. S6C). We also determined whether the MSC-induced increase of ALDHhigh LoVo cells observed in culture was accompanied by an increase of TICs in LoVo cells. Limiting dilutions of sorted ALDHhigh and ALDHlow LoVo cells were injected subcutaneously into SCID mice, either alone or together with MSCs (Fig. 4Ca). As calculated using ELDA, the TIC frequency of ALDHhigh LoVo cells injected on their own was 4 × 10⁻⁵ – 3 × 10⁻⁴, while that of ALDHhigh LoVo coinjected with MSCs was 2 × 10⁻³ – 1 (Fig. 4Cb). For ALDHlow LoVo cells injected alone, the TIC frequency was 7 × 10⁻⁷ – 5 × 10⁻⁶; co-injection with MSCs increased this frequency to 3 × 10⁻⁴ – 2 × 10⁻³ (Fig. 4Cb). TIC frequencies of both ALDHhigh and ALDHlow LoVo cells were increased by several orders-of-magnitude when co-injected with MSCs.
The continued presence of MSCs in the implanted cell populations complicates
interpretation of the direct effects of MSC on the tumor initiation of carcinoma cells, since the MSCs might affect tumor initiation by a number of different mechanisms. To address this issue, LoVo cells or HCC1806 cells were isolated by FACS from 5-day carcinoma cell/ tdTomato-MSC cocultures and were then immediately injected subcutaneously into SCID mice, in parallel with LoVo cells previously cultured alone, in order to determine the effect on the tumor initiation of the cell culture interactions (Fig. 4D and Supplementary Fig. S7A). Accordingly, TIC frequencies of LoVo cells were increased by one order-of-magnitude following 5-day co-culture with MSCs in vitro (Supplementary Fig. S7B). An increase of tumor initiation by prior co-culture with MSCs was also observed on HCC1806 cells (Supplementary Fig. S7C).
Influence of PGE2 signaling on the ALDHhigh CSC state
To understand more precisely how the signals exchanged between carcinoma cells and MSCs led to increases in ALDHhigh CSCs, we first ascertained whether PGE2 and/or cytokines produced by MSCs in LoVo/MSC cocultures could elicit ALDH1 expression. Only PGE2 was able, on its own, to elicit an increase in ALDH1 expression in LoVo cells (Fig. 5A). Moreover, when PGE2 was combined with the four cytokines there was no further increase in ALDH1 expression.
NIH-PA Author Manuscript
NIH-PA Author Manuscript
EP4 is the only PGE2 receptor highly expressed by LoVo cells (Supplementary Fig. S2G). To elucidate in more depth the effects of PGE2 on LoVo cells, we treated these cells with vehicle or PGE2 for 5 days. The vehicle-treated cultures contained 10.3% ALDHhigh LoVo cells, while the LoVo cells treated with PGE2 contained ~25% ALDHhigh LoVo cells (Fig. 5B). We added GW627368X (the EP4 receptor antagonist) to LoVo cells to determine whether the basal, unperturbed levels of ALDHhigh cells depended on ongoing PGE2 autocrine signaling; this treatment reduced by ~60% the basal level of ALDHhigh LoVo cells (Fig. 5B). These data suggested that within LoVo cells, subpopulations of cells are
maintained in an ALDHhigh state in part through ongoing, low-level autocrine PGE2
signaling. Moreover, this signaling and associated entrance into the ALDHhigh state could be enhanced by exogenously supplied PGE2.
The observed increase in ALDH1 expression induced by PGE2 was not confined to LoVo cells. PGE2 treatment induced elevated ALDH1 expression (2.9 – 12.9 fold) in LoVo, SUM149, SUM159 and BT549 cells (Fig. 5C), all of which were previously found to elicit increased PGE2 production from cocultured MSCs.
The LoVo cells that had been treated ex vivo with vehicle or PGE2 for 5 days were
implanted subcutaneously in SCID mice. Tumors derived from control LoVo cells occurred in 3 of 16 injected hosts, while the corresponding PGE2-treated cells formed tumors in 18 of 24 hosts (Fig. 5D). Hence, a substantial increase in ALDHhigh cells and TICs could be achieved by PGE2 treatment of LoVo cells ex vivo. Moreover, treating LoVo cells with the cocktail of cytokines (IL-6, IL-8, Gro-α and RANTES) in addition to PGE2 did not significantly increase the tumor initiation beyond that observed for PGE2 treatment alone (Supplementary Fig. S8). In addition to its effects on TICs, PGE2 is likely to contribute to the maintenance of CSCs in vivo by increasing tumor angiogenesis (Supplementary Fig. S9, discussed in Supplemental Data, section 4).
Role of PGE2 signaling in the MSC-induced ALDHhigh CSC-enriched population and tumor initiation
To confirm that the above-described role of PGE2 could explain the ability of MSCs to induce CSC formation, we inhibited PGE2 synthesis with NS398, or PGE2 signaling with GW627368X, in cocultures of LoVo cells and tdTomato-MSCs. Blocking PGE2 signaling by either route prevented most of the increases in ALDHhigh LoVo CSCs by MSCs (described in Section 5, Supplemental Data; Supplementary Fig. S10). LoVo cells that had been cocultured under the various conditions with MSCs for 5 days were sorted by FACS to eliminate tdTomato-MSCs and were then injected subcutaneously into SCID mice. The increase in TIC frequencies resulting from a 5-day coculture with MSCs (from 4/20 to 14/19) was prevented by introducing either NS398 or GW627368X into the cocultures (from 14/19 to 3/17 or 1/12, respectively, Fig. 5E). Adding PGE2 to the cocultures along with NS398 restored the tumor-initiating frequency from 3/17 to 7/8.
To validate the role of COX2 in these properties, we knocked down COX2 in MSCs. The ability of the resulting MSCshcox-2 cells to produce PGE2 in response to LoVoCM was reduced by 90% (Fig. 5Fa). The tumor-initiating frequency of 5 × 10⁴ LoVo cells was increased from 1/12 to 10/12 by co-injection with MSCs expressing a control, scrambled shRNA (MSCshsc cells; Fig. 5Fb). In contrast, in mice co-injected with MSCshcox2 cells, the tumor-initiating frequency of LoVo cells was increased from 1/12 to only 3/12, supporting the notion that COX2-dependent PGE2 induced in MSCs was required for the observed robust increases of LoVo TICs.
NIH-PA Author Manuscript
NIH-PA Author Manuscript
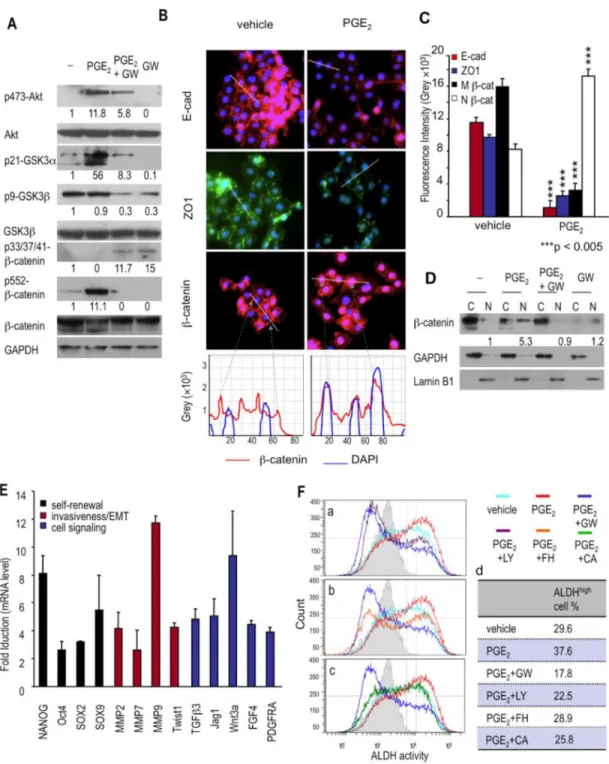
PGE2 induces β-catenin nuclear localization and transactivation
The β-catenin signaling pathway has been implicated in maintaining stem cell and CSC homeostasis in most epithelial tissues (26, 27). Relevant here is the finding that PGE2 treatment leads to Akt activation; activated Akt subsequently stimulates β-catenin signaling in several ways (28, 29). Accordingly, we examined activation of Akt/GSK-3/β-catenin signaling axis in LoVo cells treated with vehicle, PGE2, GW627368X, or GW627368X + PGE2. We found that PGE2 treatment led to a 12-fold increase in Akt phosphorylation at Thr473 (Fig. 6A), which indicates functional Akt activation (30). Conversely, inhibiting PGE2 signaling with GW627368X in PGE2-treated LoVo cells blocked 50% of the PGE2 -induced Akt phosphorylation (Fig. 6A). Moreover, β-catenin activity is positively affected by Akt-mediated phosphorylation of its Ser552 residue (31, 32). PGE2 treatment of LoVo cells, which caused a 12-fold increase of Akt phosphorylation, also increased β-catenin phosphorylation at Ser552 (11 fold), an increase that was blocked entirely by GW627368X treatment (Fig. 6A).
Akt also enhances β-catenin by phosphorylating and thereby inactivating glycogen synthase kinase-3 (GSK3); this prevents inactivation of β-catenin by unphosphorylated GSK3, since Ser21-unphosphorylated GSK-3α and Ser9-unphosphorylated GSK-3β phosphorylate β-catenin at its Ser33/Ser37/Thr41 residues, leading to its degradation (33, 34). PGE2 strongly increased the phosphorylation of GSK-3α at Ser21 (56 fold above basal level, Fig. 6A). Although Ser9 of GSK-3 was already phosphorylated prior to PGE2 treatment, this basal level of GSK-3β Ser9 phosphorylation was reduced (70%) by adding GW627368X (Fig. 6A), presumably by blocking basal autocrine PGE2 signaling. Inhibition of PGE2 signaling by GW627368X prevented the inactivating phosphorylation of GSK-3α and GSK-3β and, conversely, increased phosphorylation of β-catenin at Ser33/Ser37/Thr41 residues 15 fold that lead to its degradation (Fig. 6A). These data indicated that inhibition of PGE2 signaling leads to β-catenin phosphorylation, a prelude to its proteasomal degradation.
A strong inhibition of catenin signaling is also achieved by E-cadherin, which recruits β-catenin to adherens junctions associated with the plasma membrane, thereby preventing its nuclear localization and its actions in promoting transcription (35). PGE2 decreased the E-cadherin and ZO-1 protein located at the cell junctions (Fig. 6B and 6C). Correspondingly, in PGE2-treated LoVo cells β-catenin was found in cell nuclei, rather than being sequestered by E-cadherin in adherens junctions, (Fig. 6B and 6C). PGE2 caused a 5.3-fold increase of β-catenin in the nuclear fraction; this increase was blocked by adding the EP4 antagonist during PGE2 treatment (Fig. 6D). We also found, by analyzing expression in LoVo carcinoma cells of a number of β-catenin/TCF-regulated genes, that PGE2–induced nuclear β-catenin was functionally active (Fig. 6E).
PGE2-induced effects on ALDHhigh cancer cells are mediated by β-catenin signaling
PGE2 induces Akt phosphorylation in carcinoma cells in a phosphatidylinositol 3-kinase (PI3K)-dependent manner (28). To determine if the activation of the Akt/GSK-3/β-catenin signaling axis was required for PGE2-induced ALDHhigh LoVo CSCs, we treated ALDHhigh LoVo cells with vehicle, PGE2, GW627368X, LY294002 (a PI3K inhibitor), FH353 (a β-catenin/TCF inhibitor), or cardamonin (a β-catenin inhibitor) for 5 days at concentrations that did not cause significant cell death.
LY294002 functioned as efficiently as the EP4 antagonist by completely blocking the exogenous PGE2-induced increase of ALDHhigh LoVo cells and by decreasing the
endogenous PGE2-maintained basal ALDHhigh LoVo cells (Fig. 6F, a and d). Although the two β-catenin inhibitors, FH353 and cardamonin, blocked the PGE2-induced increase of ALDHhigh LoVo cells (Fig. 6Fb and 6Fc), these inhibitors did not function as effectively as
NIH-PA Author Manuscript
NIH-PA Author Manuscript
the EP4 antagonist or the PI3K inhibitor. PGE2/EP4 signaling, acting through the Akt/ GSK-3/β-catenin signaling axis (28), contributes to induction of the ALDHhigh LoVo cell phenotype.
Contribution of MSCs in tumor stroma to the stem-cell niche of ALDHhigh CSCs
PGE2 is metabolically unstable and is thought to act within tissues over short distances, doing so in both an autocrine and a paracrine manner. Wishing to pursue this notion further, we examined whether ALDHhigh CSCs were located near MSCs (or their mesenchymal derivatives) in tumors that arose following the coinjection of these two cell types. ALDHhigh LoVo cells (Fig. 7Aa, red signal) were often surrounded by tdTomato-labeled MSCs (Fig. 7Aa, green signal) or their derivatives in tissue sections of LoVo/MSC xenografts; in addition, many of these mesenchymal cells expressed COX2 (Fig.7Aa, cyan signal). Moreover, the mesenchymal cells associated with the ALDHhigh tumor cells expressed FSP, the fibroblast marker (Fig 7Ab, red signal; discussed in Supplemental Data, section 6; Supplementary Fig. S11), indicating that the MSC-derived fibroblasts rather than their MSC precursors were largely responsible for forming the stromal microenvironment of these ALDHhigh cells. The conclusion that PGE2 induces the formation of ALDHhigh CSCs was further supported by human colorectal adenocarcinoma studies in which we found the juxtaposition within tumors of such CSCs with stroma expressing COX2, the likely source of PGE2 production (discussed in Supplemental Data, section 7; Supplementary Fig. S12A– B). These observations lead us to propose that MSCs (or their differentiated derivatives) create a niche within tumors, leading to induction and/or maintenance of CSC
subpopulations.
Correlation of COX2 expression with CSC properties and a more aggressive tumor phenotype
To determine whether elevated IL-1 production correlates with COX2/PGE2 expression in human primary carcinomas, we compared the normalized IL-1α, IL-1β and COX2 mRNA levels across 19 human normal colon and 123 human colon carcinoma samples and across 178 human invasive breast carcinoma samples [Cancer Genome Atlas analyzed by Oncomine™]. IL-1α and IL-1β were expressed at significantly higher levels (9.6 fold and 4.7 fold in colon carcinoma and 2.1 fold and 2.1 fold in breast carcinoma) in aggressive subtypes of samples --- colon mucinous carcinoma and Triple-negative breast carcinoma (TNBC) respectively (Fig. 7B). Moreover, the COX2 mRNA levels were correlated with the IL-1α and IL-1β mRNA levels; COX2 mRNA was elevated 5.4 fold and 5.3 fold in colon mucinous carcinoma and TNBC when compared to normal colon samples and other breast cancers (Fig. 7B). These correlations suggested that the signaling mechanisms described above (Fig. 7C), involving IL-1 activated expression of COX2/PGE2, may be relevant to understanding the pathogenesis of colon mucinous carcinomas and TNBCs.
Discussion
Elevated IL-1 expression has been correlated with increased malignant progression and more aggressive phenotypes in many types of cancer (36). However, the mechanism(s) underlying this correlation have been unclear. We describe here a bidirectional, reciprocal interaction between carcinoma cells and the MSCs (Fig. 7C). The signaling is initiated through the release of IL-1 by carcinoma cells. We present evidence that appears to explain this connection between IL-1 production and increased tumor aggressiveness in many, and perhaps all IL-1-secreting carcinomas.
IL-1 secreted by carcinoma cells induces COX2 and mPGES1 expression in MSCs. The two enzymes collaborate in MSCs to generate PGE2 levels, which can increase by 80 to 500 fold
NIH-PA Author Manuscript
NIH-PA Author Manuscript
(Fig. 1Cb). Of note, we show these responses operate equally well in MSCs and in their more differentiated descendants (Supplementary Fig. S2D and S2E). We note that others recently reported that IL-1 secreted by head-and-neck squamous cell carcinoma cells induce PGE2 from fibroblasts (37). Consequently, fibroblasts and myofibroblasts, both of which accumulate in large numbers in the stroma, may also represent sources of the PGE2 and the subsequently produced cytokines described here.
Importantly, while COX2 is highly expressed in both neoplastic and stromal cells in tumors, not all COX2-expressing cells can produce PGE2. Thus, despite large variations in COX2 expression, the colorectal carcinoma cell lines that we examined produced only about 10–40 pg/ml of PGE2 (Supplementary Fig. S1A). These levels are dwarfed by the 15,000–40,000 pg/ml of produced by the IL-1-stimulated MSCs studied here (Fig. 1Cb). This failure by COX2-expressing carcinoma cells to produce significant levels of PGE2 may be due to the absence in many carcinoma cells of significant levels of mPGES1 expression
(Supplementary Fig. S1A and S1D). Hence, COX2 expression, on its own, is unlikely to provide an accurate indication of PGE2 production by carcinomas.
MSC-produced PGE2 acts in two ways within such tumors – in an autocrine fashion on the MSCs that produced it and in a paracrine fashion on the nearby IL-1-releasing carcinoma cells. The MSC autocrine signaling elicits a second wave of signaling responses: In collaboration with ongoing paracrine IL-1 signaling from carcinoma cells, the autocrine PGE2 induces IL-6, IL-8, GRO-α and RANTES cytokines in the MSCs. Together, these MSC-derived molecules induce a third wave of responses that profoundly alter the carcinoma cells that initiated this signaling cascade (Fig. 2E and 7C).
The changes induced in carcinoma cells by the confluence of PGE2 and cytokine signals are all components of the complex cell-biological program termed the EMT. While this program has been increasingly implicated in the acquisition of phenotypes associated with high-grade malignancy (14), major questions concerning the EMT have remained unanswered. Among them are the paracrine signals, ostensibly of stromal origin, that trigger the EMT in carcinoma cells. Here we present a scenario that explains how the EMT can be induced in carcinoma cells by a reactive stroma.
The present work also addresses another longstanding puzzle concerning the EMT: Is it usually activated as a single, coherent program or, alternatively, are distinct components of this program activated separately, each by a distinct set of heterotypic signals? Our observations indicate that the latter scenario is more likely. For example, PGE2 caused a decrease of E-cadherin expression in carcinoma cells, while cytokines were required to induce the vimentin and ZEB1 expression that is usually depicted as intrinsic components of EMT program (Fig. 3B). Such responses suggest the possibility that, during the course of spontaneous tumor progression, some carcinoma cells may receive only a subset of these signals and accordingly only activate portions of the EMT program, while others receiving the complete suite of heterotypic signaling molecules may pass through an entire EMT program.
Research by ourselves and others has connected EMT with entrance into a stem-cell like state, both in normal and neoplastic epithelial cells (12, 13, 17). These findings are also echoed by the present work, in which we observe a concomitant entrance into the
mesenchymal and stem-cell states in response to MSC-derived heterotypic signals. PGE2, which activated portions of the EMT program, was able to increase both the number of CSCs and the frequency of tumor initiation (Fig. 5A–5D). Our findings here further clarify the connection of EMT with entrance into a stem-cell like state by showing that the partial EMT induced by PGE2, which represses cell-cell junctions without inducing mesenchymal
NIH-PA Author Manuscript
NIH-PA Author Manuscript
traits, suffices to increase CSCs. The observation of MSC-induced increases in CSCs is consistent with the recent finding of prostaglandin-induced increases in the number of CD44+ tumor cells (38, 39). The unique contribution of PGE2 is underscored by the observation that other MSC-derived cytokines, when combined with PGE2, had only marginal effects on further increasing the TIC frequency (Supplementary Fig. S8). In earlier work (27), we documented an alternative means of activating the EMT program that involves canonical and non-canonical Wnts together with TGFβ. Those findings echoed the present observations, since both studies demonstrated that multiple distinct heterotypic signals, acting in concert, are required to activate an EMT in carcinoma cells. These earlier findings left open the possibility that other EMT-inducing signals beyond those documented at the time may converge on the Wnt and TGFβ signaling pathways to activate EMT programs. We note here that PGE2-activated signals do, indeed, converge on one of these signaling cascades by activating β-catenin signaling, the same pathway that represents the main signaling channel lying downstream of canonical Wnt signaling.
In tumors that arise from IL-1-producing carcinoma cells, we find that this interleukin plays a critical role in the tumor cell-induced COX2/mPGES1/PGDH/PGE2 response in MSCs that is required for tumor progression. IL-1 blockage has been used in thousands of patients to control infection and inflammatory disease and has a remarkable safety record (40). Based on our findings and the existing clinical use of IL-1 inhibitors, IL-1 inhibition may present a promising alternative to COX2 inhibitors for cancer therapy. In addition, limited therapeutic options are currently available for TNBCs, which produce higher levels of IL-1 (Fig. 7B), because they are unresponsive to standard receptor-mediated treatments.
Accordingly, our findings suggest a possible option for treating these aggressive subtypes of breast and colon cancer.
Materials and Methods
Cell Culture
Human carcinoma cell lines HCC1806, BT549, MDA-MB-231, -453, SW1116 and LoVo were obtained from ATCC and human bone-marrow derived MSC (Sciencell) were obtained from Sciencell. SUM149 and SUM159 cells were provided by SP Ethier (Wayne State University). The human carcinoma cell lines SUM149, SUM159, BT549, MDA-MB-231, -453, SW1116 and LoVo were authenticated by microarray analysis. HCC1806 and MSC were not passaged more than 6 months after receipt.
Animal experiments
All research involving animals complied with protocols approved by the MIT Committee on Animal Care. In experiments evaluating tumor initiation and growth, the tumors were isolated and weighed at the end of each experiment. To measure TIC frequency, serial dilutions of cancer cell suspensions were injected subcutaneously into nude mice. TIC frequencies of the samples were determined using the ELDA web tool at http:// bioinf.wehi.edu.au/software/elda.
ALDH activity assay
ALDH activities of the carcinoma cells were measured with the ALDEFLUOR® fluorescent reagent system (STEMCELL Technologies), according to the manufacturer's protocol.
NIH-PA Author Manuscript
NIH-PA Author Manuscript
PGE2 and cytokine assays
The concentrations of PGE2 and cytokines were determined by ELISA as described in the manufacturers' protocols. PGE2 levels were measured using a PGE2 EIA assay kit (GE healthcare). Human cytokine levels were measured using Quantikine kits (R&D systems).
Supplementary Material
Refer to Web version on PubMed Central for supplementary material.
Acknowledgments
We thank members of the Weinberg lab (Wai Leong Tam, Michael Hwang) and the Herschman lab (Tomo-o Ishikawa, Art Catapang) for discussion and technical support; the Whitehead Flow Cytometry Core for technical support; Sarah Dry and the UCLA TPCL for providing colon adenocarcinoma samples. This research was supported by the National Institutes of Health/National Cancer Institute (R.A.W.: CA12515 and DE020817 and H.R.H: R01CA123055 and P50CA086306), Massachusetts Institute of Technology Ludwig Center for Molecular Oncology (R.A.W.), Breast Cancer Research Foundation (R.A.W.), and Susan G. Komen for the Cure (H.L.)
References
1. Bhowmick NA, Moses HL. Tumor-stroma interactions. Curr Opin Genet Dev. 2005; 15:97–101. [PubMed: 15661539]
2. Salem HK, Thiemermann C. Mesenchymal stromal cells: current understanding and clinical status. Stem Cells. 2010; 28:585–596. [PubMed: 19967788]
3. Karnoub AE, Dash AB, Vo AP, Sullivan A, Brooks MW, Bell GW, et al. Mesenchymal stem cells within tumour stroma promote breast cancer metastasis. Nature. 2007; 449:557–563. [PubMed: 17914389]
4. Mishra PJ, Humeniuk R, Medina DJ, Alexe G, Mesirov JP, Ganesan S, et al. Carcinoma-associated fibroblast-like differentiation of human mesenchymal stem cells. Cancer Res. 2008; 68:4331–4339. [PubMed: 18519693]
5. Quante M, Tu SP, Tomita H, Gonda T, Wang SS, Takashi S, et al. Bone marrow-derived myofibroblasts contribute to the mesenchymal stem cell niche and promote tumor growth. Cancer Cell. 2011; 19:257–272. [PubMed: 21316604]
6. Liu S, Ginestier C, Ou SJ, Clouthier SG, Patel SH, Monville F, et al. Breast cancer stem cells are regulated by mesenchymal stem cells through cytokine networks. Cancer Res. 2011; 71:614–624. [PubMed: 21224357]
7. Menter DG, Schilsky RL, DuBois RN. Cyclooxygenase-2 and cancer treatment: understanding the risk should be worth the reward. Clin Cancer Res. 2010; 16:1384–1390. [PubMed: 20179228] 8. Wang D, Dubois RN. Eicosanoids and cancer. Nat Rev Cancer. 2010; 10:181–193. [PubMed:
20168319]
9. Ishikawa TO, Herschman HR. Tumor formation in a mouse model of colitis-associated colon cancer does not require COX-1 or COX-2 expression. Carcinogenesis. 2010; 31:729–736. [PubMed: 20061361]
10. Le Bitoux MA, Stamenkovic I. Tumor-host interactions: the role of inflammation. Histochem Cell Biol. 2008; 130:1079–1090. [PubMed: 18953558]
11. Bomken S, Fiser K, Heidenreich O, Vormoor J. Understanding the cancer stem cell. Br J Cancer. 2010; 103:439–445. [PubMed: 20664590]
12. Mani SA, Guo W, Liao MJ, Eaton EN, Ayyanan A, Zhou AY, et al. The epithelial-mesenchymal transition generates cells with properties of stem cells. Cell. 2008; 133:704–715. [PubMed: 18485877]
13. Guo W, Keckesova Z, Donaher JL, Shibue T, Tischler V, Reinhardt F, et al. Slug and Sox9 cooperatively determine the mammary stem cell state. Cell. 2012; 148:1015–1028. [PubMed: 22385965]
14. Thiery JP, Acloque H, Huang RY, Nieto MA. Epithelial-mesenchymal transitions in development and disease. Cell. 2009; 139:871–890. [PubMed: 19945376]
NIH-PA Author Manuscript
NIH-PA Author Manuscript
15. Tipton DA, Flynn JC, Stein SH, Dabbous M. Cyclooxygenase-2 inhibitors decrease
interleukin-1beta-stimulated prostaglandin E2 and IL-6 production by human gingival fibroblasts. J Periodontol. 2003; 74:1754–1763. [PubMed: 14974816]
16. Houghton J, Stoicov C, Nomura S, Rogers AB, Carlson J, Li H, et al. Gastric cancer originating from bone marrow-derived cells. Science. 2004; 306:1568–1571. [PubMed: 15567866] 17. Morel AP, Lievre M, Thomas C, Hinkal G, Ansieau S, Puisieux A. Generation of breast cancer
stem cells through epithelial-mesenchymal transition. PLoS One. 2008; 3:e2888. [PubMed: 18682804]
18. Hu Y, Smyth GK. ELDA: extreme limiting dilution analysis for comparing depleted and enriched populations in stem cell and other assays. J Immunol Methods. 2009; 347:70–78. [PubMed: 19567251]
19. Visvader JE. Cells of origin in cancer. Nature. 2011; 469:314–322. [PubMed: 21248838] 20. Douville J, Beaulieu R, Balicki D. ALDH1 as a functional marker of cancer stem and progenitor
cells. Stem Cells Dev. 2009; 18:17–25. [PubMed: 18573038]
21. Huang EH, Hynes MJ, Zhang T, Ginestier C, Dontu G, Appelman H, et al. Aldehyde
dehydrogenase 1 is a marker for normal and malignant human colonic stem cells (SC) and tracks SC overpopulation during colon tumorigenesis. Cancer Res. 2009; 69:3382–3389. [PubMed: 19336570]
22. Ma S, Chan KW, Lee TK, Tang KH, Wo JY, Zheng BJ, et al. Aldehyde dehydrogenase discriminates the CD133 liver cancer stem cell populations. Molecular cancer research : MCR. 2008; 6:1146–1153. [PubMed: 18644979]
23. Silva IA, Bai S, McLean K, Yang K, Griffith K, Thomas D, et al. Aldehyde dehydrogenase in combination with CD133 defines angiogenic ovarian cancer stem cells that portend poor patient survival. Cancer research. 2011; 71:3991–4001. [PubMed: 21498635]
24. Lin L, Liu Y, Li H, Li PK, Fuchs J, Shibata H, et al. Targeting colon cancer stem cells using a new curcumin analogue, GO-Y030. British journal of cancer. 2011; 105:212–220. [PubMed:
21694723]
25. Kryczek I, Liu S, Roh M, Vatan L, Szeliga W, Wei S, et al. Expression of aldehyde dehydrogenase and CD133 defines ovarian cancer stem cells. International journal of cancer Journal international du cancer. 2012; 130:29–39. [PubMed: 21480217]
26. Reya T, Clevers H. Wnt signalling in stem cells and cancer. Nature. 2005; 434:843–850. [PubMed: 15829953]
27. Scheel C, Eaton EN, Li SH, Chaffer CL, Reinhardt F, Kah KJ, et al. Paracrine and autocrine signals induce and maintain mesenchymal and stem cell States in the breast. Cell. 2011; 145:926– 940. [PubMed: 21663795]
28. Castellone MD, Teramoto H, Williams BO, Druey KM, Gutkind JS. Prostaglandin E2 promotes colon cancer cell growth through a Gs-axin-beta-catenin signaling axis. Science. 2005; 310:1504– 1510. [PubMed: 16293724]
29. Dorsam RT, Gutkind JS. G-protein-coupled receptors and cancer. Nat Rev Cancer. 2007; 7:79–94. [PubMed: 17251915]
30. Fayard E, Xue G, Parcellier A, Bozulic L, Hemmings BA. Protein kinase B (PKB/Akt), a key mediator of the PI3K signaling pathway. Curr Top Microbiol Immunol. 2010; 346:31–56. [PubMed: 20517722]
31. He XC, Yin T, Grindley JC, Tian Q, Sato T, Tao WA, et al. PTEN-deficient intestinal stem cells initiate intestinal polyposis. Nat Genet. 2007; 39:189–198. [PubMed: 17237784]
32. Sun J. Enteric Bacteria and Cancer Stem Cells cancers. 2011; 3:285–297.
33. Haq S, Michael A, Andreucci M, Bhattacharya K, Dotto P, Walters B, et al. Stabilization of beta-catenin by a Wnt-independent mechanism regulates cardiomyocyte growth. Proc Natl Acad Sci U S A. 2003; 100:4610–4615. [PubMed: 12668767]
34. Fukumoto S, Hsieh CM, Maemura K, Layne MD, Yet SF, Lee KH, et al. Akt participation in the Wnt signaling pathway through Dishevelled. J Biol Chem. 2001; 276:17479–17483. [PubMed: 11278246]
NIH-PA Author Manuscript
NIH-PA Author Manuscript
35. Orsulic S, Huber O, Aberle H, Arnold S, Kemler R. E-cadherin binding prevents beta-catenin nuclear localization and beta-catenin/LEF-1-mediated transactivation. J Cell Sci. 1999; 112(Pt 8): 1237–1245. [PubMed: 10085258]
36. Miller LJ, Kurtzman SH, Anderson K, Wang Y, Stankus M, Renna M, et al. Interleukin-1 family expression in human breast cancer: interleukin-1 receptor antagonist. Cancer Invest. 2000; 18:293–302. [PubMed: 10808364]
37. Alcolea S, Anton R, Camacho M, Soler M, Alfranca A, Aviles-Jurado FX, et al. Interaction between head and neck squamous cell carcinoma cells and fibroblasts in the biosynthesis of PGE2. J Lipid Res. 2012; 53:630–642. [PubMed: 22308510]
38. Rudnick JA, Arendt LM, Klebba I, Hinds JW, Iyer V, Gupta PB, et al. Functional heterogeneity of breast fibroblasts is defined by a prostaglandin secretory phenotype that promotes expansion of cancer-stem like cells. PLoS One. 2011; 6:e24605. [PubMed: 21957456]
39. Ishimoto T, Oshima H, Oshima M, Kai K, Torii R, Masuko T, et al. CD44+ slow-cycling tumor cell expansion is triggered by cooperative actions of Wnt and prostaglandin E2 in gastric tumorigenesis. Cancer science. 2010; 101:673–678. [PubMed: 20028388]
40. Dinarello CA. Why not treat human cancer with interleukin-1 blockade? Cancer Metastasis Rev. 2010; 29:317–329. [PubMed: 20422276]
NIH-PA Author Manuscript
NIH-PA Author Manuscript
Significance
While prostaglandin E2 has been implicated time and again in fostering tumorigenesis, its effects on carcinoma cells that contribute specifically to tumor formation are poorly understood. Here we show that tumor cells are able to elicit a strong induction of the COX2/mPGES1/PGE2 axis in mesenchymal stem cells recruited to the tumor-associated stroma by releasing IL-1, which in turn elicits a mesenchymal/stem-cell-like phenotype in the carcinoma cells.
NIH-PA Author Manuscript
NIH-PA Author Manuscript
Fig. 1. Carcinoma cell secreted IL-1 induces PGE2 production in MSCs
(A) PGE2 (Panel a) and COX-2 (Panel b) were measured in the indicated CM or cultures. PGE2 data are means ± SE, n = 3. ***p < 0.005 (vs that in LoVo medium). LoVo+MSC; LoVo lysate and MSC lysate mixed in equal amounts; LoVoMSC, lysate of LoVoMSC coculture. The same nomenclature applies to the SW1116 cells. (B) Panel (a) MSCs were treated with LoVoCM, LoVoCM with neutralizing antibodies (500 ng/ml), or IL-1 only. Panel (b) MSCs were cocultured with LoVo cells expressing shRNAs against IL1α+IL1β (LoVoshIL1αβ-1, LoVoshIL1αβ-2), IL1β (LoVoshIL1β-1, LoVoshIL1β-2), or a scrambled sequence (LoVoshsc). Panel (c) MSCs were treated with DME, LoVoCM, or LoVoCM +IL-1ra. After incubation, media were collected and assayed for PGE2. Data are means ±
NIH-PA Author Manuscript
NIH-PA Author Manuscript
SE, n = 3. (C) Panel (a) IL-1α, IL-1β, and IL-1ra protein levels in CM of the carcinoma cells. Data are means ± SE, n = 3. Panel (b) PGE2 levels in carcinoma cells, MSCs (M), and co-cultures of the carcinoma cells with MSCs. Data are means ± SE, n = 3. ***p < 0.005 (vs that in MSC culture).
NIH-PA Author Manuscript
NIH-PA Author Manuscript
Fig. 2. IL-1 and PGE2 mediate GRO-α, IL-6 and IL-8, but not RANTES induction in carcinoma cell-MSC coculture
(A) Levels of PGE2 and the cytokines were measured in CM from the cultures. Data are means ± SE, n = 3. **p < 0.01, ***p < 0.005 (vs that in MSC culture). (B) mRNA levels of the enzymes governing PGE2 production and the cytokines (upper panel) and COX2 protein levels (lower panel) in MSCs treated with IL-1 as indicated. Data are means ± SE, n = 3. *p < 0.05, **p < 0.01, ***p < 0.005 (vs control). (C) Cytokine levels in CM from MSCs, LoVo cells and LoVoMSC cocultures, in the presence of indomethacin (indo; 100 µM), PGE2 (100 nM), or Indo + PGE2. Data are means ± SE, n = 3. (D) IL-6, IL-8 and Gro-α mRNA
induction in MSCs either by LoVoCM or by IL-1 in the presence of EP2 and EP4
NIH-PA Author Manuscript
NIH-PA Author Manuscript
antagonists (AH6809 15 µM + GW627368X 20 µM). mRNA levels are set as 0% for vehicle-treated MSCs and 100% for LoVoCM-treated or IL-1-treated MSCs. Data are means ± SE, n = 3. *p < 0.05, **p < 0.01 (vs MSC treated with LoVoCM or IL-1 without
inhibitors). (E) The proposed interactions for PGE2 and cytokine induction from MSCs. AA: arachidonic acid.
NIH-PA Author Manuscript
NIH-PA Author Manuscript
Fig. 3. MSCs elict EMT, invasion of carcinoma cells, and increased tumor initiation of xenografts
(A) E-cadherin (E-cad), vimentin (VIM), fibronectin, Snail, and β-actin protein expression in carcinoma cells cultured either alone or with MSCs. The numbers indicate relative protein levels. (B) EMT markers and EMT-TFs were measured in LoVo cells treated with vehicle, PGE2 (100 nM) or the cytokines (100 ng/ml IL-6, 100 ng/ml IL-8, 100 ng/ml GRO-α, and/ or 10 ng/ml RANTES) as indicated for 6 days. (C) (Left panel) LoVo-tdTomato cells were cultured either alone or with MSCs in the upper wells of Boyden chambers. The presence or absence of NS-398 (50 µM) or NS-398 + PGE2 (100 nM) is indicated for each panel. The images show the LoVo-tdTomato cells that migrated through the Matrigel-coated membranes in 72 h. Scale bar = 100 µm. (Right panel), Data are means ± SE, n = 3. (D)
NIH-PA Author Manuscript
NIH-PA Author Manuscript
LoVo cell migration in LoVoMSC coculture treated with cytokine neutralizing antibodies as indicated. Data are means ± SE, n = 5. (E) MSCs increase invasion of LoVo tumors. LoVo (5 × 10⁵ cells/injection) were injected subcutanously into SCID mice either alone (a, b, c) or with MSCs (5 × 10⁵ cell/injection, d, e, f). After 8 weeks, tumors of comparable size were isolated. H&E staining was performed on the tumor sections. Scale bar = 100 µm. (F and G) Weights of tumors derived from (F) carcinoma cells (5 × 10⁴ cells/injection) and (G) LoVo cells injected into SCID mice, either alone or with MSCs. Filled circles indicate individual tumor weights; Open circles indicate no tumor grew at the site of injection. Bars are means ± SE. (H) The ranges of the estimated tumor-initiating frequencies in panel G evaluated by ELDA (with 95% confidence).
NIH-PA Author Manuscript
NIH-PA Author Manuscript
Fig. 4. MSC-induced increase in tumor initiation is reflected in an increase in ALDHhigh CSC-enriched populations
(A) ALDH1 protein expression in LoVo cells cultured either alone or with MSCs. The numbers indicate relative protein levels. (B) Unsorted (whole), ALDHhigh and ALDHlow LoVo cells were cultured either alone or with dTtomato-MSCs. After 5 days, ALDH activity of LoVo cells was analyzed by flow cytometry (panel a) and dTtomato-MSCs were removed from the cultures by flow sorting. After removing MSCs, the LoVo cells were cultured alone for another five days. The ALDH activities were again analyzed by flow cytometry (panel b). The percentages indicate the percentage of ALDHhigh LoVo cells; i.e., percent of LoVo cells with ALDH activity beyond the indicated thresholds. (C) a: Weights of tumors derived
NIH-PA Author Manuscript
NIH-PA Author Manuscript
from ALDHhigh or ALDHlow LoVo cells injected into SCID mice, either alone or with MSCs. Solid-filled and hash-filled circles indicate individual tumor weights; open circles indicate no tumor grew at the site of injection. Red circles: injection of ALDHhigh LoVo cells. Blue circles: injection of ALDHlow LoVo cells. Hash-filled circles: injection of LoVo cells, Solid-filled circles: injection of LoVo cells and MSCs. Bars are means ± SE, b: The ranges of the estimated tumor-initiating frequencies evaluated by ELDA. (D) LoVo cells cultured with tdTomato-MSCs have increased numbers of TICs. Cells were cultured as in panel B. After isolating LoVo cells by sorting, cells (5 × 10⁴ cells/injection) were injected into mice. After 6 weeks, the tumors were isolated and weighted. Filled circles indicate individual tumor weights; Open circles indicate no tumor grew at the site of injection. Bars are means ± SE.
NIH-PA Author Manuscript
NIH-PA Author Manuscript
Fig. 5. COX2-PGE2 signaling is required for MSC-induced increase in ALDHhigh CSC-enriched population and tumor initiation
(A) ALDH1 protein expression in LoVo cells treated as indicated for 5 days. (B) ALDH activities of LoVo cells treated with vehicle, PGE2 (100 nM) or GW627368X (20 µM) was analyzed by flow cytometry. The percentages indicate the percentage of ALDHhigh LoVo cells; i.e., LoVo cells with ALDH activity beyond the indicated thresholds. The gray line at the right side of the plot indicates the threshhold of the high ALDH activitiy. (C) ALDH1 protein levels in various carcinoma cells treated with vehicle or PGE2. The numbers indicate relative protein levels. (D) PGE2 increases LoVo TICs. LoVo cells pre-treated with vehicle or PGE2 (100 nM) were injected into SCID mice (5 × 10⁴ cells/injection). After 6 weeks,
NIH-PA Author Manuscript
NIH-PA Author Manuscript
tumors were isolated and weighted. Bars are means ± SE. (E) LoVo cells were cultured with tdTomato-MSCs, PGE2, NS398 or GW627368X, as indicated. After 5 days, the LoVo cells were isolated by cell sorting and injected into SCID mice (5 × 10⁴ cells/injection). After 7 weeks, the tumors were isolated and weighted. Filled circles indicate individual tumor weights; Open circles indicate no tumor grew at the site of injection. Bars are means ± SE. (F) Panel (a), levels of PGE2 secreted by LoVoCM-treated MSCshsc and MSCshcox2. Data are means ± SE, n = 3. Panel (b), Weights of tumors derived from LoVo cells (5 × 10⁴ cells/ injection) injected into SCID mice either alone, with MSCshsc or with MSCshcox-2 (2 × 10⁵ cells/injection). Filled circles indicate individual tumor weights; Open circles indicate no tumor grew at the site of injection. Bars are means ± SE.
NIH-PA Author Manuscript
NIH-PA Author Manuscript
Fig. 6. PGE2 induces ALDHhigh cancer cells through the Akt/GSK-3/β-catenin signaling axis
(A) Activation of Akt/GSK3/β-catenin signaling in LoVo cells treated as indicated for one hour was analyzed by Western blots for phosphorylated Akt, total Akt, phosphorylated GSK-3α, phosphorylated GSK-3β, total GSK-3β, phosphorylated β-catenin, total β-catenin and GAPDH. The numbers indicate relative protein levels. (B) The distribution of E-cadherin (red), ZO-1 (green) and β-catenin (red) in LoVo cells treated with vehicle or PGE2 (100 nM) for 48 h was analyzed by immunofluorescence. Cell nuclei were stained with DAPI (in blue). The graphs show the fluorescence intensities along the dashed lines in the images of β-catenin staining. β-catenin intensities are in red lines and DAPI intensities are in blue lines. (C) Quantification of the levels of E-cadherin, ZO-1 and β-catenin associated
NIH-PA Author Manuscript
NIH-PA Author Manuscript
with membrane and of nuclear β-catenin. The fluorescence intensities for the staining of these proteins in randomly selected cells in images (e.g. the cells crossed by dashed lines in panel B) were quantified. Bars are means ± SE, n > 50 for each bar. M β-catenin:
membrane-bound β-catenin. N β-catenin; nuclear β-catenin. (D) Nuclear/cytosolic
distribution of β-catenin in LoVo cells treated as indicated was analyzed by Western blot of β-catenin, GAPDH, and lamin B1, a nuclear envelope marker, in nuclear and cytosolic fractions. (E) mRNA expression of selected β-catenin/TCF dependent genes in LoVo cells treated with vehicle or PGE2 for 7 h. The mRNA levels of these genes were normalized to GAPDH mRNA. Data are fold induction by PGE2 (vs that of vehicle-treated LoVo cells). Data are means ± SE, n = 3. (F) ALDH activities of ALDHhigh LoVo cells treated with vehicle, PGE2, PGE2 + GW627368X (GW; 20µM), PGE2 + LY294002 (0.5 µM) or PGE2 + FH535 (6 µM) for 5 days (a–c). Percentages of ALDHhigh LoVo cells are presented in the table (d). The gray lines at the right side of the plots indicate the thersholds of the high ALDH activitiy.
NIH-PA Author Manuscript
NIH-PA Author Manuscript
Fig. 7. MSCs in tumor stroma serve as an ALDHhigh cancer stem cell niche
(A) Immunofluorescence analyses were performed on tumors derived from LoVo cells (5 × 10⁴ cells/injection) injected along with tdTomato-MSCs (5 × 10⁵ cells/injection), using antibodies against tdTomato-RFP (in green), ALDH1 (in red, panel a), Fibroblast Surface Protein FSP (in red, panel b), and COX2 (cyan). Panels a and b are serial sections from one tumor. (B) IL-1 and COX2 mRNA expression in human colon and breast carcinoma. The “Fold Change” indicates the average mRNA levels of the three genes in colon mucinous carcinoma samples, compared to that of normal colon samples (panel a) and in TNBC samples, compared to that of non-TNBC samples (panel b). (C) The proposed interactions
NIH-PA Author Manuscript
NIH-PA Author Manuscript
for induction and maintenance of EMT, cancer cell stemness and invasiveness by MSCs. AA: arachidonic acid