READ THESE TERMS AND CONDITIONS CAREFULLY BEFORE USING THIS WEBSITE.
https://nrc-publications.canada.ca/eng/copyright
Vous avez des questions? Nous pouvons vous aider. Pour communiquer directement avec un auteur, consultez la
première page de la revue dans laquelle son article a été publié afin de trouver ses coordonnées. Si vous n’arrivez pas à les repérer, communiquez avec nous à PublicationsArchive-ArchivesPublications@nrc-cnrc.gc.ca.
Questions? Contact the NRC Publications Archive team at
PublicationsArchive-ArchivesPublications@nrc-cnrc.gc.ca. If you wish to email the authors directly, please see the first page of the publication for their contact information.
Archives des publications du CNRC
This publication could be one of several versions: author’s original, accepted manuscript or the publisher’s version. / La version de cette publication peut être l’une des suivantes : la version prépublication de l’auteur, la version acceptée du manuscrit ou la version de l’éditeur.
Access and use of this website and the material on it are subject to the Terms and Conditions set forth at
Application of a Three-Dimensional Color Laser Scanner to Paleontology
Lyons, P.D.; Rioux, Marc; Patterson, T.
https://publications-cnrc.canada.ca/fra/droits
L’accès à ce site Web et l’utilisation de son contenu sont assujettis aux conditions présentées dans le site LISEZ CES CONDITIONS ATTENTIVEMENT AVANT D’UTILISER CE SITE WEB.
NRC Publications Record / Notice d'Archives des publications de CNRC:
https://nrc-publications.canada.ca/eng/view/object/?id=ac22af00-7c35-45ba-a7c2-7d6f95bc57d5 https://publications-cnrc.canada.ca/fra/voir/objet/?id=ac22af00-7c35-45ba-a7c2-7d6f95bc57d5
National Research Council Canada Institute for Information Technology Conseil national de recherches Canada Institut de Technologie de l’information
Application of a Three-dimensional
Color Laser Scanner
P.D. Lyons, M. Rioux, and R.T. Patterson June 2000
Copyright 2001 by
National Research Council of Canada
Permission is granted to quote short excerpts and to reproduce figures and tables from this report, provided that the source of such material is fully acknowledged.
*published in Palaeontologia Electronica, 3(2), art. 4: 16pp., 2.04MB. http://palaeo-electronica.org/2000_2/neural/issue2_00.htm. NRC 44162.
Palaeontologia Electronica
http://palaeo-electronica.orgLyons, Patrick D., Marc Rioux, and R. Timothy Patterson, 2000. Application of a Three-Dimensional Color Laser Scanner to Paleontology: an Interactive Model of a Juvenile Tylosaurus sp. Basisphenoid-Basioccipital. Palaeontologia Electronica, vol. 3, issue 2, art. 4: 16pp., 2.04MB. http://palaeo-electronica.org/2000_2/neural/issue2_00.htm
APPLICATION OF A THREE-DIMENSIONAL COLOR LASER SCANNER
TO PALEONTOLOGY: AN INTERACTIVE MODEL OF A JUVENILE
TYLOSAURUS SP. BASISPHENOID-BASIOCCIPITAL
Patrick D. Lyons, Marc Rioux,
and R. Timothy Patterson
Patrick D. Lyons, Department of Earth Sciences, Carleton University, Ottawa, Ontario K1S 5B6, Canada Marc Rioux, Visual Information Technology Group, Institute for Information Technology, National Research Council, Ottawa, Ontario, K1A 0R6, Canada
R. Timothy Patterson, Department of Earth Sciences, Carleton University, Ottawa, Ontario K1S 5B6, Can-ada
ABSTRACT
Three-dimensional (3D) modeling has always been an important part of paleonto-logical research and interpretation though digital reproductions of fossils are a recent phenomena. A highly accurate, interactive, 100 µm resolution, 3D, digital model of a fossilized basisphenoid-basioccipital from a juvenile Tylosaurus sp. mosasaur was generated using a 3D laser scanner and manipulated using VRML and InnovMetric polygon files. This 3D model supports varying levels of magnification depending on the initial scan resolution and the amount of post-production polygon reduction. The gener-ation of these 3D models is relatively simple because the software and technology for their generation is relatively mature. At present, complex 3D models require powerful computers in order to manipulate their computer graphic substructures. But, as com-puter technology improves, digital 3D scanning could prove invaluable for creating and sharing virtual copies of fossil material.
Key Words: Mosasaur, three-dimensional (3D), model, virtual reality, VRML Copyright: Society for Vertebrate Paleontology, 15 November 2000
Submission: 28 March 2000, Acceptance: 3 November 2000
INTRODUCTION
Increasingly, paleontologists are able to exploit technology to aid in visualizing extinct life. For example, three-dimen-sional (3D) computed tomography (CT) techniques have been applied to deter-mine the external form of embedded fos-sils (Torres 1999), as well as to develop a
digitally rendered endocast model of a Tyrannosaurus rex (Brochu 2000). Mod-els of conodonts have also been gener-ated by applying Virtual Reality Markup Language (VRML) to predict the geometry of bedding plane arrangements (MacRae 1995). Finally, a combination of QuickTime VR and scanning electron microscopic
2
methods have been utilized to image microfossils (Lyons et al. 1998). Three-dimensional modeling is not new to the field of paleontology though.
Alcide d’Orbigny in 1826 (d’Orbigny 1843) made some of the first 3D models of fist-sized reproductions of microscopic for-aminifera. However, the most famous early models were certainly the life-size interpretations of Iguanodon, Hylaeosau-rus, MegalosauHylaeosau-rus, Plesiosaurus and Ichthyosaurus sculpted by Benjamin Hawkins in 1853 for the International Exhi-bition. After the exhibition closed the dino-saur models were subsequently moved to Sydenham Park in South London (Spald-ing 1993).
Traditionally, if a fossil important to the paleontological community is discovered, the resultant research publication is usu-ally accompanied by appropriate illustra-tions. If this work is built upon, other researchers will either have the specimen sent to their institution or will visit the insti-tution where the specimen is archived to examine the specimen. Although tradi-tional modelling techniques (e.g., plaster or fiberglass casting) will undoubtedly remain popular and relevant for some time to come, there are real advantages in using digital methodologies for research purposes. The benefit of utilizing a digital model versus the actual fossil, or a tradi-tional reproduction, is the potential to share and carry out research on fossils with colleagues over great distances quickly and cheaply with no danger to the original material. Shape analysis, as well as soft and hard tissue reconstruction can all be done easily within the digital realm. Hard copies of the digital model can also be produced using rapid prototyping machines (mechanical devices used to turn 3D computer-generated designs into production prototypes). These instruments permit the production of highly accurate models with a level of detail and accuracy
far exceeding those typical of traditional casts (Beraldin et al. 1997).
Other uses of high-resolution 3D laser scanners, as applied to fossil material, include the ability to provide external sur-faces (e.g., biomedical application such as imaging and reconstruction of brains. Wal-lace 1999) and creation of a collection of digital reconstructions that would allow for a comparison of surface structures across similar species.
Three-dimensional laser scanners have been in limited use since their devel-opment by the National Research Council of Canada in 1981. However, it is only within the last three years that these scan-ners have become more prevalent and accessible to researchers and engineers through commercial development of the technology. As high-resolution (<100µm) laser scanners become commercially available, they represent a unique oppor-tunity to image fossil material. Three-dimensional laser scanners have already been applied in such diverse applications as documenting archaeological artifacts from The Canadian Museum of Civilization (Rioux 1994), documenting archaeological digs (Boulanger et al. 1998), using reverse engineering (a process by which an object is scanned in three dimensions and then reconstructed physically with either rapid prototyping machines or automated lathes. Godin et al.1996), and determining the authenticity of artwork (Baribeau et al. 1992).
Work by other paleontological researchers has used less sophisticated 3D scanning technology, including low-resolution (>500µm) point scanners to pro-duce an animated Triceratops sp. in loco-motion studies (Andersen et al. 1999). Even lower-resolution laser scanners have been used in modeling the morphology of a variety of vertebrate fossil material (Chapman 1997). To the best of our knowl-edge, though, high-resolution laser
scan-PATRICK D. LYONS, MARC RIOUX, & R. TIMOTHY PATTERSON: TYLOSAURUS 3D LASER SCAN
3
ners have not been applied to paleontological research.
In this article we present and explore a new technique for the 3D modeling of macrofossil material from a mosasaur. This technique utilizes a high-resolution 3D laser scanner to capture a series of positional coordinates (x, y, z).
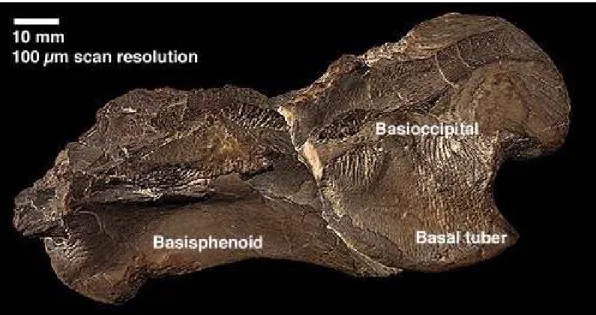
Mosasaurs are an extinct group of marine reptiles that were most diverse and abundant through the latter half of the Cre-taceous, and like other groups of marine reptiles became extinct at the K-T bound-ary (Russell 1967). They reached immense sizes, up to 10 meters in length, and are well-known from many recovered specimens, but relatively few juveniles have been found (Caldwell 1996). From braincase material of a mosasaur in the collections of the Canadian Museum of Nature, the basisphenoid-basioccipital (#51259) of a juvenile Tylosaurus sp. was completely imaged by the 3D laser scan-ning technique at a resolution of 100 µm. The basisphenoid-basioccipital is located at the base of the skull and is one of sev-eral bones that form the braincase in ver-tebrates. These bones support and protect the brain.
Although paleontologists often depend heavily on the physical features when interpreting specimens, several questions must be answered if this technique is to prove viable in providing accurate digital models fit for paleontological study. Thus, primary aims of this paper are to deter-mine whether a digital model scanned at 100 µm is accurate enough for paleonto-logical study and whether available com-pression methods used to make such models more easily accessible with desk-top computers reduce the scientific value of the digital model by obscuring or even deleting important features.
METHODS AND MATERIALS
A total of six bones from the braincase of a juvenile Tylosaurus sp. were avail-able for three-dimensional laser scanning; the right and left prootic, the right quad-rate, the supraoccipital, the parietal, and the basisphenoid-basioccipital. The basisphenoid-basioccipital (Fig. 1) was chosen for this initial evaluation because of its complex surfaces and its importance in revealing the positions and paths of cra-nial nerves.
The Institute for Information Technol-ogy (a division of the National Research Council of Canada NRCC) developed the 3D laser scanner (Fig. 2) that was used. This scanner is able to generate extremely accurate scans at resolutions of as little 10 µm. Scanning at such high resolutions requires significant time for both scanning the object because the laser must physi-cally travel slower over the object and using substantially more computer pro-cessing time in order to generate the 3D model. Previous analysis of the accuracy of the 3D laser scanner used in this study for industrial prototyping purposes indi-cates that distortion-free models can be generated down to a resolution of 10 µm (Beraldin et al. 1997).
Even a 50 µm-resolution scan allows for extremely detailed and accurate repro-ductions of objects. But even at this reso-lution it is done at the expense of generating very complex polygonal mod-els with numerous individual polygons. Due to the complex surfaces present on the basisphenoid-basioccipital, we esti-mated that scanning the bone at a resolu-tion of 50 µm would generate a model composed of over ten million polygons. As one might guess, models composed of such large numbers of polygons cause significant problems for present-day com-puter technology and generally require prohibitively expensive technology to gen-erate. For this reason, prior to carrying out
4
a full scan of the basisphenoid-basioccipi-tal, a series of test scans were carried out at resolutions at both 50 µm and at 100 µm on a small 1 cm2 area. Based on these
tests, it was determined that a resolution of 100 µm produced satisfactory results and manageable polygon counts.
Having determined a satisfactory scan resolution, the basisphenoid-basioccipital was scanned 30 times in a variety of orien-tations to allow all surfaces to be exposed to the laser. The information captured by the laser scanner was compiled on a Sili-con Graphics workstation. These 3D datasets were then imported into a soft-ware package developed by InnovMetric Software Inc. called PolyWorks/Modeler version 5.0. Using the automatic alignment technology built into PolyWorks/Modeler, the multiple datasets from the 30 scans in different coordinate systems were unified into a single coordinate system, forming the 3D surface. PolyWorks/Modeler's high-precision alignment algorithm allows unrestricted movement of either the object or the digitizer to measure the entire shape of the object without any external reference (Beraldin et al. 1997).
The 3D laser scanner employed at NRCC is also able to capture color infor-mation for each positional coordinate. Once this information is passed to Poly-works/Modeler, a texture map is generated and applied to the digital model. A note should be made about color. The NRCC 3D laser scanner uses three different
Figure 1. Three-dimensional, color, laser-scanned image of a basisphenoid-basioccipital of a juvenile Tylosaurus sp. 100 µm scan resolution; Image from 800,000 polygon model.
Figure 2. Laser unit of 3D scanner developed by the division of Visual Information Technology, National Research Council Canada.
PATRICK D. LYONS, MARC RIOUX, & R. TIMOTHY PATTERSON: TYLOSAURUS 3D LASER SCAN
5
wavelength (red, green, and blue) lasers to register accurate data on color reflec-tance (Soucy et al. 1996). As the lasers do not depend on ambient light for color determination, the texture maps generated from the color information are accurate (Beraldin et al. 1997). However, there is variation in the color information when the model is displayed on cathode ray tube (CRT) or liquid crystal display (LCD) moni-tors or when images are printed. This vari-ation is due to limitvari-ations and individual variations in how different computers’ video cards and CRT-LCD monitor display color information (Fraser 1998).
The completely assembled 100 µm resolution digital model was composed of over 3 million polygons and totaled over
76 megabytes (MB) in size. To provide an indication of how file sizes balloon with increasing resolution, the 1 cm2 test area
scanned at a 50 µm resolution alone. This resulted in a model composed of 870,000 polygons and was 23.5 MB in size. In con-trast, the same area scanned at 100 µm produced an 11.75 MB file comprised of 235,000 polygons. The completed models were saved as an InnovMetric polygon file (.pol). This proprietary file format is effi-cient and preserves texture information as well as the coordinate system that forms the basis for the model.
It was necessary to perform a series of polygon reductions to diminish the com-plexity and storage size of the model and to allow for interpretation and viewing of
Figure 3. Interactive polygon reduced (from 3 million to 50,000 polygons) VRML model of a juvenile Tylosaurus sp. basisphenoid-basioccipital. The overall length of the fossil is 113 mm.
Author's note: The preferred method for viewing the three-dimensional model is with Virtual Reality Modeling Language (VRML) software. However, as the VRML model is a large download (15 MB), is extremely demanding on desktop computers, and it requires a fast computer (minimum 400 MHz Pentium II (or equivalent) or a G3 processor, 64 MB RAM, and 8 MB of video RAM), a QuickTime VR version is provided. Viewing the VRML requires a VRML plug-in a format that is more fully supported on PCs than Apple Macintosh computers. The recommended VRML plug-in for Macintosh is WorldView from
Intervista or the Macintosh version of the Cortona VRML plugin from Parallel Graphics. PC users should use the PC version of the Cortona plugin. Corona VRML: http://www.parellelgraphics.com/. WorldView from Intervista: http://tucows.apollo.lv/mac/plugmac.html.
6
the model on typical desktop computer systems. The completed 100 µm resolu-tion model described above was reduced to three models composed of 800,000 (21 MB), 100,000 (2.6 MB), and 50,000 (1.3 MB) polygons, respectively. As part of this evaluation, the polygon count for the 1 cm2 testarea scanned at 50 µm resolution
was also reduced from 870,000 polygons to 50,000 polygons (1.3MB). Prior to this reduction, still images of both the com-plete 3 million polygon model (100 µm scan resolution) and the 1 cm2 area
scanned at 50 µm resolution were ren-dered and saved in JPEG file format.
All reduced polygon files were con-verted from the proprietary InnovMetric file format to VRML (ver. 2.0) (Fig. 3). The VRML format is a standard text-based 3D file format that allows for viewing of the files over the World Wide Web. Unfortu-nately as this file format is text based, file sizes increase dramatically.
Both the original .pol files and the VRML files were transferred to Carleton University from NRCC for manipulation and analysis on both Apple Macintosh and IBM compatible PCs. The VRML files were viewed and evaluated using a software
package from Auto-des-sys Inc. entitled Form-Z (ver 3.1.4). This software applica-tion allowed for relatively rapid display of the 3D models and corrected the problems encountered when using Intervista. Using Form-Z, the texture map could be removed and the model could be analyzed without color bias (Fig. 4). To decrease the file size and to allow for greater access to
Figure 4. Three-dimensional, color, laser-scanned image of a basisphenoid-basioccipital of a juvenile Tylosaurus sp. One-hundred micrometer scan resolution with color information removed.
Figure 5. Interactive QuickTime VR object movie of a juvenile Tylosaurus sp. basisphenoid-basioccipital. There are rendering artifacts present in the model visi-ble as fine lines delineating the wireframe, which sup-ports the model. These artifacts are not present in the VRML model and are a result of the software package used to generate the QuickTime VR object movie. The overall length of the fossil is 113 mm.
Author's note:Viewing the QuickTime VR version of the model requires QuickTime 4.0. QuickTime is available for both Macintosh and PC platforms.
PATRICK D. LYONS, MARC RIOUX, & R. TIMOTHY PATTERSON: TYLOSAURUS 3D LASER SCAN
7
the model, a QuickTime VR object was created (Fig. 5) using Form-Z’s export to a QuickTime VR feature. Scanning the basisphenoid-basioccipital at 100 µm required four hours, with an additional 3 hours of postproduction time used to com-pile, assemble, and reduce the model.
RESULTS Digital model accuracy
The 800,000 polygon digital model scanned at 100 µm was compared to the physical specimen by scaling on the com-puter screen and by using microscopic techniques respectively. The dimensions, geometry, and color were identical on the digital model to that of the specimen. Fig-ure 6 is a composite image comparing the
Figure 6. Dorsal view of Tylosaurus sp. basisphenoid-basioccipital comparing traditional photography and 3D laser scanning. Color information is removed so that comparison can be done without color bias. Three-dimensional, 100 µm resolution scan image from 800,000 polygon model.
8
digital model with a photograph of the physical specimen. To the eye, even at increased magnification, it was not possi-ble to differentiate the specimen and the digital copy. As accuracy of the methodol-ogy has been previously rigorously tested under demanding industrial conditions it was not deemed necessary to quantify the verification process. However, visual examination of two regions highlights examples of the accuracy of the digital model. Figure 7 illustrates the vidian canal; its structure can be seen easily in both the model and the image of the phys-ical specimen. Figure 8 shows details of the abducens cranial nerve (VI) and the branch of the internal carotid artery (ICB). The only limitation of digital models such as shown is that they can only support a limiting amount of scaling (Fig. 9). The lim-itation of this scaling is related to two vari-ables; the scanning resolution and polygon reduction (Beraldin et al. 1997).
Comparison of 50 µm and 100µm scan
resolutions
Figure 10 was scanned at 50 µm reso-lution, and Figure 11 was scanned at 100 µm resolution. Both models support sub-stantial scaling without facets appearing in the digital model. However, when the 100 µm digital model is scaled to more than 5x, facets become visible on high angle sur-faces (Fig. 12). In contrast, the model scanned at a 50 µm resolution supports much greater scaling, to the point of exceeding the resolution of the texture map (Fig. 13).
Polygon reduction
As discussed earlier, to permit most researchers access to a version of this complex digital model that can be manipu-lated, it was necessary to reduce the num-ber of polygons. Figure 3 is a digital model comprised of 50,000 polygons scanned at a 100 µm resolution. This represents a 98% reduction in the number of polygons from the initial 3 million polygon model and
Figure 7. High angle, 3D, 100 µm resolution scan image from 800, 000 polygon model illustrating structure of vidian canal.
PATRICK D. LYONS, MARC RIOUX, & R. TIMOTHY PATTERSON: TYLOSAURUS 3D LASER SCAN
9 Figure 8. Dorsal view of both traditional photography and 3D laser scanning of Tylosaurus sp. basisphenoid-basioc-cipital highlighting the Cranial Abducens Nerve (VI) and the branch of the internal carotid artery (icb). Three-dimen-sional, 100 µm resolution scan image from 800,000 polygon model.
10
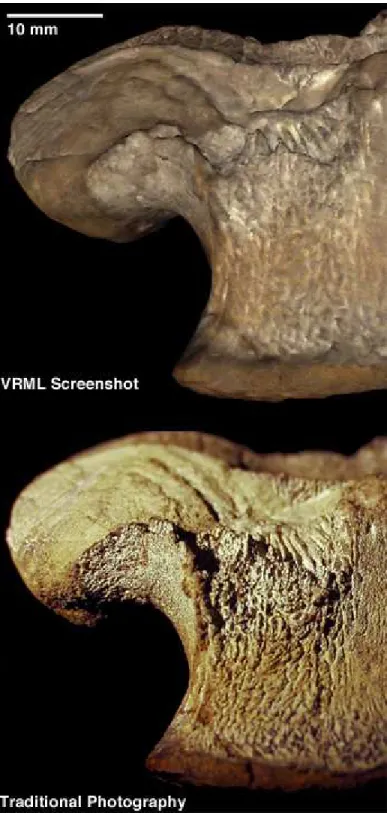
can only support a limited amount of scal-ing (1.5x) before details apparent in the physical specimen are either obscured or absent (Fig. 14).
DISCUSSION
One fundamental question that this investigation sought to address was whether a high-resolution, 3D, laser-scanned, digital model would be useful to paleontologists. Certainly a digital model
Figure 9. Magnification of 3D 100 µm resolution scan from 800, 000 polygon Tylosaurus sp. basisphenoid-basioccip-ital model illustrating faceting.
PATRICK D. LYONS, MARC RIOUX, & R. TIMOTHY PATTERSON: TYLOSAURUS 3D LASER SCAN
11
allows for a new method of illustration. But in some cases one must consider whether a digital model represents a viable replacement for a physical specimen or cast?
Several areas of the 3-million polygon digital model were examined and com-pared to the specimen. For example, in the case of the basisphenoid-basioccipital presented here, areas of interest to a researcher examining a mosasaur brain-case would be blood supply to the brain and the cranial nervous system (Russell 1967). Obviously, soft tissues are rarely preserved (Fastovsky and Weishampel 1996), but cranial nerves often left path-ways and foramens throughout the brain case as they traced their way from the extremities of the animal (e.g., sensory organs) to the various reception sites in the brain (Hildebrand 1988). These fora-mens can be essential to researchers because they indicate the likely position and structure of the brain (Hildebrand 1988) and can provide important charac-ters for a phylogenetic analysis (Bell 1997). As a result of alteration during the
fossilization process, the illustrated basisphenoid-basioccipital (Figures 3 and 5) shows some deformation and compres-sion along the lateral margins, slightly obscuring one of the foramen of the abducens nerve (cranial nerve VI; Fig. 8). However, the structure is clearly visible, even scanned at 100 µm resolution.
Blood circulation to the brain also pro-vides important clues to phylogenetic rela-tionships, with the vidian canal likely containing the internal carotid artery (Rus-sell 1967; seen clearly in Fig. 7). The branch of the internal carotid artery leaves the vidian canal and passes medially through the basisphenoid (Fig. 8). In some mosasaur clades the internal Carotid Artery became significantly enlarged so it is of phylogenetic importance to recon-struct this vessel.
Comparison of 50 µm and 100 µm scan resolution
Would a 100 µm scanning resolution be sufficient to produce an accurate digital model for paleontological study, or is a 50 µm scanning resolution a requirement?
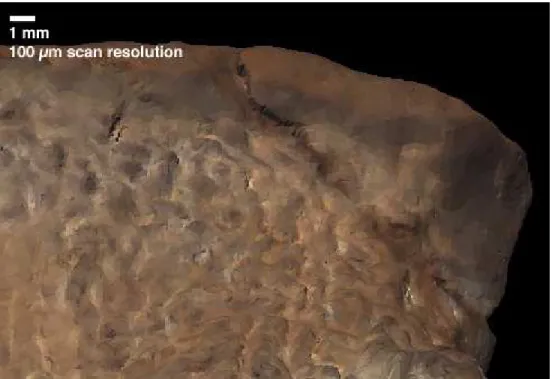
12 Figure 12. 1 cm2 area of basal tuber of Tylosaurus sp. basisphenoid-basioccipital scanned at 100 µm resolution
indi-cating faceting.
Figure 13. 1 cm2 area of basal tuber of Tylosaurus sp. basisphenoid-basioccipital scanned at 50 µm resolution
PATRICK D. LYONS, MARC RIOUX, & R. TIMOTHY PATTERSON: TYLOSAURUS 3D LASER SCAN
13
The answer to this rhetorical question is important because scanning at higher res-olution generates a higher polygon count model and larger file sizes and requires a significantly more powerful computer to
manipulate. As discussed above, whether a 50 µm or 100 µm resolution scan is suffi-cient for research purposes will depend on the individual researcher’s interests. As an example, a small area of the basal tuber
Figure 14. Lateral view of both traditional photography and VRML model (generated by a polygon reduction from 3 million to 50,000) illustrating details and ridges apparent in physical specimen are either obscured or absent.
14
(Fig. 10) scanned at 50 µm was compared to the same region at a 100 µm scan. The basal tuber of the basisphenoid is ridged and pitted, likely from a rich supply of blood through a network of blood vessels supplying a cartilage covering (Russell 1967). When the pits and ridges of the basal tuber are magnified (Fig. 13), the internal structure of the ridges are clearly seen at 50 µm scanning resolution. Unfor-tunately at 100 µm scanning resolution the pits and ridges are faceted at the equiva-lent magnification. Clearly, if a researcher is interested in the internal structures of small features such as the basal tuber, or other structures smaller than 100 µm, a scan resolution of 50 µm is required. How-ever, it is likely that, for a majority of researchers and for most applications, a 100 µm scan resolution would be satisfac-tory because it supports artifact-free mag-nifications of up to 5x.
As laser scanning technology matures, as the process becomes increas-ingly automated, and as personal comput-ers become faster, cheaper, and more common, scans at 50 µm resolution will become more practical permitting more information to be presented in a 3D model.
Polygon Reduction
While computer speed has increased dramatically in recent years (Moore 1997), most desktop computers have yet to achieve performance levels suitable for manipulating 3D digital models comprised of hundred of thousands of polygons in real time. Modern Silicon Graphics work-stations allow real-time manipulation of digital models composed of millions of polygons. Unfortunately, the prohibitive cost of these high-end graphics computers makes them unavailable to most research-ers. To permit most readers access to a version of this complex digital model that can be manipulated, it was necessary to reduce the number of polygons to a more
manageable number. ‘Manageable num-bers’ of polygons for desktop computers are dependent on the speed of the proces-sor, the speed of the video card, the amount of video memory, the amount of random access memory available, and the file type. At this time 50,000 to 800,000 polygons seems to be the limit for the most recent desktop machines (e.g., Intel Pentium III, AMD Athalon, and Motorola G3/G4 processors).
Consideration of the differences between 3D file types is critical when assessing the ability of desktop computers to display a complex model composed of many polygons. Some file types support texture maps and multiple light sources and allow for compact file sizes, but are not widely viewable. In contrast, other file types do not support texture maps and are inefficient, but are well-supported and eas-ily read by a variety of operating systems (Macintosh, PC, and Unix). An example is InnovMetric’s Polygon file type versus VRML. With the Intel Pentium III computer, used for this research, with 384 MB of RAM, an InnovMetric polygon file com-posed of 800,000 polygons is easily manipulated in near real-time, while the same model must be reduced to 50,000 polygons to achieve the same response when viewed using VRML. The benefit of using VRML though is that it is a standard file type and can be read by many different types of software. These VRML files will also likely still be readable for the foresee-able future because the files are text based. For these reasons, VRML was chosen as the preferred file type for this study even though it is not nearly as effi-cient as an InnvoMetric polygon file for-mat. Nevertheless, it should be noted that VRMLs inefficiency required that the num-ber of polygons be reduced from 3 million polygons to 50,000 polygons; a reduction of 98%. While this allows for the model to be displayed on fast desktop computers,
PATRICK D. LYONS, MARC RIOUX, & R. TIMOTHY PATTERSON: TYLOSAURUS 3D LASER SCAN
15
an assessment must be made as to whether any paleontological value remains in such a substantially reduced model. An algorithm present in PolyWorks/ Modeler that removes redundant informa-tion carried out the process by which the number of polygons was reduced. Results suggest that if the 50,000 polygon digital model is displayed at its original (1x) size, no apparent difference can be noted between the physical specimen and the digital model (Fig. 3). However, as the dig-ital model is scaled upwards (simulating examination of the physical specimen at increased magnification), differences quickly become apparent. At a scale equivalent to 1.5x and upwards, the fine details and ridges apparent in magnified views of the physical specimen are either obscured or absent (Fig. 14). Thus, poly-gon-reduced models only have limited value to researchers, for example in roles such as informal consultation with col-leagues or popular science.
Polygon-reduced models potentially do have a role in paleontological research in other applications such as virtual recon-struction though. For example, if the five remaining braincase bones (right quad-rate, right and left prootic, parietal and supraoccipital) of the juvenile Tylosaurus sp. were also scanned at 100 µm resolu-tion and then assembled to create a virtual reconstruction of the brain case, the resultant model would likely comprise over 12 million polygons and would be in excess of 200 MB. In order to manipulate such a reconstruction, the number of poly-gons would have to be reduced by an order of magnitude or more depending on the researcher’s hardware and software. The resultant reduced model would still be useful for various applications including estimation of brain morphology and vol-ume. One can imagine the number of poly-gons present in a complete whole skeleton reconstruction though; it could conceivably
number in the billions leaving this applica-tion in the realm of science ficapplica-tion for the next few years.
CONCLUSIONS
Three-dimensional laser scanners are able to generate highly accurate and pow-erful digital reconstructions that, in turn, are able to support significant levels of magnification. Digital models can, in some cases, replace the physical specimen depending on the level of detail sought by the researcher. Scanning at 100 µm reso-lution is suitable for most vertebrate pale-ontological research if the research involves analysis of structures larger than 100 µm. If the structures of interest are smaller than 100 µm, a 50 µm scanning resolution must be used. Although making models easier to manipulate, polygon compression reduces the level of detail present in the model and should not be used for detailed paleontological study. Development of digital models will make it easier for collaboration over the World Wide Web, making it easier to protect valuable specimens. Other uses could include the modeling of internal structures. This technique would also allow for high-precision realignment of serial sections and the development of a digital model library for comparison of similar speci-mens. With the development of more pow-erful desktop computers in the next few years, it will be possible for the develop-ment of virtual reconstructions of important systems or complete skeletons that are easily manipulated. As the technology continues to mature, the potential exists for specimens to be archived digitally as three-dimensional models that could then be stored in a database for rapid retrieval and referencing.
ACKNOWLEDGEMENTS
We thank the Visual Information Tech-nology division of the National Research
16
Council of Canada for use of the three-dimensional laser scanner and their incredible expertise and patience, M. Caldwell of the Canadian Museum of Nature for arranging the loan of the fossil material and initial conversations, M. Getz of the department of Industrial Design at Carleton University for help with Form-Z and file conversions, A. Webb for the loan of the IBM- compatible computer and C. Schröder-Adams and N. Saumure for advise and support. This project was funded by NSERC Research Grant OGP0041665 to R. T. Patterson.
REFERENCES
Andersen, A. F., Chapman, R. E., Kenny, K., and Lars-son, H.C.E., 1999. Animation of 3-D Digital Data: The Walking Triceratops. Abstracts 59th Annual Meet-ing of the Society of Vertebrate Paleontology, Denver, 19(3):29A.
Baribeau, R., Cournoyer, L., Godin, G., and Rioux, M., 1996 Colour Three-Dimensional Modelling of Museum Objects, Imaging the Past, Electronic Imag-ing and Computer Graphics in Museum and Archae-ology. British Museum, Occasional Paper 114:199 - 209.
Baribeau, R., Rioux, M. and Godin, G., 1992. Recent Advances in the use of a Laser Scanner in the Exam-ination of Paintings, Proceedings of Restoration' 92, Amsterdam, 69-73.
Bell, G. L., 1997. Phylogenetic revision of the Mosasau-roidea, p.281-332. Callaway, J. M. and Nicholls, E. L. (ed.), Marine Reptiles Academic Press, Toronto. Beraldin, J.-A. Cournoyer, L. Rioux, M. Blais, F.
El-Hakim, S. F. and Godin, G., 1997 Object model cre-ation from multiple range images: acquisition, cali-bration, model building and verification. Proceedings of the International Conference on Recent Advances in 3-D Digital Imaging and Mod-eling Ottawa, NRC 40169:326-333.
Boulanger, P., Taylor, J., El-Hakim, S. and Rioux, M., 1998 How to Virtualize Reality: An Application to the Re-creation of World Heritage Sites, VSMM98, Inter-national Society on Virtual Systems and Multime-dia, Gifu, Japan 1:39 – 45.
Brochu, C., A., 2000. A digitally-rendered endocast for Tyrannosaurus rex. Journal of Vertebrate Paleon-tology, 20:1-6.
Caldwell, M.W. 1996. Ontogeny and phylogeny of the mesopodial skeleton in mosasauroid reptiles. Zoo-logical Journal of the Linnean Society 116:407-436.
Chapman, R. E., Rasskin-Gutman, and Hunt, G., 1997. Using computer modeling of morphology for explor-ing functional and evolutionary models Abstracts 57th Annual Meeting of the Society of Vertebrate Paleontology, Chicago, 17(3):37.
d’Orbigny, A., 1843. Modeles de Foraminiferes vivans et fossils. Imprimerie de Cosson, Paris.
Fastovsky, D. E., and Weishampel, D. B., 1996. The Evolution and Extinction of the Dinosaurs. Cam-bridge University Press, New York.
Fraser, B, 1998. The Power of ColorSync Color Match-ing. Macworld June 1998 105-109.
Godin, G., Soucy, M., and Boulanger, P., 1996. Range image integration for direct replication of objects. SPIE Proceedings On Rapid Product Develop-ment Technologies, Boston, 2910:34-44.
Hildebrand, M., 1988. Analysis of Vertebrate Struc-ture. John Wiley & Sons, Inc., Toronto.
Lyons, P. D. and Head, L, 1998. QuickTime VR: A power-ful new illustrative tool for micropaleontological research. Palaeontologia Electronica, 1(2): 12p., 219 KB. http://www-odp.tamu.edu/paleo/1998_2/lyons/ issue2.htm
MacRae, A. R. and Henderson, C. M., 1995. 3-dimen-sional models of the Scottognathus conodont assemblage. Abstracts Proceedings of the 1995 GAC/MAC convention.
Moore, G. E., 1997. The Microprocessor: Engine of the Technology Revolution. Communications of the ACM 40(2):113-114.
Rioux, M., 1994. Digital 3-D Imaging: Theory and Appli-cations. SPIE Proceedings, Videometrics III,Inter-national Symposium on Photonic and Sensors and Controls for Commercial Applications, Bos-ton, 2650, 2-15.
Russell, D. A., 1967. Systematics and Morphology of American Mosasaurs. Peabody Museum of Natural History Bulletin 23:1-240.
Soucy, M., Godin, G., Baribeau, R., Blais, F. and Rioux, M. 1996. Sensors and Algorithms for the Construc-tion of Digital 3-D Colour Models of Real Objects, ICIP-96 Proceedings, 1996 IEEE International Conference on Image Processing, Lausanne, Swit-zerland, 2:409-412.
Spalding, D. A. E., 1993. The Dinosaur Hunters. Key Porter Books Ltd. Toronto.
Torres, A. M., 1999. A three-dimensional CT (CAT) scan through rock with Permian alga Ivanovia tebagaen-sis. Journal Of Paleontology 73:154-158.
Wallace, 1999. Medical Diagnostics, Laser Focus World, v. 35 (1):1