Characterizing Performance of Residential Internet
Connections Using an Analysis of Measuring Broadband
America's Web Browsing Test Data
by
Alexander M. Gamero-Garrido
Electronic Engineer, Simon Bolivar University (2011) with Engineering Degree Project at Lund University (2010)
Submitted to the Institute for Data, Systems, and Society in partial fulfillment of the requirements for the degree of
Master of Science in Technology and Policy at the
MASSACHUSETTS INSTITUTE OF TECHNOLOGY
September 2015
ARCHIVES
MASSACHUSETS INSTITUTE OF TECHNOLODGYOCT 14 2015
LIBRARIES
@
Massachusetts Institute of Technology 2015. All rights reserved.Signature redacted
Author ...
Signatu
. .. . . . . .
- nolo y and olicy Program
re redacted
August 14, 2015.... ...................
Certified by
David D. Clark
Senior Research Scientist
Computer Science and Artificial Intelligence Laboratory
Signature
redacted
Thesis Supervisor
Accepted by ...
...
Munther A. Dahleh
William A. Coolidge Professor of Electrical Engineering and Computer Science
Director, Institute for Data, Systems, and Society
Acting Director, Technology and Policy Program
Characterizing Performance of Residential Internet Connections
Using an Analysis of Measuring Broadband America's Web
Browsing Test Data
by
Alexander M. Gamero-Garrido
Submitted to the Institute for Data, Systems, and Society on August 14, 2015, in partial fulfillment of the
requirements for the degree of
Master of Science in Technology and Policy
Abstract
This thesis presents an analysis of F.C.C.-measured web page loading times as observed in
2013 from nodes connected to consumer broadband providers in the Northeastern, Southern
and Pacific U.S. We also collected data for multiple months in 2015 from the MIT network. We provide temporal and statistical analyses on total loading times for both datasets. We present four main contributions. First, we find differences in loading times for various web-sites that are consistent across providers and regions, showing the impact of infrastructure of transit and content providers on loading times and Quality of Experience (QoE.) Second, we find strong evidence of diurnal variation in loading times, highlighting the impact of net-work and server load on end-user QoE. Third, we show instances of localized congestion that severely impair the performance of some websites when measured from a residential provider. Fourth, we find that web loading times correlate with the size of a website's infrastructure as estimated by the number of IP addresses observed in the data. Finally, we also provide a set of policy recommendations: execution of javascript and other code during the web browsing test to more adequately capture loading times; expanding the list of target websites and collecting trace route data; collection of browsing data from non-residential networks; and public provision of funding for research on Measuring Broadband America's web browsing data. The websites studied in this thesis are: Amazon, CNN, EBay, Facebook, Google, msn, Wikipedia, Yahoo and YouTube.
Thesis Supervisor: David D. Clark Title: Senior Research Scientist
Acknowledgments
There is a famous joke by a former MIT president that compares being a student here to "taking a drink from a fire hose." Cheekiness aside, I find the analogy very fitting to my own experience. Having pushed my intellectual-and, sometimes, physical-boundaries beyond what I ever imagined, there is simply no way I would have thrived in such an extenuating
environment without the help of many.
Let me begin by thanking the staff at the three organizations with which I interacted the most: Ed, Frank and Dava at the Technology and Policy Program (TPP), Sue at the Com-puter Science and Artificial Intelligence Laboratory (CSAIL), and Kate at the Department of Political Science. I am especially grateful to Barb DeLaBarre, the Academic Administrator of TPP. As one of my fellow students said "if I did not meet Barb [and received what is prac-tically pro bono therapy] on a regular basis, surely my life would fall apart and everything would go to pieces."
Dr. David Clark -my thesis supervisor- has been a grounding stone of my research experience since 2013. I appreciate him taking the time to meet me and enlighten me with his profound understanding of the quirks and bolts of the Internet. Dr. Steve Bauer, another member of the Advanced Network Architecture group at CSAIL, has also been kind enough to guide me this past year. Steve's advice on all matters technical has provided invaluable for a novice data scientist and Internet Explorer like myself, and this work certainly could not have been completed without his help. Finally, I cannot end this paragraph without mentioning my former advisors and mentors: Prof. Nazli Choucri, at MIT; Professors Juan Carlos Grieco, Juan Bogado and William Colmenares, at U. Simon Bolivar; Prof. Gunnar Bolmsj6, then at Lund U.; Dr. Jacob Svendenius, then at Haldex; and Miguel Velarde, at that long-time second home of mine, Guayoyo en Letras magazine.
I am thankful to the sponsors of my research assistantships during these past two years:
the Office of Naval Research, the National Science Foundation and the Hewlett Foundation.
My fellow TPPers are the smartest, most fun people I have ever met. I understand this
is a bold claim, but there is just no other way to describe them. Thanks for making the darkest, coldest of days warm, fun and fuzzy. Special mention to the Edgerton Control
Center (Corinne, Stacey and Lauren) and Henry in TPSS; my partner in crime in long lab nights and occasional cigarettes, Cecilia; and the rest of the regular "technology and party program" crowd: Tessa, Tiziana, Scott, Nora, Alejandro, Pierre, Julius, Erin, Ben and Jiyoung (that honorary TPPer that happened to go to Harvard.)
Two years ago now, a Texan, a Canadian, a Michigander and a Venezuelan set up a rather unusual social experiment. They decided to live together in one of the liberal-academic bastions of the world: Cambridge, Massachusetts. They founded 'Murica house, and about a year later a Mississippian-Floridian joined them in the arduous task of maintaining a
"play-hard, party-hard" embassy.
Jokes aside, I will be forever grateful for my time in this house with Justin, Jacob, Chris and John. There is a fond place in my memory for the superb conversations we had in our kitchen, propperly equipped with patio furniture! You guys are like my brothers.
I am at risk of writing the longest acknowledgements section in the history of MIT, but no
such thank you note would be complete without mentioning Robert. Thank you for caring for me and for your patience, even when I had sunk into a self-absorbed PhD decision mania; being by your side made my life infinitely better during this stressful time. You rock!
Last but definitely not least, I thank my family (Arelis, Remigio and Wlady) for remind-ing me there is a home for me somewhere in this convoluted world, and for nurturremind-ing the academic in me from the very beginning. It has been six years of me living in foreign lands, and you have been one of the few constant sources of much-needed emotional support.
Contents
1 Introduction
1.1 B ackground . . . . 1.2 R esults . . . .
1.3 Thesis Organization. . . . . 2 Web Browsing and Network Measurements: a Primer
2.1 Web Browsing: How Does it Work? . . . . 2.2 Network Measurements: Description and Relevance . . . . 2.2.1 M etrics . . . .
2.2.2 Congestion . . . . 2.2.3 Quality of Experience (QoE) . . . . 2.2.4 Factors Impacting Quality of Experience . . . .
2.2.5 Measuring Broadband America . . . .
3 Analysis of Web Browsing Test Data
3.1 Measuring Broadband America's Web Browsing Test . . . . .
3.1.1 Technical Overview . . . .
3.2 Analysis of F.C.C. Web Browsing Test . . . . 3.2.1 Data Included . . . .
3.2.2 Loading Time Boxplots . . . .
3.2.3 Localized Congestion . . . . 3.2.4 Diurnal Variation . . . .
3.2.5 Step Changes on Loading Times for a Specific Website
15 16 17 18 19 19 21 21 22 23 24 25 27 . . . . 27 . . . . 27 . . . . 28 . . . . 29 . . . . 29 . . . . 36 . . . . 37 . . . . 42
3.2.6 Drop in Facebook Loading Time and Bytes Transferred . . . . 45
3.3 Analysis of MIT-Collected Data . . . . 45
4 Implications for Quality of Experience Measurements and Public Policy 53
4.1 Relative Value of Web Browsing Data . . . . 54 4.2 Limitations of Loading Times Reported by the F.C.C. for QoE Measurements,
and Policy Recommendations to Address them . . . . 54 4.3 Measuring the Impact of Content Delivery Networks . . . . 57
4.4 Diurnal Variation for Each Target Website . . . . 57
5 Conclusion 61
List of Figures
3-1 Boxplot of total loading times (in milliseconds) of different websites for all of
2013, measured from the Comcast network in the Northeast, with an
adver-tised speed of 20 M bps. . . . . 32 3-2 Boxplot of total loading times (in milliseconds) of different websites for all
of 2013, measured from the Cablevision network in the Northeast, with an advertised speed of 15 Mbps. . . . . 33 3-3 Boxplot of total loading times (in milliseconds) of different websites for all
of 2013, measured from the Verizon network in the Pacific, with advertised speeds between 25 and 50 Mbps . . . . 34 3-4 Boxplot of total loading times (in milliseconds) of different websites for all of
2013, measured from the Cox network in the South, with advertised speeds
between 12 and 25 Mbps . . . . 35 3-5 Yearlong time-series of loading times from the Cablevision network (15 Mbps)
in the N ortheast. . . . . 38 3-6 Yearlong time-series of loading times from the Comcast network (20 Mbps)
in the N ortheast. . . . . 39 3-7 Yearlong time-series of loading times for Wikipedia, measured from units
con-nected to the Internet through the Verizon network in the Northeast, with advertised speeds between 15 and 25 Mbps. . . . . 40
3-8 Time-series of loading times for Amazon and Wikipedia in January 2013,
measured from units connected to the Internet through the Verizon network in the Northeast, with advertised speeds between 15 and 25 Mbps. . . . . 41
3-9 Yearlong time-series of loading times for CNN, measured from units connected
to the Internet through the Comcast network in the Northeast, with an ad-vertised speed of 20 M bps. . . . .
3-10 Yearlong time-series of loading times for Yahoo, measured from units
con-nected to the Internet through the Time Warner Cable network in the South, with advertised speeds between 15 and 20 Mbps .. . . . .
3-11 Yearlong time-series of loading times for msn, measured from four different
providers in three regions. Note that although loading times are different in nominal terms, a similar increase can be seen during the second quarter (days
90-120). . . . . 3-12 IP address and loading times for msn, measured from the Cox network in the
South. . ... ... ... . . ... .... 3-13 IP address and loading times for YouTube, measured from the Verizon network
in the Pacific. . . . . 3-14 Total loading time for Facebook, measured from the AT&T network in the Pacific. The visible drop in loading times occurs on May 7th, 2013. . . . . . 3-15 IP address and loading times for Facebook, measured from MIT. The two
high-lighted periods show variations in loading times that correspond to changes in the server's IP address blocks. . . . . 3-16 Total Loading Times for Google and Yahoo, measured from MIT. . . . . 3-17 Histograms of loading times of different websites measured from MIT...
4-1 Median loading time and number of unique IP addresses for eight target web-sites, measured from fiber and cable providers (all but Frontier and AT&T.) 4-2 Average diurnal change in loading times for each target website, including
data for all 12 providers in the three regions studied. . . . . 4-3 Change in loading times for each target website, measured at MIT from March
13th to June 20th, 2015. ... ... 42 43 44 46 47 48 49 50 52 58 59 60
A-1 Histograms of loading times of different websites for all of 2013, measured
from the Comcast network in the Northeast, with an advertised speed of 20
Mbps. ... ... 66
A-2 Histograms of loading times of different websites for all of 2013, measured
from the Cablevision network in the Northeast, with an advertised speed of
15 M bps.. . . . .. . . . 67 A-3 Histograms of loading times of different websites for all of 2013, measured
from the Verizon network in the Pacific, with advertised speeds between 25 and 50 M bps. . . . . 68
A-4 Histograms of loading times of different websites for all of 2013, measured from the Cox network in the South, with advertised speeds between 12 and
List of Tables
3.1 States included in each region for the data analysis presented in this chapter. 30 3.2 Providers, advertised speeds, number of units (whiteboxes), and technologies
studied for each region. . . . . 31
4.1 Total bytes transferred and loading times from Google Chrome's developer to o ls. . . . . 5 5
Chapter 1
Introduction
No service should be stuck in a "slow lane" because it does not pay a fee. That kind of gatekeeping would undermine the level playing field essential to the Internet's growth. So, as I have before, I am asking [the F.C.C.] for an explicit ban on paid prioritization and any other restriction that has a similar effect [11.
President Barack Obama, 2014.
When speaking about "gatekeeping" in the above policy excerpt, the President follows a narrative on network neutrality that dates back to at least 2003 [2-4] and is prevalent in liberal media [5-71: websites 1 need to be protected from undue discrimination by broadband providers (ISPs.) Given ISP's control over last-mile networks-those that reach the users' homes- websites can be blocked or "throttled" by the ISP if they offer competing services or simply refuse to pay a high fee. The quality of the experience (QoE) of the users with such websites could be degraded as a result.
In order to test the validity of such claims, measurements on the performance of websites (such as Google or Yahoo) as experienced by residential broadband subscribers are needed. However, collecting such data carries significant challenges, as the users-ordinary citizens-are distributed all over the United States, and the required time-scale and frequency of measurements adds considerable complexity. Further, many reports, including those by the Federal Communications Commission, tend to focus on performance of a single part of the
Internet2; since content of websites needs to be delivered from the target websites' servers to the users' devices at home, such partial-network analysis can only imperfectly capture loading times experienced by users.
We address the characterization of web browsing loading times by analyzing two datasets: a relatively unexplored set of measurements collected by the F.C.C. regarding web brows-ing performance for residential broadband subscribers; and our data collected from network probes at the Massachusetts Institute of Technology. In particular, we provide extensive temporal and statistical analyses on total loading times for nine top websites in the U.S., measured at actual subscribers' homes in three geographic regions and M.I.T. We use such analyses to: characterize diurnal variation in website performance; provide evidence of the impact of infrastructure beyond the ISP-particularly the target website's number of IP addresses-on web performance; and suggest changes to F.C.C.'s testing procedures to ade-quately capture website loading times as experienced by end-users.
1.1
Background
Much of the network neutrality debate, and most of what the F.C.C. reports, focuses on one section of the network: the access network, those that connect users' homes to the rest of the Internet. Although performance of the last-mile is critical for web browsing [81, other systems can greatly impact loading times experienced by the user-and, consequently, the quality of their experience with the web
[9].
These non-ISP systems include specialized content delivery networks, transit providers and, importantly, the networking and hosting infrastructure of the target website itself.In order to visualize the importance of systems beyond the access networks, it is useful to draw an analogy between web browsing and catalog mail orders. When a shopper wants to buy a product from a print catalog, she places an order in the mailbox, addressed to the retailer. Her neighborhood mailman would then bring the envelope with the order to a mail processing center, where it would be routed to subsequent processing centers, until it
2
In the case of the F.C.C., the focus is on performance of the access networks; although this last-mile performance is critical for web browsing quality of experience, it is only one of the systems involved in delivering content.
reached the retailer's neighborhood. There, a mailman would deliver the product order to the retailer's building. Then, the retailer would need to process the request by examining the list of items the shopper ordered; prepare the packaging to ship the products; and drop the boxes at the post office, where it would follow a reverse route all the way to the shopper's home. Delays at any point in this delivery chain, including the processing time inside the retailers facilities, increase delivery times due to the sequential nature of catalog mail orders. To some approximation, that is also how web browsing works: the user tells her browser where she wants to go; the browser sends a request for a site, and that request packet is routed initially through the user's ISP (the mailman); the packet then travels to either a delivery network, a transit provider, or both (mail processing facilities); and it is delivered to the target website, where the servers (analogous to the retailer) must process the request and prepare the objects to send back to the user's device. The packets with this information then follow a route back. It follows that delays at any point in the network (delivery chain) would increase the user's wait for her content-a.k.a. the total web loading time.
Characterizing end-to-end performance is, then, necessary to study web browsing Quality of Experience (QoE). To this end, we analyze a subset of web loading times measured by the F.C.C. from households in the Northeastern, Southern and Pacific U.S. Nine websites are included in our study: Amazon, CNN, EBay, Facebook, Google, msn, Wikipedia, Yahoo and YouTube. To validate our inferences, we also collect and analyze loading time data for these nine websites from M.I.T.
1.2
Results
We find that performance for different websites is diverse as a result of a myriad of factors, as we explain in the next chapters:
e Size of the target website's infrastructure-including internal or hired content delivery
networks-which impacts its ability to deliver content and respond to requests.
9 Usage patterns, in particular diurnal variation of users' browsing activity, which results
" Localized congestion along connection paths providing links from specific providers to
target websites, resulting in reduced effective throughput and increased loading times.
" Architectural changes on the website's server-end, including the allocation of additional
IP address blocks and hosting capabilities.
" And congestion in the ISP's internal network, which increases loading times for all
websites.
We provide evidence showing the impact of all the above factors on web loading times. Our results are displayed in five forms. First, we provide histograms of web loading times from a single provider and region, showing difference in performance for various websites. Second, to our knowledge, we provide the first temporal analysis of F.C.C. data for twelve continuous months, showing incidences of localized congestion and persistent diurnal varia-tion. Third, we explore the influence in performance of target websites' infrastructure, by correlating time-series of loading times and IP addresses. Fourth, we aggregate loading times for each website from all providers and regions analized, and compare it to the apparent size of their networking infrastructure. Fifth, we compare overall diurnal variation for each tar-get website, by looking at median loading times at different times of the day. Finally, we validate our inferences by repeating the previous five analyses on data collected at M.I.T.
Finally, we show the limitations of data collected by the F.C.C. regarding web browsing loading times, and explain why it underestimates those experienced by real users. We proceed to suggest changes to the web browsing test in order to address some of these limitations; and provide some considerations regarding measuring packet loss.
1.3
Thesis Organization
The rest of this thesis proceeds as follows. Chapter 2 presents an introduction to the technical aspects underpinning web browsing and measurements. Chapter 3 includes the bulk of the data analyses of this thesis, on both F.C.C. and M.I.T.-collected measurements. Chapter 4 presents high-level inferences of individual website performance. Finally, we present our conclusions in Chapter 5.
Chapter 2
Web Browsing and Network
Measurements: a Primer
Quality of Experience (QoE) relates to how users perceive the quality of an application. To capture such a subjective measure ... is an art on its own [10].
Kuipers et al., 2010.
In this chapter, we introduce basic concepts related to web browsing and network mea-surements. We begin by describing the general process behind web browsing. Then, we present the network metrics used throughout this thesis. Further on, we present some con-siderations regarding network congestion and how it is defined by some of the actors involved in web browsing. Sections 2.2.3 and 2.2.4 present an overview and factors affecting Qual-ity of Experience for web browsing. Finally, the last section briefly introduces Measuring Broadband America, the project of the Federal Communications Commission that produced the datasets we analyze in subsequent chapters.
2.1
Web Browsing: How Does it Work?
Although the applications built on the web are ever-transforming, the basic set of operations that occur when a Uniform Resource Locator (URL, such as www.mit.edu) is typed into a web browser has remained relatively constant over the years. This section will provide a
brief description of such operations to inform our exploration of QoE for web browsing. There are four general actions executed when loading a website
[8]:
1. DNS lookup (also called DNS resolution)
2. TCP connection establishment
3. Server response (on the target website's end)
4. Object download
We now provide brief descriptions for each of the above actions. DNS (Domain Name Server) resolution is usually the first step to load a website. During DNS resolution, a (usually) remote DNS server will tell the user's browser the IP address in which it can find the target website.
Once a target IP address is acquired, the browser attempts to initiate a (usually Trans-mission Control Protocol, or TCP) connection with the intended remote server'. TCP connection establishment follows a process called a three-way handshake, in which the client (web browser) sends a synchronization message, the server (target website) returns an knowledgement message, and finally the client acknowledges the receipt of the server's ac-knowledgement by sending another message. A total of three messages are exchanged, which adds some round-trip travel times (RTTs) to the overall connection time.
Once the TCP connection is established, the third step is for the server to prepare the content it will send to the client. Content is divided in objects. Once the server has prepared the content, the fourth step will be for the browser to download the initial objects associated with the URL, which is often a HyperText Markup Language (HTML) file. Time to First Byte (TTFB) measures the time from initiating DNS resolution to the beginning of this initial download, when the client-the end-user's browser-receives the first payload byte.
Then, depending on the website, further actions might occur at the browser (for example, executing Javascript code), and additional content might be downloaded. Among those extra resources to be fetched, there are two types of objects: "static, in which case the URL
'Note that "connection" does not imply a direct link between the end-user's browser and the target website; rather, the connection includes anything from several to tens of mid-points or routers.
[indicating
where to find the object] is in the [initial] homepage itself; or dynamic, in which case the URL is determined by running active scripts."[8]
Unsurprisingly, the process to load a web page varies greatly from website to website. Simple pages, such as www.wikipedia.org, will be completely loaded after a number of re-quests that is considerably lower than those required by more complex sites, such as edi-tion.cnn.com.
2.2
Network Measurements: Description and Relevance
2.2.1 Metrics
Here we describe several metrics relevant to the web browsing test of the Federal Communi-cations Commission (F.C.C.), one of the main datasets informing this thesis. The test itself will be described later in this chapter.
Throughput refers to the rate at which information is transferred between nodes of the
network. In the context of residential broadband, it is typically expressed as the maximum download speed advertised by the Internet Service Provider (ISP), such as Comcast or Ver-izon. Throughput is normally expressed in megabits per second or Mbps, and has been the traditional indicator of network performance used extensively in reports by the F.C.C.
Time to first byte (TTFB) refers to the period that starts with a request to initiate
a connection and ends with the reception of the first byte. TTFB is typically expressed in milliseconds (ms.)
Total download time is the time it takes the user's browser to download the contents
of the target website, including those parts delivered from third party servers.
Internet protocol (IP) address is a number assigned to each device connected to a
network, including website hosts. The majority of Internet traffic uses the IPv4 standard, which consists of four blocks of one byte each2. As mentioned in the previous section (2.1), a
DNS resolution is required to translate domain names (such as example.com) to IP addresses
(such as 93.184.216.34, or the corresponding network address of example.com.) Finally, a
higher number of IP addresses for a single website typically signals a larger, more complex network (with more hosts that need addressing.)
2.2.2 Congestion
Definitions of congestion in computer networks are far from uniform. For a study to have any hopes of characterizing QoE, however, network congestion is a necessary consideration, given its impact on web browsing performance. Let us start with a simple definition: "Internet congestion occurs when a part of the Internet, [for example] a link or server, does not have the capacity to service all the demand presented to it." [12]
Given this definition, congestion can be present at any point along the connection path from a user's device to the target website3. A typical experience of browsing the web might require using network infrastructure of: a service provider, such as Comcast or Verizon; a transit provider or a content delivery network, such as Akamai; and the target website, for example Google or CNN. These actors provide disparate services to the user (some of them do not contract with the user at all), and may define congestion differently given their operational needs and constraints. Below we present some of such definitions, as a starting point for our later discussion of QoE.
From a technical perspective congestion is present when the data input "rate into a
[link] exceeds the service rate of the
[link]
at a point in time"[131,
usually resulting in the build up of an input queue in that link. In more practical terms, congestion on the Internet is signaled by dropped packets-once the queue (buffer) is full, the router at the congested link has no place to store another incoming packet and must discard it. A packet that is "dropped" will signal the sender to slow down4 and to retransmit that particular packet.Drops usually occur because a link (meaning the connection between two devices, including routers) is congested, and more specifically because the input queue is full
[12].
From a service provider's perspective congestion is usually defined as high
uti-lization of a link (over 70 or 80 percent of its capacity) for a period of several or more
3
1n fact, Transmission Control Protocol (TCP), one of the central protocols of the Internet, operates
under the assumption that the location of congestion is unknown.
minutes
[13].
This definition accepts that some packet drops are inevitable, given variations in user demands and the very large size of most provider's networks. Providers are concerned with persistent congestion, which can impair connection quality for multiple users.Content providers usually care more about the performance of their application on the
user's end. Netflix (a large video streaming service), for example, has displayed messages on users' screens warning them that their service provider's network is "crowded."
[141
Location of congestion is somewhat irrelevant for content providers; if any link along the path is experiencing severe congestion, performance of the application in question will likely degrade. Finally, users normally do not concern themselves with Internet congestion, so long as their connection and applications are working to their satisfaction. When some noticeable performance impair occurs, such as significant increases in website loading times, users might become aware of network congestion. From there on, they could complain to their network or content providers, or simply stop browsing in that particular moment; the quality of their experience (QoE) with the web is affected.2.2.3
Quality of Experience (QoE)
According to the International Telecommunication Union (ITU), QoE "refers to the overall acceptability of an application or service, as perceived subjectively by the end user."
[10]
QoE is, then, inherently hard to measure, and depends on factors other than network connectivity. One could imagine a scenario in which a user's screen is damaged, and the visual quality of content displayed is therefore perceived as poor. No action taken at any location in the network could improve this aspect of the user's experience.Most cases are not as extreme. Kuipers et al. provide three groups of parameters that affect QoE: quality of the content, human perception, and Quality of Service (QoS.) [10] Of these, only the last is directly measured by the data analyzed in this thesis; however, some
QoE
inferences can be drawn from changes in network metrics. Faster connection speeds, for instance, theoretically lead to lower loading times; these shorter waits for content generally improve user experience.QoS
is a "set of standards and mechanisms for ensuring high-quality performance for critical[networked]
applications ... The goal of QoS is to provide preferential delivery servicefor the applications that need it by ensuring sufficient bandwidth, controlling latency ... and reducing data loss" (emphasis added.)
[151
Although all of these factors impact the quality of a user's connection, only latency is perceived by the user; most people do not think about (or get frustrated by) how many millions of bits their computer has received in a second (what throughput measures.) Rather, users normally detect longer loading times (latencies), one of the main foci of our analysis on Chapter 3.2.2.4
Factors Impacting Quality of Experience
QoE, as we have defined it, can be affected by the performance of all the systems involved in delivering content to the user. These include the infrastructure of the target website, the network of the service provider, (leased or owned) content delivery networks, transit providers, and even the quality of the user's residential wireless connection. In this section, we will briefly discuss each of these factors impacting QoE.
One simple example can illustrate the diversity of QoE-affecting systems: if a target website's server is not in service, and as a result the user's browser displays an error message,
QoE
is severely impaired because there is no website to experience in the first place. In reality,QoE
ranges from flawless performance to complete outage.Infrastructure of the target website is critical for QoE as it is the source of much'
of the content delivered to the user. In particular, specific resources requested by the user-for example, a news article-need to be fetched and delivered by server-side systems. An explanation of the details of such requests go beyond the scope of this thesis, but suffice to say here that several types of computing infrastructure are involved, including data centers and interconnection links to third-party content providers (such as advertisement companies.) Finally, geographic distance (and, consequently, the distance in network terms) from the user's home to the target website's server can increase loading times.
Content delivery networks (CDNs) can greatly improve website performance as seen by the user. CDNs are a "collaborative collection of network elements spanning the Internet,
where content is replicated over several mirrored Web servers in order to perform transparent and effective delivery of content ... by maximizing bandwidth, improving accessibility, and
5
maintaining correctness" [16]. Further, CDNs "are typically deployed at the edge of ISPs to reduce the latency between the end-host and the content"
[8].
Many big content providers (including Google and Netflix) have their own CDN. Many other websites rely on third parties, such as Akamai or Level 3, to improve the quality of their users' experience. Network delivery techniques, such as caching (creating local copies of content at the user's computer) or progressive video streaming, can also contribute to the betterment of performance.
Service providers' infrastructure have direct impact on QoE for all networked
appli-cations, since most subscribers are only connected to the Internet through their home access point. Therefore, congestion on their network, or at any interconnection point with a target website or transit provider6, can severly affect QoE.
Finally, quality of the wireless connection at home can degrade the performance of any networked application, since it is the final (and, often, only) link to the user's device.
2.2.5
Measuring Broadband America
This thesis is based largely on analysis of the web browsing test produced by Measuring Broadband America (MBA), a project of the F.C.C. aimed at studying broadband perfor-mance in the U.S. SamKnows, the Commission's contractor, deployed thousands of white-boxes that connect to the user's home network (either as a bridge or as a router), and perform
7
connection tests to external websites every hour
MBA's web browsing test measures how long it takes to download the "HTML front page for each web site and all associated images, JavaScript, and stylesheet resources" [17] of nine popular websites: Amazon, CNN, EBay, Facebook, Google, MSN, Wikipedia, Yahoo and YouTube. In addition to loading time, the test provides TTFB for each measurement. These times should be affected by all systems along the connection path, as the download is made from the actual website.
6
We use this term loosely to refer to any network not belonging to either the user's service provider or the target website. These include, but are not limited to, backbone providers, CDNs, and other service providers.
7Other
tests are performed to centralized nodes of Google's M-Lab and Level 3's infrastructure; however, this thesis only uses the data from the web browsing test, which connects exclusively to external websites.
Chapter 3
Analysis of Web Browsing Test Data
An Open Internet ... means consumers will demand more and better
broadband as they enjoy new lawful Internet services, applications and content. Federal Communications Commission, 2015.
3.1
Measuring Broadband America's Web Browsing Test
3.1.1
Technical Overview
In this section we present an overview of the F.C.C.'s web browsing test, one of fourteen tests run by SamKnows whiteboxes. Every hour1, the test node attempts to download the HTML frontpage and associated resources for each of the following URLs2
* http: //edition.cnn.com
* http://www.amazon.com
" http://www.ebay.com
" http://www.facebook.com/policies " http://www.google.com/mobile
'Tests were not run when "there was any [user-generated] Internet activity beyond a defined threshold value." [18]
2
e http://www.msn.com
" http://www.wikipedia.org " http://www.yahoo.com " http://www.youtube.com
In our analysis, we have looked at four variables in the web browsing test's raw data, released to the public by the F.C.C.3: total download time, time to first byte (TTFB), resolved IP address, and number of bytes transferred. Relevance of some of these metrics for QoE is discussed below; definitions and relevance of TTFB and IP addresses is included in Chapter 2.
Total download time measures how long it took the whitebox to fetch all the initial
resources of the website. Higher loading times generally lead to QoE degradation; a delay as small as 100 milliseconds can be noticed by humans [191. Further, a page loaded in a full second or more will lose the user's full attention, and after ten seconds the user might switch to a different task altogether
[20].
An important limitation of the total download time as reported by the F.C.C. (discussed more extensively in Chapter 4) is its failure to account for javascript and other resource execution, which constitutes a critical portion of complex websites' content. As a result, reported loading time is an underestimate of what users might experience.
Finally, number of bytes transferred indicates the size of the page fetched by the whitebox. This metric will be relevant mostly for our discussion of Facebook's drop in
loading times (see Section 3.2.6.)
3.2
Analysis of F.C.C. Web Browsing Test
We analyzed the MBA web browsing data for all of 2013 for units located in the Northeastern, Southern and Pacific United States, and this section will present the results4. We find
3
As labeled in the data dictionary (available on the F.C.C. website): fetch time, bytes total, ttfb avg time, and address
4
We present a small subset of the tables, charts and statistical analyses of the data. For the complete set, as well as the scripts and filtered data, please refer to the Thesis Supplemental Materials, available on
evidence of diurnal variation for most providers and targets, in the form of increased website loading times at peak hours (between 7 and 11pm5) and in the middle of the day (between l1am and 3pm). We also find significant variation of loading times to different websites from a single provider's network.
In the data presented in this section, there is also evidence of: variation in loading times of a single website across multiple providers; localized and persistent network congestion;
and load-sharing schemes on websites' server-ends.
Finally, for the specific case of Facebook, we discuss a sharp drop in loading time and number of bytes transferred in May 2013.
3.2.1
Data Included
We include data from units located in the Northeast, South and Pacific regions of the U.S. Table 3.1 presents which states are included in each region'. Our analysis includes units in homes connected to the Internet using the three prevailing communication technologies in the country: cable, DSL and fiber.
Internet Service Providers to analyze were selected among those with the highest number of units present in the F.C.C. study, with the additional goal of including a diversity of advertised speed tiers. Table 3.2 shows the network operators included in our analysis for each region, as well as number of units and communication technology for each provider7.
3.2.2
Loading Time Boxplots
Our analysis shows similar distributions for loading times of a single website accross multiple providers, highlighting the importance of server-side infrastructure, content delivery networks and peering interconnection agreements. Figures 3-1 and 3-2 show loading time distributions for all websites8 under study, measured from two providers in the Northeast: Comcast and
the web at dspace.mit.edu under the author's name.
'We use the same definition of "peak time" as the F.C.C. [17].
6Within a region, time zones are consistent, which facilitates parsing and filtering. 7
Note that we analyze a subset of all data collected by the F.C.C. in 2013.
8
Note that, due to a sharp and persistent drop in loading times for Facebook in May 2013 (discussed later in this chapter), only data for Janury through April is included.
Region States CT MA ME Northeast NH NJ NY PA RI VT AL AR LA MS OK TX .f CA NV OR Pacific WA
Table 3.1: States included in each region for the data analysis presented in this chapter.
Cablevision9.
Since all target websites for a single provider connect to the user's browser using the same "last mile" infrastructure, differences in website performance can be attributed to systems outside the provider's network. This is reinforced by the fact that websites have similar loading time distributions across different providers, as shown on Figures 3-1 and 3-2 for Comcast and Cablevision, respectively.
In these boxplots, Google and YouTube show smaller boxes that are also located closer to the x-axis, which indicates consistently good performance 0. Conversely, EBay and Yahoo have wider distributions (bigger boxes) located farther away from the x-axis, both indicta-tions of more variability and worse performance.
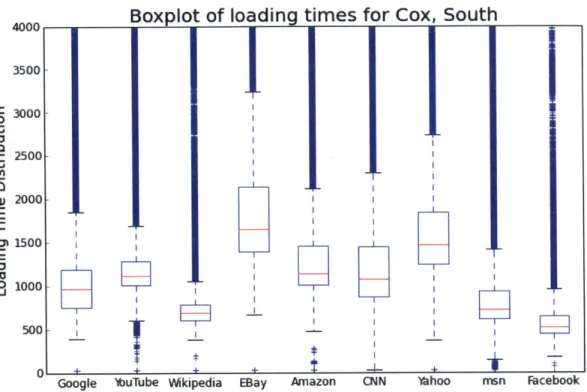
In the Pacific and Southern U.S., the other two regions under study, similar patterns are seen on target website loading time boxplots. Figures 3-3 and 3-4 present the boxplots of data measured from the Verizon Pacific and Cox Southern networks, respectively. Note that our previous inference holds: YouTube and Google still show short distributions closer to the bottom of the plot, signaling better performance. On the other hand, Amazon, EBay and Yahoo show wider distributions located farther away from the x-axis, signaling worse
9
Though the advertised speeds are not identical, differences in web browsing loading time attributable exclusively to throughput are small. For example, for a page size of 1,510 KB, the median page size of CNN measured from Cablevision-which is also the largest page size of all nine websites-the theoretical loading time on a 15 Mbps connection is 805 ms; on a 20 Mbps the loading time is 604 ms. For all other websites the difference in theoretical loading time is smaller, given their smaller page size.
l0Wikipedia's distribution is similar to Google and YouTube's, but this is likely a consequence of its small page size (a median of just under 60 KB for both Comcast and Cablevision). Google and YouTube's loaded page size is ten to twenty times higher than that of Wikipedia.
Region Provider Advertised Number of Technology
Speed Units
Northeast Cablevison 15 100 Cable
Northeast Comcast 20 108 Cable
Northeast Frontier 0.8 to 5 35 DSL
Northeast Verizon 15 to 25 87 Fiber
Northeast
-330
Total
Pacific AT&T 0.8 to 12 67 DSL
Pacific Charter 30 81 Cable
Pacific TWC 15 125 Cable
Pacific Verizon 25 to 50 36 Fiber
Pacific
309
Total
South AT&T 0.8 to 12 67 DSL
South Cox 12 to 25 50 Cable
South TWC 15 to 20 53 Cable
South Verizon 25 to 50 24 Fiber
South Total - - 194
All Regions
-833
Total
(whiteboxes), and technologies Table 3.2: Providers, advertised speeds, number of units
Boxplot of loading times for Comcast 20, Northeast
I I
Google *uTube Wkipedia
I
I I
I I
]
-~ IEBay
Figure 3-1: Boxplot of total loading times
2013, measured from the Comcast network
20 Mbps. The boundaries of the blue boxes
IT~
I
-I-Amazon CNN Mhoo rrsn Facebook
(in milliseconds) of different websites for all of in the Northeast, with an advertised speed of represent the first and third quartiles, and the red line is the median. The whiskers are outliers beyond 1.5 times the inter-quartile range, shown as a black bar. Longer distributions (signaled by bigger boxes) are an indication of higher variability in loading time, whereas boxes located closer to the x-axis indicate lower loading times. Facebook's data is for Jan-Apr.
3000 2500 2000 1500 1000 0 .0
E
500 140 0
Bxplot
of loading
3500 - 11 3000- 1-2500 2000 1500 1000 500[ 0I-I-
I4Google buTube WMkipedia
times
for Cablevision 15, Northeast
EBay
-I-Amazon CNN 'bhoo msn Facebook
Figure 3-2: Boxplot of total loading times (in milliseconds) of different websites for all of
2013, measured from the Cablevision network in the Northeast, with an advertised speed of 15 Mbps. The boundaries of the blue boxes represent the first and third quartiles, and the
red line is the median. The whiskers are outliers beyond 1.5 times the inter-quartile range, shown as a black bar. Longer distributions (signaled by bigger boxes) are an indication of higher variability in loading time, whereas boxes located closer to the x-axis indicate lower loading times. Facebook's data is for Jan-Apr.
C 0 4-' .0 4-' 0 0I 2 1= 0~ C EU 0 -J ---- -- , = --I E:F _Tj
Boxplot of loading times for Verizon, Pacific
II
I I ,+eIL
- IGoogle 1,uTube lWkipedia EBay Amazon CNN )hoo YMfl I-aCeDOOIC
Figure 3-3: Boxplot of total loading times (in milliseconds) of different websites for all of
2013, measured from the Verizon network in the Pacific, with advertised speeds between 25 and 50 Mbps. The boundaries of the blue boxes represent the first and third quartiles,
and the red line is the median. The whiskers are outliers beyond 1.5 times the inter-quartile range, shown as a black bar. Longer distributions (signaled by bigger boxes) are an indication of higher variability in loading time, whereas boxes located closer to the x-axis indicate lower loading times. Facebook's data is for Jan-Apr.
4000 3500 F C 0 E 0 FJ 3000- 2500- 2000- 1500-1000
5001-Ir
- - -_ - - -mn FiaceDOOKBoxplot of loading times for Cox, South I -~ - I - I
-t
I
I
Google )buTube Wikipedia EBay
I
I I
* I
4
Amazon CNN 'ihoo msn Facebook
Figure 3-4: Boxplot of total loading times (in milliseconds) of different websites for all of
2013, measured from the Cox network in the South, with advertised speeds between 12 and 25 Mbps. The boundaries of the blue boxes represent the first and third quartiles, and the
red line is the median. The whiskers are outliers beyond 1.5 times the inter-quartile range, shown as a black bar. Longer distributions (signaled by bigger boxes) are an indication of higher variability in loading time, whereas boxes located closer to the x-axis indicate lower loading times. Facebook's data is for Jan-Apr.
4000 3500 F C 0 E 0 0I
2
3000- 2500-2000[ 1500 1000 500t
performance.
A simple hypothetical example can illustrate the importance of network and computing
infrastructure outside the user's Internet Service Provider (ISP.) If website X delivers its contents to users in the Northeast using CDN Y, and there is congestion on the peering interconnection point between Y and the user's provider Z, the measured performance of X from the user's home-what the F.C.C. measures-will be degraded. Similarly, if X is experi-encing high demand on its server-side, such as a high number of database queries, measured performance can also degrade as a result. In reality, network congestion anywhere along the connection path" and higher server-side loads can constructively interfere to degrade the user experience.
3.2.3
Localized Congestion
We find evidence of network congestion and diurnal variation of loading times for at least some websites for all providers in this study. Some instances of congestion dissipate after a few days or weeks, whereas others are persistent, particularly towards the end of 2013. As can be seen in the time series in this chapter, performance across websites varies wildly; Google and YouTube (owned by Google) generally show the lowest loading times, while
Wikipedia shows the highest.
Let us use this paragraph to explain the methodology employed to produce the time-series plots in this chapter that relate to F.C.C.-collected measurements. For each chart, the data presented is for all units in a particular ISP's network in a particular region. Then,
some of the following raw data is plotted for the specified period: total loading time, time to first byte, and IP address.
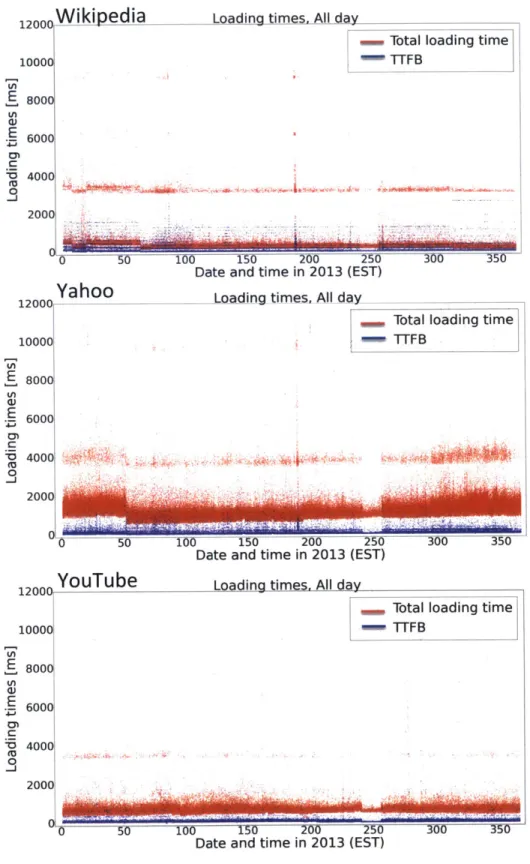
A particularly striking and localized instance of congestion is shown on Figure 3-5 for
Cablevision in the Northeast. The spike in early July (around day 190 of the year) is visible
on the loading times of Wikipedia and Yahoo, but not on those of YouTube, nor any other of the target websites not shown on Figure 3-5. Such spike in loading times is not present for Wikipedia and Yahoo when accessed from other providers in the Northeast, as seen for Comcast in Figure 3-6; which implies higher loading times are unlikely to be a consequence
of slow responses at the website's server-end. All this evidence suggests that a problem exists outside both Cablevision's and Wikipedia's networks, perhaps at a peering interconnection point between either of them and a transit provider or CDN.
3.2.4
Diurnal Variation
Increased loading times at peak periods of each day for several weeks or months can signal underprovisioned interconnection links, as well as overloaded website server-end systems. We find evidence of diurnal variation for at least some websites for all providers under study.
Clear diurnal variation can be seen in Figure 3-7 for Wikipedia in the Northeast, when accessed from the Verizon network1 2. From 7:00pm to 11:59pm, when there is the most
load on residential networks, Wikipedia's median loading time increases by 78% from it's all-day median, from 257 to 780 milliseconds. By comparison, Wikipedia's loading time on the Comcast network increases by 1% at peak times, which suggests that performance degradation is unlikely to be a consequence of server-side load. Rather, higher loading times at peak hours is likely to be the result of a congested link somewhere along the connection path from Verizon users' homes to Wikipedia's servers.
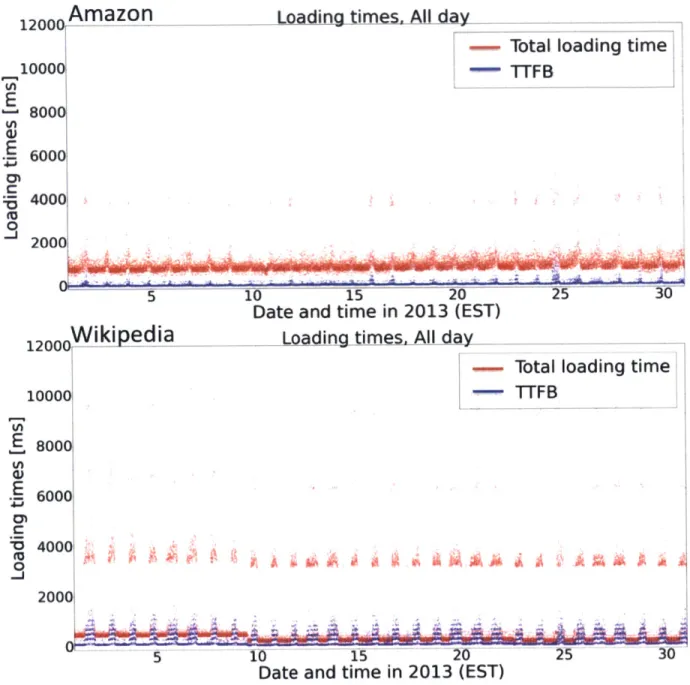
Wikipedia is not the only website showing diurnal patterns on the Verizon network for early 2013. As seen on Figure 3-8, zooming in to the month of January shows diurnal variation in loading times for Amazon as well.
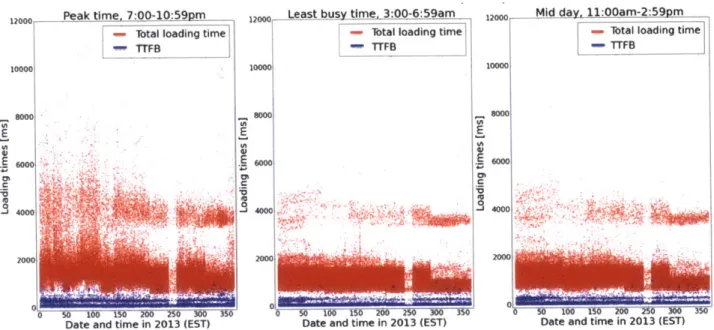
We find several other instances of diurnal variation visible in our charts. One such incidence is shown on Figure 3-9, for CNN and Comcast in the Northeast. Dispersion in loading times greatly increases at peak times, particularly during the first half of 2013, and can be seen by comparing the plot on the left (peak time) to that on the center (3-7am) and that on the right (1lam-3pm). During peak hours, the median loading time for CNN increases by 24.9% when compared to its 24-hour value (from 1,191 ms to 1,488 ms.)
Another provider and target website combination showing strong diurnal patterns is shown on Figure 3-10 for Time Warner Cable and Yahoo in the South. As can be seen in
1 2
Although not shown here, the strong diurnal pattern is also present for Verizon and Wikipedia in the South and the Pacific.
12000
,W
ikipedia
1000 800 U, E 600 400 200 12000 10000 800q 6000 2 0 00 12000 10000 E 800q 6000 4000Lnadina times. All dav
0 50 100 150 200 250
Date and time in 2013 (EST)
Yahoo-300 350
Loading times, All day
Total loading time TTFB
YouTube
Loadina times, All dayTotal loading time
- TTFB
2000
0 50 100 150 20 2P.
Date and time in 2013 (EST)
Figure 3-5: Yearlong time-series of loading times from the Cablevision network (15 Mbps) in the Northeast.
Total loading time
0 TTFB 0 0 0 0 E "Z; 0, -j E 0D MU 0 -j . .. .. 300 350 71
12000
Wikipedia
10000 E 8000 E 6000 0h C 9ULoading times. All day
Total loading time
-- TTFB
4000 2000
1WL oUU
Date and time in 2013 (EST) Loading times. All day
Total loading time
- TTFB
Date and time in 2013 (EST)
Figure 3-6: Yearlong time-series of loading times from the Comcast network (20 Mbps) in the Northeast. U WoUU
12000Yahoo
10000 E 8000 E 6000 M) C EU 0 4000 2000 4 $4Loading times, Al day
- Total loading time
- TTFB
~'~L4~4~
Peak time, 7:00-10:59pm
- Total loading time
TTFB 10000 10000 E 8000 GJ 6000 05 C -5 M0 4000 0 2000 0 12000 10000 -8 000 E E 6 C -4000 2000 0 50 1O 150 200 250 300 350
Date and time in 2013 (EST)
Date and time in 2013 (EST)
12000 Least busy time, 3:O-6:59am 12go
Total loading time] TTFB
Mid day. 11:QOm-2:59pm - tal loading time
- TTFB 10000 8000 6000 -' 4000 20001 0 $0 100 150 200 250 300 350 Date and time In 2013 (EST)
01 _
0 50 100 150 200 250 300 350
Date and time in 2013 (EST)
Figure 3-7: Yearlong time-series of loading times for Wikipedia, measured from units con-nected to the Internet through the Verizon network in the Northeast, with advertised speeds between 15 and 25 Mbps.
80001
4. oo 2000
120
OcrAmazon
10000 8000 6000 40001 2000Loading times. All day
-- Total loading time
-
TTFB
0 5 10 15 20 25 30 120 0 0Wiki pedia
10000w 8000 6000 4000 2000iDate and time in 2013 (EST) Loading times, All day
Total loading time TTFB
A ~ ~
I
Id ~ ! '~~ri ~ ~ ~ ~W~_Ii~ ~ i~_dl_~
5 1t t201n
Date and time in 2013 (EST)
2S 30
Figure 3-8: Time-series of loading times for Amazon and Wikipedia in January 2013, mea-sured from units connected to the Internet through the Verizon network in the Northeast, with advertised speeds between 15 and 25 Mbps.
E
E
CMC5
0E
U) (A 0 C 0In
i .-et hasei liniA lonA~~ Mid day 11:00am-2:59am
12000 reaF. LIMC. V will 12000k !e 1200
ibtal loading time - Tbtal loading time .btal loading time
TTFB TTFB TTFB 10000 10000 10000 wooo WWo ,.. oo 680000 0 6000 CP Ch 200$0 22000
Date and time in 2013 (EST) Date and time in 2013 (EST) Date and time in 2013 (EST)
Figure 3-9: Yearlong time-series of loading times for CNN, measured from units connected to the Internet through the Comcast network in the Northeast, with an advertised speed of
20 Mbps.
this thesis's supplemental materials13, diurnal patterns are present for all providers in the three U.S. regions studied.
3.2.5
Step Changes on Loading Times for a Specific Website
We find evidence of step changes in loading times for a single website when accessed from multiple providers. For example, msn, a content provider owned by Microsoft, shows similar patterns of change in total loading time during the second quarter of 2013, for ten of the twelve providers we analyzed. Data for four of these providers-Comcast in the Northeast, Time Warner Cable (TWC) in the Pacific and Cox and AT&T in the South-are shown on Figure 3-11.
Given the diversity in providers and geography for which this step change is present, it is unlikely a result of localized congestion in the providers' network. This hypothesis is
reinforced by the inexistence of a step change in loading times for other websites during that period.
Rather, evidence suggests there was a change in msn's infrastructure. For example, there
1 3
Available at http://dspace.mit.edu/ under the author's name.
Mid day 11:00am-2: m
Least bus time 3 m