Publisher’s version / Version de l'éditeur:
Vous avez des questions? Nous pouvons vous aider. Pour communiquer directement avec un auteur, consultez la première page de la revue dans laquelle son article a été publié afin de trouver ses coordonnées. Si vous n’arrivez pas à les repérer, communiquez avec nous à [email protected]. Questions? Contact the NRC Publications Archive team at
[email protected]. If you wish to email the authors directly, please see the first page of the publication for their contact information.
https://publications-cnrc.canada.ca/fra/droits
L’accès à ce site Web et l’utilisation de son contenu sont assujettis aux conditions présentées dans le site LISEZ CES CONDITIONS ATTENTIVEMENT AVANT D’UTILISER CE SITE WEB.
The 6th International Symposium on Intelligent Data Analysis,
Proceeding:Advances in Intelligent Data Analysis [Proceedings], 2005
READ THESE TERMS AND CONDITIONS CAREFULLY BEFORE USING THIS WEBSITE. https://nrc-publications.canada.ca/eng/copyright
NRC Publications Archive Record / Notice des Archives des publications du CNRC :
https://nrc-publications.canada.ca/eng/view/object/?id=af7e5360-3ed7-466b-b716-927d4d96ef47
https://publications-cnrc.canada.ca/fra/voir/objet/?id=af7e5360-3ed7-466b-b716-927d4d96ef47
NRC Publications Archive
Archives des publications du CNRC
This publication could be one of several versions: author’s original, accepted manuscript or the publisher’s version. / La version de cette publication peut être l’une des suivantes : la version prépublication de l’auteur, la version acceptée du manuscrit ou la version de l’éditeur.
Access and use of this website and the material on it are subject to the Terms and Conditions set forth at
Knowledge Discovery in the Identification of Differentially Expressed
Genes
National Research Council Canada Institute for Information Technology Conseil national de recherches Canada Institut de technologie de l'information
Knowledge Discovery in the Identification of
Differentially Expressed Genes *
Famili, F., Liu, Z., Carmona-Saez, P., Mullick, A.
September 2005
* published at the 6th
International Symposium on Intelligent Data Analysis. Proceeding: Advances in Intelligent Data Analysis. Madrid, Spain.
September 8-10, 2005. NRC 48129.
Copyright 2005 by
National Research Council of Canada
Permission is granted to quote short excerpts and to reproduce figures and tables from this report, provided that the source of such material is fully acknowledged.
Knowledge discovery in the identification of differentially
expressed genes
A. Fazel Famili1, Ziying Liu1, Pedro Carmona-Saez2, and Alaka Mullick3
1
Institute for Information Technology National Research Council of Canada, Ottawa, ON. K1A 0R6, Canada {fazel.famili, ziying.liu}@nrc-cnrc.gc.ca
2
Centro Nacional de Biotecnología (CNB - CSIC), Madrid 28049, Spain [email protected]
3
Biotechnology Research Institute, National Research Council of Canada, Montreal, QC. H4P 2R2, Canada [email protected]
Abstract: High-throughput microarray data are extensively produced to study the effects
of different treatments on cells and their behaviours. Understanding this data and identi-fying patterns of groups of genes that behave differently or similarly under a set of ex-perimental conditions is a major challenge. This has motivated researchers to consider multiple methods to identify patterns in the data and study the behaviour of hundreds of genes. This paper introduces three methods, one of which is a new technique and two are from the literature. The three methods are cluster mapping, Rank Products and SAM. Using real data from a number of microarray experiments comparing the effects of two very different products we have identified groups of genes that share interesting expres-sion patterns. These methods have helped us to gain an insight into the biological prob-lem under study.
1 Introduction
Over the last few years we have seen an explosion of high throughput microarray data being produced by biologists and other researchers, studying the behaviour of multiple genes at the same time. These experiments, mostly related to gene response analysis, have been applied to several biological processes. One of the most popular applications is to detect the differences of gene expressions between two or more conditions. Each condition may be related to a treatment, physiological state or other type of study. Each experiment normally involves some biological replicates. When conditions or treatments are studied, two hypotheses may exist:
(i) there is no difference in gene expressions between two or more conditions, when conditions or treatments are compared directly. This implies that the true ratio be-tween the expression of each gene in the comparing samples is one,
(ii) there is a significant difference in gene expressions between two or more condi-tions, when conditions or treatments are compared. This implies that the ratios be-tween the two conditions is not the same and the goal is to identify group of genes that behaved differently and look for patterns that indicate their differences. The problem studied here was gene response analysis of microarray data from multiple biological experiments that involve using various treatments. The overall goal of this
vestigation was to identify the effects of these treatments on a particular problem under consideration.
To achieve our data mining objectives, three issues were important: (i) selecting the right method, (ii) applying the correct data analysis strategy, and (iii) providing a certainty factor for each identified gene. Here we applied three methods, two of which are listed in the literature and one that has been introduced as part of our research. No a-priori informa-tion about attributes of interest or their behaviour was used in these studies. However, extensive validation techniques were used to evaluate the set of identified attributes.
The paper continues as follows. We first provide a brief overview of related work and introduce methods applied. We then follow with a detailed section on experimental analy-sis that conanaly-sists of description of the data, our data preprocessing, results and validation. In the last section we present our conclusions.
2 Related work
Accurate identification of differentially expressed genes and their related patterns using high throughput data has been investigated by many researchers. Here we report most of the research related to the knowledge discovery aspect of this paper. Considering gene expression data as a matrix (the rows are genes and the columns the results of each ex-periment), identifying differentially expressed genes can be done by comparing rows or analyzing experiments. While most researchers investigate either gene dimensions or ex-periments, a few investigations combine both [1]. Getz et al [6] proposed a complex, two-way clustering method with the idea of identifying subsets of the genes and samples so that when one group is used to cluster the others, stable and significant partitions are identified. Tang et al [8] also investigated a two-way clustering method in which relationships be-tween genes and experiments are dynamically taken into account. The method iteratively clusters through both gene dimensions and experiments. Troyanskaya et al [9] compare three model-free approaches, to identify differentially expressed genes. These are: non-parametric t-test, Wilcoxon Rank Test, and a heuristic method based on high Pearson cor-relation. Their results using simulated and real data showed very low false positive rates. Cui and Churchill [4] applied modified t-test and ANOVA to detect differential expressed genes in microarray experiments. Similarly, Tsai et al [10] used a combination of type-I error, power of one- and two-sample t-tests and one- and two-sample permutation tests for detecting differentially expressed genes. Their results showed the two-sample t-test to be more powerful than others. Of other comparative studies to be listed is the research on feature selection and classification by Li et al [7] where multi-class classification of sam-ples based on gene expressions is investigated.
Among related work on methods directly related to our research are: (i) Rank Products [2] and (ii) Significance Analysis of Microarrays-SAM [11]. The Rank Products method is based on biological reasoning and has been evaluated on biological data and shown to perform better than a t-test and SAM. SAM, on the other hand assigns a score to each gene on the basis of change in gene expression, relative to the standard deviation of all meas-urements. Performance of SAM was reported in the same paper to be better than
conven-tional methods, in terms of false discovery rates. These methods are explained in the next section.
3 Methods
This section provides an overview of the three methods applied in this research. We start with Cluster Mapping, which is introduced in this paper, and continue with a brief descrip-tion of the other two methods that are listed in the literature.
3.1 Cluster Mapping
This method was originally introduced to search for interesting patterns in time series data [5]. It consists of a combination of unsupervised and supervised learning techniques. Un-supervised learning does not need any user’s involvement or interference during the entire data mining process (e.g. clustering). Supervised learning requires some forms of user’s participation along the line of data analysis process. The first step is to apply a sliding window of size x for partitioning experiments (e.g. time points) and move the sliding win-dow by a step of one. Therefore, for a data set consisting of n experiments (n attribute vectors containing gene expression data), the total number of windows to analyze, S (or number of combined data points selected), is (n-x) + 1. For example, for a data set with 5 experiments (n=5) and a window size of 2 (x=2) with a step of one, we will have S=4.
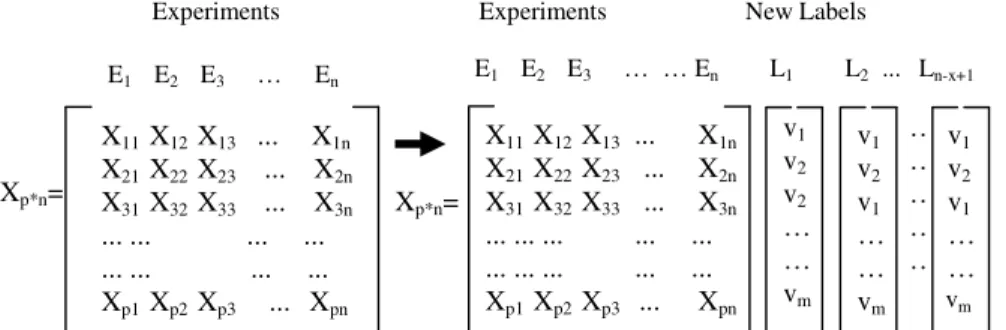
In the second step,an unsupervised learning process, a clustering method, is applied to each window to identify group of genes that, based on a measure of similarity, belong to a particular group. The unsupervised method selected for this step will depend on the charac-teristics of the application for which the data is generated. The gene expression data matrix is then labeled with cluster assignments (Fig. 1).
Fig. 1. Left side of the figure shows the initial structure of the data matrix and right side of the figure
shows thestructure of the data matrix with the list of all clusters obtained with the assigned labels
We then group together genes that always remain in the same cluster in the sequences of clustering on each window. Following is the pseudo code of the algorithm which recur-sively splits the data matrix based on the labels
Experiments New Labels
X11 X12 X13 ... X1n X21 X22 X23 ... X2n X31 X32 X33 ... X3n ... ... ... ... ... ... ... ... ... ... Xp1 Xp2 Xp3 ... Xpn v1 v2 v1 … … vm … … … … … E1 E2 E3 … En Xp*n= X11 X12 X13 ... X1n X21 X22 X23 ... X2n X31 X32 X33 ... X3n ... ... ... ... ... ... ... ... Xp1 Xp2 Xp3 ... Xpn Experiments v1 v2 v2 … … vm v1 v2 v1 … … vm Xp*n= E1 E2 E3 … … En L1 L2 ... Ln-x+1
Procedure SplitData (DataMatrix, StartLabelIndex)
Attribute at StartLabelIndex with outcomes v1, v2 …, vm;
m is number of the clusters at the StartLabel (ini-tially, L1 is the start label);
#Split DataMatrix D into subsets Dv1,…, Dvj, …, Dvm;
count = 0; # for new labels For i=0; i<m; i++ ;
If (StartLabelIndex of Dvi + 1 != n - x + 1)
Then SplitData (Dvi, (StartLabelIndex + 1))
Else
count++; {Dvi ∈ D, Label Dvi with Lcount};
End if End for End
As an example, if we use K-Means for clustering with K=k, the total number of new at-tribute vectors S=s, and then the maximum number of new clusters could be ks. The pat-terns in clusters would then be evaluated based on some domain knowledge and three main properties of cluster centroid information: (i) properties of individual experiments (e.g. mean, median, etc.), (ii) properties of each experiment with respect to comparing experi-ments (e.g. dimensionless terms such as forward-centroid ratio, backward-centroid ratio, etc.), and (iii) properties of all or a sub-set of experiments (e.g. partitioned slope).
In this study, instead of clustering every two or three adjacent experiments or condi-tions, we applied K-Means clustering method, with k=8 to cluster all the genes in each individual experimental condition, which was the average of all biological replicates under that condition. The value of k=8 was chosen based on a set of experiments, in which we tried to minimize the number of genes belonging to more than one cluster. The results showed visually good separation that the highly over- and under- expressed genes were clearly distinguished from other genes under each individual experimental condition. Due to the characteristic of the data, the way of choosing k could be priori, which usually re-quires a good understanding of the characteristic of the data and the background knowl-edge of the data. After choosing the value k, we then applied the algorithm described above to generate a set of new clusters.
3.2 Rank Products
This method has been recently introduced by Breitling et al [2], and is based on ranking of genes across different experiments or replicates. The rank of up-regulation (denoted as rup)
for each gene in each experiment is defined as its position on the list after sorting all genes by decreasing expression values. Using these rank values across experiments, the com-bined probability of observing a certain rank pattern in random lists of genes can be esti-mated as
∏
= = KI i up g i up g r n RP 1( , / ), where , up i gr is the position of gene g in the list of genes sorted by decreasing expression values in the ith experiment and niis the total number of genes. In this way, lower RP values indicate a lower likelihood of observing a gene on the top of
the list of differentially expressed genes (up-regulated genes) just by chance. The same procedure is carried out to detect down-regulated genes, but sorting them by increased expression values. Breitling et al [2] also proposed a simple procedure to measure the statistical significance of observed differentially expressed genes based on the likelihood of observing a given RP value or better in a random set of experiments. The procedure is based on generating a number of random experiments by randomly shifting ranks of genes from the original dataset. Then, for each gene, RP values are calculated in each random dataset and the number of simulated RP values smaller than or equal to a given experimen-tal RP value are counted. We can then calculate the average expected value, E(RP), just dividing by the number of random experiments. For each gene g, the percentage of false-positives if this gene (and all genes with RP values smaller than this cutoff) would be con-sidered as significantly differentially expressed can be also estimated as
(
RP)
/rank(g) Eqg= g , where rank (g) denotes the position of gene g in a list of all genes
sorted by increasing RP value. This estimates the false discovery rate and provides a way to assign a significance level to each gene.
3.3 SAM (Significance Analysis of Microarrays)
This statistical technique was introduced by Tusher et al [11] to identify differentially expressed genes under different experimental conditions. The method assigns a statistics score to each gene by considering the relative change of each gene expression level with respect to the standard deviation of repeated measurements. The relative difference is cal-culated as following: 0
)
(
)
(
)
(
)
(
s
i
s
i
x
i
x
i
d
a b+
−
=
(1)where
x
a(i
)
andx
b(i
)
are defined as the average levels of expression for gene i in condition a and b, respectively, ands
(i
)
is the standard deviation of the repeated experi-ments:[
]
[
]
{
−
+
−
}
=
mx
mi
x
ai
nx
ni
x
bi
q
i
s
(
)
(
)
(
)
2(
)
(
)
2 (2) wherem and n are summations of the expression measurements in condition a and b, respectively. In this equation, q = (1/n1+1/n2)/( n1+ n2-2), where n1and n2 are the num-bers of measurements in condition a and b. s0 is a small constant which is chosen to
mini-mize the coefficient of variation. The genes with scores greater than a threshold are deemed potentially significant. A false discovery rate, which is the percentage of genes identified by chance, is also estimated by performing permutation. The number of falsely discovered genes corresponding to each permutation is computed by counting the number of genes that exceed a user defined cutoff for the induced and repressed genes.
4 Experimental Analysis
We performed a series of experiments to analyze the data, discover the most useful knowledge related to these experiments, and also evaluate the usefulness of CM in multi-experiment comparison. The following sections provide some details on these studies.
4.1 The data sets
The data used in this study were a large data set representing a set of attributes for mul-tiple biological experiments. Each biological experiment had 2-4 replicates, with 4 treat-ments of substance A and B. Each data set contained 31200 data points, with two meas-urements for each attribute of interest. Therefore, each experiment represented a log-ratio of biological stimulate and control for 15600 values. Missing data were flagged and the entire data was normalized using the Lowess method [3].
4.2 Data preprocessing
The preliminary investigation on the data characteristics showed no particular anoma-lies, and there were only 0.29% of the values that were found to be missing. According to the correlation of gene expression among the replicates under the same treatment, four biological samples did not correlate with others and therefore were removed. In addition, 67 clones were removed due to a high standard deviation (threshold used was 1, empiri-cally determined) in duplicated data points. Then the gene expression values of intra dupli-cated clones were averaged. 53 clones were also filtered out due to a high standard devia-tion (threshold used was 1, empirically determined) among replicates. Since some of our analysis methods did not accept data with missing values, we removed 40 data points which contained missing data.Finally, there were 15440 clones across the 8 experiments left for data analysis. They were: 3 replicates of Substance A, 3 replicates of one kind of Substance B and 2 replicates of another Substance B. We note that when CM was applied, the average of the biological replicates under each experimental condition was used. 4.3 Search for patterns
To identify the most informative genes and to discover all associated patterns in the data, we defined a data analysis strategy that is shown in figure 2. We applied the three methods that were described earlier and selected a common strategy to validate the signifi-cance of these genes. The main biological objective was to identify the most informative genes that showed a marked:
(i) over- or under-expression in response to two different preparations of Substance B (common genes among Substance B);
(ii) over- or under-expression in response to Substance B and Substance A compared to untreated cells (common genes among Substance B and Substance A);
(iii) difference in their expression behavior in response to Substance A compared to Substance B treatments (different genes among Substance B and Substance A).
To this end we evaluated the results reported by: (i) CM, SAM and RP, (ii) SAM and RP and not CM. We were further interested to learn about all the genes that were validated using one of the acceptable techniques.
We applied CM, SAM and RP to detect genes that were significantly over- or under- ex-pressed in response to Substance A and Substance B treatments as well as genes that showed differences in their expression patterns between both treatments. Specifically, to identify meaningful clusters applying CM, we obtained new features (e.g.forward centroid slope) from the centroids of the new clusters generated (as described in section 3.1). Two criteria are used to determine whether a gene cluster is differently expressed or similarly expressed under two conditions, the absolute value of centroid and the slope of the centroid under the two experimental conditions.
If the absolute value of the slope was greater than or equal to certain threshold (1 was used in our case, which was determined by a domain expert), and the absolute value(s) of the centroid under either of the two conditions was greater than certain threshold (0.8 was used (in log 2 ratio), which was also determined by a domain expert), then we considered the cluster of genes as differently expressed under the two conditions. Otherwise, if the abso-lute value of the slope was less than certain threshold (e.g. 1), and the absoabso-lute values of the centroid under both conditions were greater than certain threshold (e.g. 0.8), then we con-sidered the cluster of genes similarly expressed under the two conditions. In our experi-ments for RP, the expected RP-values and False Discovery Rate (FDR) were calculated using 100 random experiments (number of permutations) of the same size of the original dataset. We selected genes based on the zero false discovery rate. As for SAM, a one-class response was applied to identify the genes which were highly over- or under-expressed in Substance B (similarly expressed genes among Substance B), and also applied to deter-mine the genes which were highly over- or under-expressed in Substance B and Substance A (similarly expressed among Substance B and Substance A). Two-class unpaired analysis was applied to identify genes which were similarly expressed among Substance B but dif-ferent with respect to Substance A. In order to make proper comparison between the genes
Microarray Experiments Analysis Methods - CM - SAM - RP
Results: Informative Genes
-Group 1 -Group 2 -Group 3 Validation - Biological - Literature - Others Validated Results
discovered by SAM and RP, we applied the following strategy: based on the X number of genes identified by RP, we selected approximately the same number of genes from SAM. We should mention that the false discovery rate for SAM was between 0.38 and 10.00 and the analysis was based on 100 random permutations.
4.4 Results
Our first attempt was to list all the genes identified by the three methods for all biological problems (groups). Table 1 shows the number of genes identified by all three methods. The numbers in brackets represent unique genes and do not include the unknown ones.
Table 1. Number of genes discovered by different methods
SAM RP CM SAM & RP CM & SAM & RP
Group1* 127 104 83 86 (60 known) 69 (46 known)
Group2* 190 216 74 150 (106 known) 71 (48 known)
Group3* 56 45 30 41 (13 known) 25 (9 known)
Group1*: Highly over- and under-expressed genes in Substance B (similarly expressed genes
among all treatments of Substance B). Group2*: Highly over- and under- expressed genes in Sub-stance B and SubSub-stance A (similarly expressed genes among SubSub-stance B and SubSub-stance A).
Group3*: Similarly expressed genes among Substance B, but differently with respect to Substance
A.
The very first observation in this study was that the number of genes reported by CM method, especially in the case of genes that were differentially expressed in the treatments with respect to the control, was less than the other two methods (e.g. 83 for CM, vs. 127 and 104 for the other two, in group 1, in Table 1). SAM and RP methods tend to detect genes that are highly over- or under-expressed based on fold-changes in each condition compared to the control. CM aims to detect genes that show high absolute ratios of treat-ment/control, but also show similarities in their expression patterns across treatments.
To evaluate the usefulness of a complementary method, we defined two main properties for the list of genes in a Venn diagram, as listed in Figure 3. The usefulness of these genes was evaluated at a later step.
4.5 Validation: Biological, Literature and others
To verify the biologically relevant gene expression changes, a series of literature and bio-logical experimental validations were performed based on the random selection of the known genes from each group (unknown genes and replicates were not considered). In this study, we compared the ratios of the positive discovery of the number of genes identified by all three methods and by two only (SAM and RP).
The three methods combined in this study, were able to take into account the statistical significance of the genes, and also the gene expression patterns. Tables 2 and 3 show that the true discovery rate of genes (which were calculated based on biological experimental validation and literature validation) related to the problem under study is increased when
CM is involved for each biological problem (groups 1-2). Table 2 shows the genes found in the literature. Table 3 contains results of biological experimental validation.
Fig. 3. The shadow in dark gray represents the number of genes identified by the three methods. The
shadow in light gray is for the number of genes identified by SAM and RP only, and not CM
Table 2. Number and percentage of literature validated genes from the known gene lists
discov-ered by all three methods and the genes discovdiscov-ered by SAM and RP (refer to fig. 3)
SAM and RP SAM and RP and CM SAM and RP (No CM)
discovery rate discovery rate discovery rate
(dark gray + light gray) (dark gray) (light gray)
Group1* 22/60 known genes = 36.6% 18/46 known genes = 39% 4/14 known genes = 28.6% Group2* 34/106 known genes = 32% 22/48 known genes = 45.8% 12/58 known genes = 20.1%
Group3* 6/13 know genes = 46% 2/9 known genes = 22% 4/4 known genes = 100%
Table 3. Number and percentage of biological experimental (RT-PCR) validated genes from
randomly selected gene lists (refer to fig. 3)
SAM and RP SAM and RP and CM SAM and RP (No CM)
discovery rate discovery rate discovery rate
(dark gray + light gray) (dark gray) (light gray)
Group1* 8/60 known genes = 13% 7/46 known genes = 15% 1/14 known genes = 7%
Group2* 7/106 known genes = 6.6% 6//48 known genes = 12.5% 1/58 known genes =1.7%
CM has obviously been able to reduce the false discovery rate of the other two methods. This is evident from literature and biological experimental validation. For example, in table 2, for group 1 and 2, when CM was applied, the discovery rate increased from 36.6% to 39% and 32% to 45.8%, respectively. However, for group 3 CM did not perform this way. It is important to note that the validated results are based on some arbitrary selection of genes and did not follow any particular selection process. For example, in group3, for SAM and RP (not CM), all 4 genes were evaluated; however for SAM, RP and CM, only 2 out of 9 genes were evaluated. This was due to the amount of time that was required for validation. Table 3 also shows that the CM involvement reduced the false discovery rate for the list of genes only listed by the other two (SAM and RP). For groups 1 and 2, the
discovery rate increased from 13% to 15% and 6.6% to 12.5%, respectively, when CM was applied.
Overall the discovered patterns were very interesting and most of them had not been re-ported or validated before.
5. Conclusion
This paper deals with analyzing data from multiple biological experiments to identify gene responses to different experimental conditions. The main motivation for this research was to complement existing methods to achieve the best discovery rate when one needs to study the behaviour of hundreds of genes using an unsupervised approach. Two of the methods applied are from literature and one is a new approach. These methods have been applied to analyze data from a number of microarray experiments comparing the effects of two very different products. We have identified groups of genes that share interesting expression patterns. Through random selection, we have further validated certain genes from the list of genes identified by these methods. The approach has demonstrated (i) the strength and weakness of the three methods applied to genomics and (ii) that a single method may not be able to identify all gene responses under different experimental conditions, let alone that most methods by themselves provide a large list of genes.
Overall, these methods have helped us to gain insight into the biological problem under study. The results also show that over-fitting may be resolved when multiple methods are applied. In addition to the methods presented here, other methods such as Wolpert’s stacked generalization [12], boosting and bagging also could be suitable. In the future research we will explore the possibility of using different k value for K-Mean clustering, and also applying other clustering techniques such as SOM and Hierarchical clustering. We may also evaluate these methods to other data sets and consider other approaches for gene validation. This would be valuable support for gene identification and gene response analysis using microarray data and many other genomics data mining tasks that require a complex data analysis process.
Acknowledgement
The authors would like to acknowledge the contributions of all members of the BioMine project and a number of former students. Special thanks to Brandon Smith and Rita Lo for their help in data preparation. Thanks to Junjun Ouyang and Bob Orchard for reviewing an earlier version of this paper. Mr. Carmona-Saez is the recipient of a fellowship from Comunidad de Madrid.
References
1. Brazma A and Vilo J., (2000), Gene expression data analysis, Federation of European Bio-chemicalSociety, 480, 17-24.
2. Breitling R., Armengaud P. Amtmann A., and Herzyk P., (2004) Rank products: a simple, yet powerful, new method to detect differentially regulated genes in replicated microarray experi-ments, FEBS letters 573, pp 83-92.
3. Cleveland, W.S. (1979) Robust locally weighted regression and smoothing scatter plots, J.
Amer. Stat. Assoc. 74, 829–836
4. Cui X. and Churchill G., (2003) Statistical tests for differential expression in cDNA microarray experiments, Genome Biology, 4:210
5. Famili, A, Liu Z, Ouyang J, Walker R., Smith B. O’Connor, M, and Lenferink A. (2003) A novel data mining technique for gene identification in time-series gene expression data. ECAI Workshop on Data Mining in Genomics and Proteomics pp. 25–34.
6. Getz G., Levine E. and Domany E. (2000), Coupled two-way clustering analysis of gene mi-croarray data, PNAS 97 (22)12079-12084.
7. Li T., Zhang C., Ogihara M, (2004) A comparative study of feature selection and multi-class classification methods for tissue classification based on gene expression, Journal of Bioinfor-matics, 20(15) 2429-2437.
8. Tang C., Zhang Li, Zhang A. and Ramanathan M., (2001) Interrelated two-way clustering: an
unsupervised approach for gene expression data analysis, Proceedings of the 2nd International
Symposium on Bioinformatics and Biocomputing, , 41-48.
9. Troyanskaya O.G., Garber M.E., and Brown, P.O., (2002) Nonparametric methods for identify-ing differentially expressed genes in microarray data, Journal of Bioinformatics, 18(11) 1454-1461.
10. Tsai C-A, Chen Y-J, and Chen J., (2003) Testing for differentially expressed genes with mi-croarray data, Journal of Nucleic Acids Research, 31(9) e52.
11. Tusher V. G., Tibshirani R. and Chu G. (2001) Significance analysis of microarrays applied to the ionizing radiation response, PNAS, Vol.98 (9), 5116-5121.
12. Wolpert, D.H. (1992), Stacked Generalization, Neural Networks, Vol. 5, pp. 241-259, Pergamon Press.