HAL Id: hal-01872442
https://hal.archives-ouvertes.fr/hal-01872442
Submitted on 18 Sep 2018
HAL is a multi-disciplinary open access
archive for the deposit and dissemination of
sci-entific research documents, whether they are
pub-lished or not. The documents may come from
teaching and research institutions in France or
abroad, or from public or private research centers.
L’archive ouverte pluridisciplinaire HAL, est
destinée au dépôt et à la diffusion de documents
scientifiques de niveau recherche, publiés ou non,
émanant des établissements d’enseignement et de
recherche français ou étrangers, des laboratoires
publics ou privés.
triangles
Athanassios Boudalis, Guillaume Rogez, Benoît Heinrich, Raphael G. Raptis,
Philippe Turek
To cite this version:
Athanassios Boudalis, Guillaume Rogez, Benoît Heinrich, Raphael G. Raptis, Philippe Turek.
To-wards ionic liquids with tailored magnetic properties: bmim+ salts of ferro- and antiferromagnetic
CuII3 triangles. Dalton Transactions, Royal Society of Chemistry, 2017, 46 (36), pp.12263-12273.
�10.1039/c7dt02472j�. �hal-01872442�
Journal Name
ARTICLE
Received 00th January 20xx, Accepted 00th January 20xx DOI: 10.1039/x0xx00000x www.rsc.org/Towards ionic liquids with tailored magnetic properties: bmim
+salts of ferro- and antiferromagnetic Cu
II3triangles
Athanassios K. Boudalis,*
a,bGuillaume Rogez,
cBenoît Heinrich,
cRaphael G. Raptis,
aPhilippe
Turek
bComplexes (bmim)2[Cu3(μ3-Cl)2(μ-pz)3Cl3] (1), (bmim)[Cu3(μ3-OH)(μ-pz)3Cl3] (2) and (bmim)2[Cu3(μ3-OH)(μ-Cl)(μ-pz)3Cl3] (3)
were synthesized (bmim+ = 1-butyl-3-methylimidazolium). Dianionic complexes 1 and 3 were obtained as crystalline solids,
whereas the monoanionic complex 2 was obtained as a viscous paste. Magnetic susceptibility and X-band EPR studies revealed intramolecular ferromagnetic interactions for 1 with small magnetoanisotropy in its ground state (D3/2 ~ 10-3 cm -1) and intramolecular antiferromagnetic interactions for 2 and 3 (-285 and -98 cm-1 average J, respectively) with important
magnetic anisotropy in their ground states stemming from a combination of low magnetic symmetry and antisymmetric exchange interactions. Thermal studies revealed a clear melting point of 140 °C for 1, which is lower than that of its PPN+
and Bu4N+ analogues (1PPN and 1Bu4N, respectively, PPN+ = bis(triphenylphosphine)iminium). Upon cooling, 1 remains molten down to 70 °C. Mixtures of the salts 1, 1PPN and 1Bu4N, exhibited modified melting behaviours, with the mixtures exhibiting lower melting points than those of either of their pure components.
Introduction
Ionic liquids (ILs) constitute an exciting class of materials which has attracted wide interest over the past two decades, with applications ranging from reaction media to lubricants and many more.1 While AlIII salts were among the first ILs,2 metal-containing ILs (MCILs) constitute a relatively small fraction of those reported to date. Among those, MCILs containing paramagnetic ions constitute an even smaller class; after the initial explosion of this domain in the 1990s, it was only in 2001 that (bmim)[FeCl4] was reported and properly identified
as an IL.3 The discovery that this salt becomes a
magnetorheological fluid under weak magnetic fields gave a momentum to the study of magnetic MCILs,4,5 which was further enhanced by the observation that this behaviour is reproduced by DyIII-based MCILs.6 Interestingly, studies on paramagnetic MCILs predate those works, but were focused on other aspects of the materials, disregarding their magnetic properties.7,8
Subsequent to these studies, the magnetic properties of MCILs started attracting more attention, with reports of MCILs containing mononuclear magnetic cations,9–16 mononuclear
magnetic anions17–25 and one report on the magnetic
properties of a triferric cationic MCIL.26 Due to the mononuclear structures of the spin carriers in those magnetic MCILs, the tuning of their magnetic properties, when attempted, focused on modifications of the diamagnetic counterion; e.g., it was demonstrated that changing the countercation charge, two or three [FeCl3Br]- anions could be assembled around it, yielding a higher magnetic moment per formula unit.27 In another approach, modifications to the coordination sphere induced vapochromic transitions from diamagnetic to paramagnetic in a NiII MCIL.13 Due to the mononuclear structure of most MCILs, the surest way of achieving significant modifications of their magnetic properties is changing the metal in the spin-carrying ion altogether.19 Modifications of ligand side-groups may affect certain electronic properties, such as UV-Vis spectra, but not the intrinsic magnetic properties. Moreover, those intrinsic properties concern isolated paramagnetic ions and therefore preclude magnetic behaviours that stem from magnetic exchange interactions (e.g., ferro- or antiferromagnetism). Previous studies with pyrazolate ligands have shown that they exhibit a rich coordination chemistry with CuII, leading to a series of trinuclear complexes. Furthermore, it has been shown that the structure and intrinsic magnetic properties of these complexes can be systematically modified through pH control; in a series of such complexes containing CuII
3 cores the magnetic coupling varied systematically from ferromagnetic to weakly-, to strongly antiferromagnetic.28
These complexes being anionic, the possibility emerged that combining them with bulky countercations might lead to ILs. Since the magnetic properties of the tricopper anions can be
controllably manipulated, this emerged as a promising route to prepare MCILs with tailor-made magnetic properties.
In this work we present the preparation and study of low-melting salts with controllable magnetic properties and tuneable melting points.
Results and discussion
Synthesis of complexes
The complexes were prepared according to the published
procedure for the analogous PPN+ [PPN+ =
bis(triphenylphosphine)iminium] and Bu4N+ salts (Scheme 1),28 with the driving factors being the solution pH and the stoichiometric excess of the added countercation salt, in this case bmimCl. In the case of 1 and 2, the reactions led to the same complex anions as in the previously published procedures, however, in the case of 3, instead of the expected {Cu3(μ3-O)}4+, the similar {Cu3(μ3-OH)(μ-Cl)}4+ core of the same total charge was isolated in crystalline form.
Scheme 1. The molecular structures of the cations mentioned in the text
It is noteworthy that whereas both dianionic complexes 1 and
3 are obtained as crystalline solids, the monoanionic 2 is
obtained as a viscous paste, confirmed by powder X-ray diffraction to be amorphous (Figure S1). This is attributed to the fact that the electrostatic forces in the dianionic complexes are stronger, thus stabilizing crystalline solids at ambient temperatures. However, those forces will be weaker in the
case of 2, thus leading to a liquid product at room
temperature.
Description of structures
Complex 1 consists of a triangular complex anion held together by three μ-pz- ligands approximately coplanar with the Cu3 -plane, and two μ3-Cl- ions situated above and below the Cu3 plane (Figure 1). The structure of the anion is essentially that of the PPN and Bu4N analogues, 1PPN and 1Bu4N,28 and will not be described in detail. The only salient point is the crystallographic disorder of atom Cl2.
As far as the two bmim+ cations are concerned, it is
noteworthy that the butyl group of one is in the gauche conformation around bond C4B-C5B, thus adopting a
gauche-anti conformation, while that of the other is in the gauche-anti-gauche-anti
conformation (Figure S2).
Complex 3 consists of an anion exhibiting a {Cu3(μ3 -OH)(μ-Cl)}4+ metal core, in which an additional chloro bridge occupies the axial positions of Cu(1) and Cu(2) through two elongated bonds (2.659 and 2.799 Å, respectively, Figure 2). The hydroxo O(1) atom is quite pyramidal, situated 0.599 Å from the Cu3
plane, with the sum of the Cu-O-Cu angles being equal to 334.16°. The three pyrazolate ring mean planes exhibit marked deviations from the Cu3 plane, with dihedral angles of 27.26, 14.61 and 10.85° between the Cu3 plane and the pyrazolates containing atoms N(1), N(3) and N(5), respectively.
Regarding the bmim+ cations, a situation similar to the case of
1 is observed, with one n-butyl chain being in a gauche
conformation around bond C4A-C5A, thus adopting a
gauche-anti conformation, while the other adopting an gauche-anti-gauche-anti
conformation.
The anions of complex 3 participate in a H-bonded network
through the chloro terminal ligand Cl3 and the hydroxo proton H10, forming 1D zig-zag chains (Figure S3).
Figure 1. POV-Ray plot of the anion of 1. Hydrogen atoms have been omitted for clarity. Carbon atoms are shown in grey.
Figure 2. POV-Ray plot of the anion of 3. Hydrogen atoms, except for the μ3-OH- one,
have been omitted for clarity.
Melting point determinations
The melting point for complex 1 was visually determined in a glass capillary using a melting point apparatus (Table 1). This was compared to the melting points of previously reported complexes 1PPN and 1Bu4N.
Journal Name
ARTICLE
Table 1. Visually determined melting points (°C) of 1, 1PPN and 1Bu4N and of their
binary equimolar mixtures.
Sample mp(°C) 1 130-145 1PPN 205-207 1Bu4N 199-206 1/1PPN 120-130 1/1Bu4N 120-130 1PPN/1Bu4N 160-170
Moreover, the melting points of equimolar binary mixtures of the three salts were determined, with the mixtures being prepared by thorough grinding of the two solids. These studies indicate that the countercation influences the melting point of the salt, resulting in a ~60 °C lower melting point of the bmim+ salt (1). Binary mixtures also lead to lowering of the melting point, not only when they contain the bmim+ salt, but also in the case of the PPN+/Bu
4N+ mixture, which melts 30-40 °C below its constituent salts.
TGA and DSC studies
The thermal stability and the phase behaviour of the complexes were investigated by TGA, DSC and polarising optical microscopy (POM).
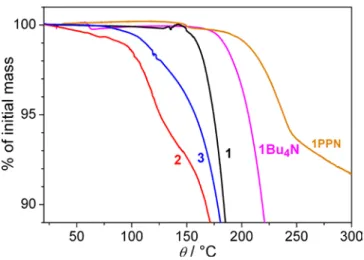
Figure 3. TGA traces for complexes 1, 2, 3, 1PPN and 1Bu4N, the latter complex having
first been heated to 100°C to remove the co-crystallized solvent (see ESI).
Figure 4. DSC traces upon heating (red: first heating; orange: second heating) and cooling (blue) for complex 1. The three traces above were carried on below 100°C and illustrate the irreversibility of the endothermic event at 53°C, attributed to a solid-solid phase transition. The melting transition at 140°C was crossed in the traces below, and the ionic liquid was found to crystallize on cooling.
Complex 1. TGA studies revealed that complex 1 is stable up to
150 °C and rapidly decomposes with weight loss above 160-170°C (Figure 3). DSC and polarizing optical microscopy (POM) revealed an irreversible endothermic process around 53 °C, corresponding to solid-solid phase transition (Figure 4). The complex then melts at 140 °C as indicated by an endothermic process which coincides with the visually observed melting temperature to ionic liquid phase. The crystallization upon cooling was observed around 70 °C, for a rate of 5 °Cmin-1.
Complexes with the same anion as 1. Since the anion of
complex 1 can crystallize with different countercations, we became interested in studying the effect of the countercation on the thermal stability and phase behavior of the salts. TGA studies on the PPN analogue 1PPN showed higher stability, above 170 °C, and a 60 °C increase of the melting temperature. The weight loss is however only displaced by 30-40 °C and now practically coincides with the melting transition, revealed in DSC scans by a steep endothermic process at 205°C agreeing with the transition temperature and states visually determined by POM (Figure 5). Prior to melting, a series of minor peaks are observed in the 80-180°C range of the first heating DSC curve, which originates from structural rearrangements in the crystalline state.
Figure 5. DSC traces for complex 1PPN. The successive heating cycles (red, orange, magenta and olive curves, and corresponding expanded ranges above) revealed the crossing of several irreversible solid-solid transitions, until the final melting at 206°C, temperature around which the decomposition process had just started. Crystallization was not observed on cooling (blue curve), but freezing of supercooled ionic liquid occurred on crossing the glass transition at 70°C.
Figure 6. DSC traces of co-crystallized solvent-free 1Bu4N complex, showing two phase
transitions in solid state, located at 20 and 63°C (red: first heating; orange: second heating) and slightly delayed on cooling (blue). Experiment was stopped below the melting transition, observed with POM around 205°C, because of the weight loss associated with the onset of decomposition.
The Bu4N+ analogue of complex 1, 1Bu4N, shows a sharp weight loss at 62°C TGA curves (~17 to 26%, depending on the batch) due to the release of co-crystallized solvent (Figure S4).
1Bu4N, obtained solvent-free trough preliminary heating to 100°C, showed weight loss due to decomposition above 175°C. DSC experiments were thus not possible above the range of solid-solid transitions (Figure 6), but thermal degradation was sufficiently slow for a rough determination of the melting temperature from POM (ca. 205°C).
Changing the cation from PPN+ or Bu4N+ to bmim+ caused a larger drop of the degradation temperature than that of the melting point of the salt. Only the bmim+ complex is hence stable in the non-supercooled liquid phase, entered at 140°C instead of above 200°C. This result establishes a milestone in the development of ferromagnetic ILs.
Figure 7. DSC traces for complex 2 (red: first heating; orange: second heating, blue: cooling) showing a broad low-temperature glass transition range, corresponding to the progressive liquefying of the frozen ionic liquid.
A route toward low-melting ferromagnetic ILs might also be the preparation of mixtures, since their melting points are in general lower than the ones of pure constituents. The exploratory experiments performed on equimolar mixtures of
1 and 1PPN effectively revealed a further 10 to 15°C decrease
of the melting temperature with respect to neat complex 1 (Table 1). The concept was thus validated, although the system is not adapted due to the high melting temperature of 1PPN, and to the closeness of degradation temperatures. The approach proved however to be promising, once ferromagnetic ILs with thermal properties comparable to 1 will
have become available.
Complex 2. TGA studies reveal that this complex is relatively
stable up to 100 °C (~1% mass loss), before it starts decomposing at higher temperatures (Figure 3). The complex is therefore stable in the fluid ionic liquid phase obtained after progressive liquefying of the pasty sample on heating to 60°C. POM and DSC (Figure 7) confirm that the liquid does not crystallize upon cooling but progressively solidifies through increased viscosity on cooling.
These results are particularly interesting since complex 2
remains in the frozen ionic liquid state at room temperature, unlike 1, which needs to be heated above 100°C for melting to occur.
Complex 3. TGA studies of complex 3 revealed significant
decomposition starting at 110°C, while melting was observed by POM at ~134°C. Since the melting point is above the temperature where significant decomposition occurs, this complex was not studied in detail regarding its thermal properties. DSC performed in the crystalline range only showed a small and broad exothermic event on first heating, presumably due to recrystallization (Figure S5).
Thermal properties data for the three bmim complexes and PPN+ / Bu4N+ analogues are summarized in Table 2.
Table 2. Summary of thermal property data for bmim+ complexes 1, 2, 3, and analogue
complexes 1PPN and 1Bu4N.
1 2 3 1PPN 1Bu4N* Tdec (°C) T95% (°C) 155 175 100 126 110 158 200 238 175 206 Pristine state Final state Cr Cr F. li. F. li. Cr Cr Cr F. li. Cr Cr Trecr (°C) ΔH (J/g) 53 10 - 90 8 86,150,182 0.6,1.5,0.2 20,63 5,12 Tm (°C) ΔH (J/g) 140 46 - ≈134 ** 205 40 ≈205 ** TG (°C) heating TG (°C) cooling - 42-58 25-50 - 72-75 62-72 -
*Solvent-free 1Bu4N. **Tm determined with optical polarizing microscopy.
Tdec: temperature above which decomposition is detected in TGA traces; T95%: 5%
weight loss temperatures; Cr: crystal; F. li.: frozen liquid; Trecr: transition
temperatures between crystalline solid states on first heating; ΔH: enthalpy change associated to transitions; Tm: melting temperature; TG: glass transition
ranges on heating and on cooling (differences between step onset and end). Magnetic properties
Magnetic susceptibility studies of 1. Previous studies have
shown that complexes containing the {CuII
3(μ-Cl)2}4+ core the CuII centres are ferromagnetically coupled.29,30
Magnetic susceptibility studies on pristine complex 1 corroborate this trend; the χMT product of 1 at 300 K is 1.36
non-Journal Name
ARTICLE
interacting S = 1/2 ions (1.12 cm3 mol-1 K, g = 2) and it increases upon cooling, reaching a maximum value of 1.87 cm3 mol-1 K at 18 K, indicative of a S = 3/2 system (Figure 8). It then decreases, reaching 1.10 cm3 mol-1 K at 2 K. This sudden decrease may be attributed to various factors: saturation effects due to Zeeman splitting, intermolecular interactions, or zero-field splitting (zfs) within the ground state.
The complete spin Hamiltonian of the system, including the isotropic interaction, zfs, Zeeman and mean-field correction terms (intermolecular coupling) can be written as:
(1)
In this context, the zfs term traces the origin of the ground state’s zfs to anisotropic exchange and dipolar interactions, since CuII ions (S = 1/2) cannot give rise to single-ion anisotropy. However, since not all tensors in the above Hamiltonian are diagonal within the same reference system, and due to the large number of terms, the derivation of each term is a non-trivial problem, requiring single-crystal data.31 However, at a first approximation the giant-spin approach can be useful in quantifying the ground-state axial anisotropy parameter D, in order to decide upon the most suitable model with which to analyse the magnetic susceptibility data.
X-band EPR spectroscopy at low temperatures is a very useful tool in analyzing the magnetic properties of the ground states of polynuclear systems. As will be shown (see below), the S = 3/2 ground state of 1 exhibits a negligible zfs, which means
that magnetic susceptibility data can be analyzed without that term. Since the anisotropic exchange term induces a zfs in the ground state, this term can be safely excluded from the model. Fits according to this simplified model yielded solution J = J12 =
J23 = J31 = 15.6 cm-1, g = 2.12, zJ = -0.20 cm-1. These results are in agreement with studies of (Bu4N)2[Cu3(μ3-Cl)2(pz)3Cl3], revealing J = 14.3 cm-1 29 and a very small |D3/2| of 0.088 cm -1.30
Figure 8. Magnetic susceptibility data of complexes 1-3 and fits according to the models described in the text.
To test the thermal stability of 1, we also carried out magnetic susceptibility studies on a sample that had previously been molten inside a quartz tube at 140 °C, and then allowed to cool. After correcting for the mass of the sample and the diamagnetic corrections of the quartz tube (using the data of pristine 1 as reference), the χMT vs T and M vs H curves were
practically superimposable, corroborating the thermal stability of 1 (Figure S7).
Magnetic susceptibility studies of 2. Magnetic studies of 2, in
conjunction with microanalytical and IR studies, serve as confirmation of its molecular structure in the absence of structural data. The χMT product of 2 at 300 K is 0.51 cm3 mol-1
K (Figure 8), significantly below the value expected for three non-interacting S = 1/2 ions (1.30 cm3 mol-1 K, g = 2.15) and very close to the expected value for an isolated S = 1/2 spin (0.43 cm3 mol-1 K, g = 2.15). This suggests very strong antiferromagnetic interactions, which stabilize an ST = 1/2 ground state so strongly that the excited state (ST = 3/2) is weakly populated even at 300 K. This conclusion is corroborated by the χMT decrease upon cooling. This decrease
is moderate down to 50 K, but then it becomes more abrupt, leading to a χMT value of 0.28 cm3 mol-1 K at 2 K. This sudden
decrease may be attributed to factors such as saturation effects due to Zeeman splitting, intermolecular interactions, or antisymmetric exchange (AE) interactions.
The presence of a shifted g⊥ resonance in EPR data (see below) in this type of complexes is indicative of the simultaneous presence of a non-equilateral magnetic symmetry and the interplay of AE.32 At a first approximation we consider an isosceles-symmetry spin Hamiltonian (J12 = J13 = J and J23 = J’) with AE contributions. Thus, the complete spin Hamiltonian that may be considered is:
(2)
In this equation, G is the AE vector, assuming Gz >> (Gx, Gy) ~ 0,
while intermolecular interactions are also considered by the last term.
In a preliminary fitting attempt we considered zJ = 0 and J = J’. The fit was of poor quality, yielding J = -189 cm-1, |Gz| = 1.95
cm-1 and g = 2.11 (R = 2.0 × 10⁻³). We therefore considered an isosceles magnetic model (J ≠ J’). In this type of complexes, fits to magnetic susceptibility data through such Hamiltonians yield two best-fit solutions, one with |J| > |J’| (A) and one with |J| < |J’| (B), since in both cases the resulting spin manifolds are arranged in the same manner and are indistinguishable with respect to their magnetic susceptibilities. Fits considering zJ = 0 afforded an improvement, however they were still of inferior quality (R = 4.8-5.0 × 10⁻⁴). It was therefore decided to also consider small intermolecular interactions. Indeed, inclusion of a zJ parameter of the order of -0.3 cm-1 improved the agreement to the data, particularly in the low-T region. Best-fit solutions were J = -298 cm-1, J’ = -257 cm-1, |Gz| = 18.2 cm-1, zJ = -0.37 3 1 2 1 3 2 3 , 1 3 1 ˆ ˆ ˆ ˆ ˆ ˆ ˆ ˆ ˆ 2 ( ) 2 ' ˆ ˆ iso i j i j i i z z i H J J zJ S S
β
= = = − + − + × + + −∑
∑
S S S S S S G S S H g S 3 3 3 , 1 , 1 1 ˆ ˆ ˆ ˆ ˆ ˆ ˆ 2 iso ij i j i ij j i i z z i j i j i H Jβ
zJ S S = = = = −∑
S S +∑
S D S + H∑
g S −cm-1, g = 2.12 (R = 4.9 × 10⁻⁵, A) and J = -271 cm-1, J’ = -315 cm -1, |G
z| = 19.0 cm-1, zJ = -0.38 cm-1, g = 2.12 (R = 5.0 × 10⁻⁵, B). In
both these solutions, Jav (defined as (2J + J’)/3) is -285 cm-1, and all other parameters are practically the same. EPR spectroscopic data allow us to independently evaluate the coherence between the determined values of J, J’ and Gz. In
particular, considering an average geff⊥ of 1.70 (see below), in
the framework of Equation 3 solutions A and B imply g0⊥ ~ 1.82, which falls significantly below the values usually known for square-planar CuII. Attempts to constrain |J – J’| to lower values and/or Gz to higher values, in order to attain more
reasonable g0⊥ values were unsuccessful. As discussed (see below), reasonable values are obtained when we consider geff⊥
~ 1.90, which falls between the weighted average (1.70) and the maximum (2.05) of the fitted distribution.
Magnetic susceptibility studies of 3. The magnetic properties
of 3 are qualitatively similar to those of 2. The χMT product at
300 K is 0.73 cm3 mol-1 K, decreasing steadily upon cooling down to 100 K, and subsequently exhibiting a sharper drop down to 0.061 cm3 mol-1 K at 1.8 K. These similarities suggest the presence of antiferromagnetic interactions, however the higher χMT value at 300 K suggests weaker couplings. EPR data
also suggested the presence of AE interactions (see below), as in the case of 2. The data were accordingly analysed within the framework used to interpret the magnetic behavior of complex 2.
Initial fits considering J = J’ were carried out, using either AE or
zJ to account for the low-T drop in χMT. Using only AE yielded J
= J’ = -75 cm-1 and |Gz| = 27 cm-1, but abnormally low g (1.92)
and poor agreement with the data at low T (R = 6.6 × 10⁻²). Using only zJ yielded a much better fit throughout all temperatures, with J = J’ = -90 cm-1, zJ = -3.4 cm-1 and g = 2.05, but still exhibiting poor agreement with the experimental data (R = 3.1 × 10⁻³). Using both parameters yielded J = J’ = -90 cm-1, |Gz| = 0.015 cm-1, zJ = -7.9 cm-1 and g = 2.09 (R = 7.4 × 10⁻⁴).
This latter result indicates that there are correlations between
zJ and Gz, with intermolecular interactions being arithmetically
favoured during the fitting process.
Taking into account the EPR data (see below), it can be concluded that J ≠ J’, otherwise the g⊥ resonance would be forbidden, and that Gz ≠ 0, otherwise geff⊥ would be equal to
g0⊥, which clearly is not the case. Based on these experimental observations, new fits can be performed including AE and with the constraint J = J’ relaxed. Moreover, based on the crystal structure and the connectivity between the Cu atoms, we can additionally propose the assignment J13 = J23 = J and J12 = J’. As in the previous attempts, considering zJ = 0 yielded very poor results. Including this parameter in our model greatly improved results, yielding best fit solutions: J = -117 cm-1, J’ = -62 cm-1, |Gz| = 40 cm-1, zJ = -7.0 cm-1, g = 2.17 (R = 2.4 × 10⁻⁴,
A) and J = -80 cm-1, J’ = -134 cm-1, |G
z| = 40 cm-1, zJ = -7.0 cm-1,
g = 2.17 (R = 2.4 × 10⁻⁴, B). In both these solutions, J
av ~ -98 cm -1, and all other parameters are practically the same. Following the previous procedure, and considering an average geff⊥ ~
1.47 (see below), in the framework of Equation 3 solutions A
and B imply g0⊥ values of ~1.73, which underestimate usual values for square-planar CuII.
A salient feature of these fits is the important value of zJ, which we correlate to the intermolecular H-bond-mediated interactions between the anions of 3 (see description of the
structure and Figure S3). With z = 2 nearest neighbours the fits allude to interactions of -3.5 cm-1. Such a significant value can explain the fact that 2 K isothermal magnetization data could not be fitted using this model, as the experimental magnetization values were significantly lower than calculated curves; inclusion of mean-field corrections in the calculation of
M requires the consideration of a self-consistent mean field,
which is not possible with Phi, and not further pursued in the context of the present work.
In order to corroborate these zJ values, we approximated the 1D chains of Cu3 complexes by considering closed rings of such complexes. In these calculations we assumed that Cu(1) couples to all three spins of the adjacent molecule through the H-bond Cl(1)···H(10’)-O(1’) by an additional exchange interaction, J’’ (= J11’ = J12’ = J13’). The smallest possible ring of three Cu3 complexes was fitted for its magnetic susceptibility and the best-fit parameters were used to simulate the isothermal magnetization data. Best-fit parameters based on solution A were J = -111 cm-1, J’ = -70 cm-1, J’’ = -5.6 cm-1, |Gz|
= 51 cm-1, g = 2.11 (A’), indicating significant intermolecular interactions; solution A’ exhibits practically the same Jav value as solutions A and B. The simulations to the isothermal magnetisation data were of high quality, greatly improved over models considering mean-field corrections (Figure S6). This is strong evidence that significant intermolecular superexchange interactions are operative. We attribute their strength to the fact that magnetic exchange may occur through the magnetic orbitals of Cu(1) and those of the Cu atoms of an adjacent cluster via the Cl1···H10’’-O10’’ pathway. In addition, when analysed within the context of Equation 3 these parameters imply g0⊥ values of ~2.16, which are much more reasonable for square-planar CuII.
EPR spectroscopic studies of 1. The X-band EPR spectrum of 1
(Figure 9) exhibits a simple axial signal which can be simulated either with an isolated S = 1/2 or with an isolated S = 3/2 spin with a very small D.
Given the results from the magnetic susceptibility studies, which reveal ferromagnetic interactions that stabilize an ST = 3/2 ground state, only the latter case is relevant. Fits to the 4 K spectrum yielded g|| = 2.261, g⊥ = 2.081 and |D| = 1.3⋅10-3 cm -1.
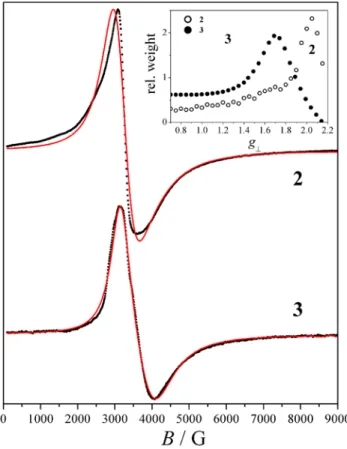
EPR spectroscopic studies of 2 and 3. The X-band spectra of
the complexes (Figure 10) are characterised by broad signals,
consisting of a maximum, which we attribute to the g||
resonance, and a derivative feature with a broad valley, which we attribute to the g⊥ resonance. The positions of these resonances correspond to effective g values of: geff|| = 2.19,
geff⊥ ~ 2.05 (derivative) and 1.85 (valley) for 2; geff|| = 2.15, geff⊥ ~ 1.86 (derivative) and 1.65 (valley) for 3.
Journal Name
ARTICLE
Figure 9. X-band EPR spectrum of 1 at 11 K and fit according to the model described in
the text. Experimental conditions: fEPR = 9.42 GHz, microwave power: 0.5 mW, mod.
amplitude: 1 Gpp. The inset shows the weight distributions of the species with varying
g⊥ parameters.
Figure 10. X-band EPR spectrum of 2 and 3 at 4 K and simulations according to the model described in the text. The inset shows the distributions of the axial species used to reproduce the g⊥ features of the two complexes. Experimental conditions: fEPR = 9.42
GHz, microwave power: 2 mW; , mod. amplitude: 5 Gpp (2), 1 Gpp (3).
In both cases the g⊥ features are significantly broadened with their tails reaching down to g ~ 1. Such axial lineshapes are common in antiferromagnetic half-integer spin triangles; the g-anisotropy is induced by the simultaneous presence of a low magnetic symmetry (J ≠ J’) and antisymmetric exchange (Dzialoshinskii-Moriya) interactions. The positions of the geff||
and geff⊥ signals have been analysed in detail and have been correlated to the single-ion g-tensor elements, g0|| and g0⊥; in particular, it can be shown that geff|| = g0|| and that:
(3)
where hv is the energy of the microwave quantum, δ = 2|J –
J’| (for Si = 1/2 and assuming a -2JijSiSj Hamiltonian formalism),
and Δ = (δ2+3G
z2)1/2.33 Within that framework, the observed g⊥ broadening has been attributed to distributions of the Jij
isotropic interactions (J-strain).34–38
The low-temperature spectra of 2 and 3 (Figure 10) were simulated assuming isolated S = 1/2 spins, i.e. corresponding to significant thermal population only of the ground state Kramers doublet. Within this model the g⊥ broadenings were simulated in a phenomenological manner, assuming distributions of the geff⊥ parameter. Initial attempts assuming
normal distributions were unsuccessful, which was attributed to the possibility that the distributions of the Jij and |Gz|
values, the fundamental origins of geff⊥-strain, are such that
they give rise to non-normal geff⊥ distributions. To account for
this, we considered a series of axial species with geff|| = 2.19
(for 2) and 2.15 (for 3) and with geff|| ≥ geff⊥ ≥ 0.7. Then, the
experimental spectra were fitted to the relative weights of these sub-spectra and distributions were obtained according to a previously described procedure34,39 using custom-made routines written for Easyspin. Both distributions are non-normal, with maxima at g = 2.05 (for 2) and 1.69 (for 3) and weighted averages of 1.70 and 1.47, respectively; we have considered those latter values as representative of geff⊥ for each complex. Considering that CuII ions in an approximately square-planar coordination sphere are characterised by a quasi-axial g-tensor with g0|| ~ 2.15-2.25 and g0⊥ ~ 2.02-2.08,40–43 EPR spectra can help assess the physical meaning of the fits to magnetic susceptibility data. When analysed through this framework, the fits to the magnetic susceptibility data of 2 and 3 implied rather low values for g0⊥ (see above). For complex 2, magnetic susceptibility fits A and B lead to reasonable g0⊥ values when considering g⊥eff = 1.90; this falls between the weighted average (1.70) and the maximum (2.05) of the fitted distribution of the EPR spectrum. We attribute this disagreement to the slight discrepancies of the simulation to the experimental EPR data in the 3-4 kG region, implying that the weighted average of the derived distribution slightly underestimates the average g⊥eff. This could be related to the physical state of the sample, which is not a crystalline monodisperse solid, but an amorphous frozen liquid. As such, its electronic parameters may exhibit larger distributions, from additional structural strains related to this physical state, and which may be harder to model.
For complex 3, the EPR simulation were of higher quality. The underestimation of g⊥0 based on the parameters of solutions A and B was corrected by considering the parameters of solution
A’, where intermolecular interactions were no longer
considered as perturbations, but were approximated in an
2 2 0 2 2 ( ) ( ) eff hv g g hv
δ
⊥ ⊥ − = ∆ −exact manner. This improved coherence between magnetic susceptibility and EPR data further corroborates our results.
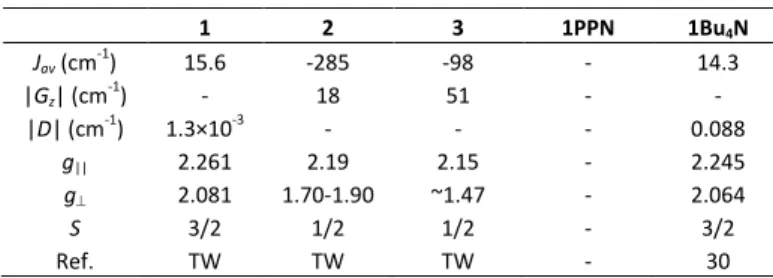
Table 3. Summary of magnetic properties of complexes 1, 2, 3, and 1Bu4N. Energies are
given in cm-1 and the -2J
ijSiSj spin Hamiltonian formalism is used.
1 2 3 1PPN 1Bu4N Jav (cm-1) 15.6 -285 -98 - 14.3 |Gz| (cm-1) - 18 51 - - |D| (cm-1) 1.3×10⁻³ - - - 0.088 g|| 2.261 2.19 2.15 - 2.245 g⊥ 2.081 1.70-1.90 ~1.47 - 2.064 S 3/2 1/2 1/2 - 3/2 Ref. TW TW TW - 30 TW: This work.
Conclusions and perspectives
Complexes 1 and 2 have previously been reported in the form of PPN+ and Bu
4N+ salts and are herein reported as bmim+ salts. Complex 3 consists of a new structural core, reminiscent of the ones found in complexes [Et3NH][Cu3(μ3 -OH)(μ-pz)3Cl3(pzH)]28 and [Cu3(μ3-OH)(μ-pz)3(py)2(μ-Cl)Cl]·py (py = pyridine)44 previously unreported in copper(II) pyrazolate complexes.
Both 1 and 2 are quite similar to their previous analogues with respect to their magnetic properties, however they are remarkably different with respect to their physical form, melting points and thermal properties. This study illustrates that ionic complexes can retain their basic magnetic characteristics, which can be fine-tuned by regular synthetic methods available to coordination chemists, while at the same time their physical form and melting points can be modified by a proper selection of the counterions. In the present case, the selection of bmim, a common cation in ILs caused a decrease in the melting points of those complexes. In the case of 2, this
substitution led to a viscous ionic material that could not be isolated in a crystal form. Presumably, one of the factors that led to this marked difference between 1 and 2 is the different charges of the complex anions: complex 1 is dianionic, whereas 2 is monoanionic, therefore bound to experience weaker electrostatic interactions with the bmim+ cations and, hence, characterized by a lower melting point.
The metallic core of complex 3 is quite similar to that of 2, with the difference that a μ-chloro ligand provides additional bridging. We attribute the quite different magnetic couplings within the two complexes (-285 vs -98 cm-1 average values, respectively) to the action of this bridge in 3, which presumably increases the pyramidality of the μ3-OH- bridge on the opposite side of the Cu3 plane. This should make the overlap of magnetic orbitals between Cu atoms less effective, thereby decreasing the antiferromagnetic component of their superexchange.
The present findings suggest more extensive further studies in this family of complexes along two directions: First, the testing of different countercations and pyrazolate ligands for the preparation of complex salts with potentially even lower melting points, higher thermal stabilities and lower viscosities;
in particular, such studies will be particularly relevant in the
case of complex 2, which showed to be an IL at room
temperature, but of a high viscosity and of limited thermal stability. Second, comparison of complex 1 with known derivatives of the same ferromagnetic anion showed that the use of bmim+ effectively shifted the melting point to lower temperature with respect to more classical cations and that mixtures of salts with different cations are promising to access to ferromagnetic ILs with even lower melting points and broader thermal stability ranges.
Experimental
Syntheses
All reagents and solvents were used as received. Complexes
1PPN and 1Bu4N were prepared according to the literature procedures.28 Indicative IR assignments for 1 were carried out based on bibliographic data for bmim+ cations45,46 and pyrazolato complexes.47
Complex 1. In 10 mL of THF were added 0.511 g CuCl2·2H2O (3.00 mmol), 0.204 g Hpz (3.00 mmol), 0.120 g NaOH (3.00 mmol) and 0.349 g bmimCl (2.00 mmol). The dark green solution was stirred overnight, and turned bright green. The solution was filtered through celite (to remove NaCl as a white solid) and the filtrate was exposed to slow Et2O vapour diffusion in a closed system. A green crystalline solid resulted after three days, was collected by decantation, washed with Et2O and dried under reduced pressure (0.200 g, 24%).
Elemental analysis found C, 34.90; H, 4.54; N., 16.20. Calc. for C25H39Cl5Cu3N10: C, 35.43; H, 4.64; N, 16.53%. Mp 130-140 °C. IR (ATR): νmax/cm-1 3306br, 3148s (vS HC(2)C(3)Hbmim), 3111s & 3090vs (va HC(2)C(3)Hbmim + v C(1)Hbmim), 2959s (va CH3bmim/butyl), 2934s (vFR CH3 bmim/butyl), 2873s (vs CH3 bmim/butyl) , 1570 & 1561 (va ringbmim + v CH2(N)bmim + v CH3(N)bmim + v CN)bmim, 1488m, 1420 & 1376 (v ringpz), 1273 (δs HCHbutyl + δa ringbmim + δ CCCCbutyl), 1175vs & 1165vs (γ ringpz + δ CHpz), 1052vs (δ CHpz), 759vs (γ CHpz), 648w & 629m & 620s (γ ringpz).
Complex 2. In 10 mL of THF were added 0.511 g CuCl2·2H2O (3.00 mmol), 0.204 g Hpz (3.00 mmol), 0.160 g NaOH (4.00 mmol) and 0.175 g bmimCl (1.00 mmol). The dark green solution was stirred overnight, and turned dark blue-green. NaCl was removed by filtration through celite and the filtrate was exposed to slow Et2O vapour diffusion in a closed system. A dark blue oil was obtained after three days. The supernatant solution was decanted, the oil was redissolved in a small amount of THF and allowed to slowly evaporate until a dark blue viscous paste was obtained (0.500 g, 70%). Elemental analysis found C, 31.02; H, 3.91; N, 16.00. Calc. for C17H24Cl3Cu3N8O⋅0.25THF⋅H2O: C, 31,36; H, 4.09; N, 16.25%. IR (ATR): νmax/cm-1 3281br, 3139m, 3108m, 2956m, 2932m, 2872m, 1570m, 1561m, 1487, 1465, 1459, 1428, 1420, 1377s, 1277, 1252, 1177s, 1162s, 1077w, 1049vs, 887m, 835m, 750vs, 649w, 620vs.
Complex 3. In 10 mL of THF were added 0.511 g CuCl2·2H2O (3.00 mmol), 0.204 g Hpz (3.00 mmol), 0.200 g NaOH (5.00 mmol) and 0.349 g bmimCl (2.00 mmol). The dark green
Journal Name
ARTICLE
solution was stirred overnight, and turned dark blue. NaCl was removed by filtration through celite and the filtrate was exposed to slow Et2O vapour diffusion in a closed system. A blue-grey oily solid was obtained after three days. The supernatant solution was decanted, and allowed to slowly evaporate, while the blue-grey material was redissolved in THF and allowed to slowly evaporate. Both solutions yielded crystalline 3 after slow evaporation (0.45 g, 52%). Elemental
analysis found C, 35.16; H, 4.59; N., 17.07. Calc. for C25H40Cl4Cu3N10O: C, 36.22; H, 4.86; N, 16.89%. IR (ATR): νmax/cm-1 3309br, 3145s, 3115s, 3076s, 2959s, 3021s, 2958s, 2933s, 2873s, 1567s, 1488m, 1423m, 1376s, 1277s, 1176vs, 1168vs, 1050vs, 753vs, 644w, 627s, 618s.
X-ray crystallography
X-ray diffraction data for 1 and 3 were collected from single crystals mounted atop glass fibers using graphite monochromated Mo-Ka radiation (λ = 0.71073 Å) on a Bruker D8 QUEST diffractometer equipped with a CMOS detector. The structures were solved by intrinsic phasing methods available with SHELXT, and data were refined by full-matrix least-squares using SHELXS and SHELXL program packages48 supplied within the APEX3 suite and ShleXle.49 Multi-scan absorption correction was performed using SADABS.50 Relevant details are shown in Table 4. X-ray diffraction data for 2 were collected on a Bruker D8 diffractometer using monochromatic Cu-Ka radiation with a scanning range between 4 and 70° and a scan rate of 2°min-1.
Physical measurements
IR spectra were collected from the pure powders on a Bruker Alpha FTIR spectrometer and on a Perkin-Elmer Spectrum 100 FT-IR spectrometer using the Attenuated Total Reflectance (ATR) accessory. The elemental analyses (C, H, N) were performed at Galbraith Laboratories, Inc., Knoxville, Tennessee and at the Service d’analyses, de mesures physiques et de spectroscopie optique of the University of Strasbourg. Melting points were determined on a Start SMP10 digital melting point apparatus. SQUID data were collected on a Quantum Design MPMS3 magnetometer. Magnetization measurements at different fields at a given temperature confirmed the absence of ferromagnetic impurities. Data were corrected for the sample holder and TIP contributions, and diamagnetism was estimated by using Pascal constants. The magnetic susceptibilities were computed by exact calculation of the energy levels associated with the spin Hamiltonian through diagonalisation of the full matrix using Phi 2.1.6.51The error-factor R is defined as:
where N is the number of experimental points. TGA studies were performed using a TA instrument SDTQ 600 (heating rates of 5 °Cmin-1 under air stream, using Pt crucibles), and DSC studies under a nitrogen stream were carried on a DSC Q1000 apparatus from TA Instruments. EPR spectra were recorded on a Bruker ESP300 spectrometer using a Bruker 4102ST rectangular cavity operating in the TE102 mode. For
variable-temperature experiments the cavity was fitted in an ESR900 dynamic continuous flow cryostat and the temperature was regulated with an Oxford ITC4 servocontrol controlled by the Oxford Objectbench software application. To properly load a sample of complex 2 without risk of contamination of the EPR cryostat, a quantity of the viscous paste was pushed into a quartz capillary (Figure S8), which was then loaded into a regular EPR tube.
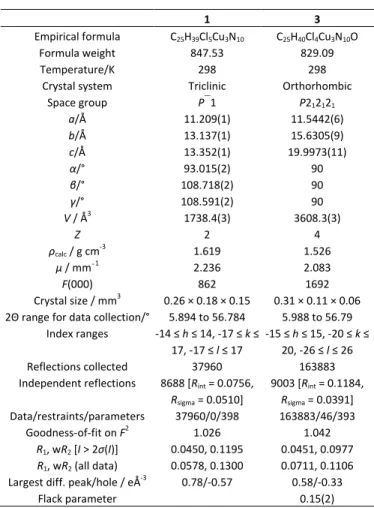
Table 4. Data collection and refinement details for complexes 1 and 3.
1 3
Empirical formula C25H39Cl5Cu3N10 C25H40Cl4Cu3N10O
Formula weight 847.53 829.09
Temperature/K 298 298
Crystal system Triclinic Orthorhombic Space group P1 P212121 a/Å 11.209(1) 11.5442(6) b/Å 13.137(1) 15.6305(9) c/Å 13.352(1) 19.9973(11) α/° 93.015(2) 90 β/° 108.718(2) 90 γ/° 108.591(2) 90 V / Å3 1738.4(3) 3608.3(3) Z 2 4 ρcalc / g cm-3 1.619 1.526 μ / mm‑1 2.236 2.083 F(000) 862 1692 Crystal size / mm3 0.26 × 0.18 × 0.15 0.31 × 0.11 × 0.06
2Θ range for data collection/° 5.894 to 56.784 5.988 to 56.79 Index ranges -14 ≤ h ≤ 14, -17 ≤ k ≤
17, -17 ≤ l ≤ 17
-15 ≤ h ≤ 15, -20 ≤ k ≤ 20, -26 ≤ l ≤ 26 Reflections collected 37960 163883 Independent reflections 8688 [Rint = 0.0756,
Rsigma = 0.0510] 9003 [Rint = 0.1184, Rsigma = 0.0391] Data/restraints/parameters 37960/0/398 163883/46/393 Goodness-of-fit on F2 1.026 1.042 R1, wR2 [I > 2σ(I)] 0.0450, 0.1195 0.0451, 0.0977 R1, wR2 (all data) 0.0578, 0.1300 0.0711, 0.1106
Largest diff. peak/hole / eÅ-3 0.78/-0.57 0.58/-0.33
Flack parameter 0.15(2)
aw = 1/[σ2(F
02) + (aP)2 + bP], where P = (F02 + 2Fc2)/3, and (a, b) = (0.0694, 1.0569)
for 1 and (0.0442, 2.8327) for 3.
Conflicts of interest
There are no conflicts of interest to declare.
Acknowledgements
We thank Dr. Logesh Mathivatanan (FIU) for helpful discussions on the preparations of the complexes, Dr Nathalie Gruber (Université de Strasbourg) for the collection of XRD data of complex 2 and Dr. Éric Rivière (ICMMO, Orsay) for the collection of SQUID data of complex 3. This project has received funding from the European Union’s Horizon 2020 research and innovation programme under the Marie Sklodowska-Curie grant agreement No 746060. Work at FIU was partially supported by the National Science Foundation (CHE-1213683). 2 exp 2 exp ( T Tcalc) R N T
χ
χ
χ
− = ⋅∑
Notes and references
1 T. Torimoto, T. Tsuda, K. Okazaki and S. Kuwabata, Adv. Mater., 2010, 22, 1196–1221.
2 N. V. Plechkova and K. R. Seddon, Chem Soc Rev, 2008, 37, 123– 150.
3 M. S. Sitze, E. R. Schreiter, E. V. Patterson and R. G. Freeman,
Inorg. Chem., 2001, 40, 2298–2304.
4 S. Hayashi and H. Hamaguchi, Chem. Lett., 2004, 33, 1590–1591. 5 S. Hayashi, S. Saha and H. Hamaguchi, IEEE Trans. Magn., 2006,
42, 12–14.
6 B. Mallick, B. Balke, C. Felser and A.-V. Mudring, Angew. Chem.
Int. Ed., 2008, 47, 7635–7638.
7 E. H. Walker, M. L. Breen and A. W. Apblett, Chem. Mater., 1998,
10, 1265–1269.
8 P. Nockemann, B. Thijs, N. Postelmans, K. Van Hecke, L. Van Meervelt and K. Binnemans, J. Am. Chem. Soc., 2006, 128, 13658– 13659.
9 D. Wang, H. Wang and H. Li, ACS Appl. Mater. Interfaces, 2013, 5, 6268–6275.
10 Y. Funasako, T. Mochida, T. Inagaki, T. Sakurai, H. Ohta, K. Furukawa and T. Nakamura, Chem. Commun., 2011, 47, 4475. 11 M. Okuhata, Y. Funasako, K. Takahashi and T. Mochida, Chem.
Commun., 2013, 49, 7662.
12 D. Prodius, F. Macaev, Y. Lan, G. Novitchi, S. Pogrebnoi, E. Stingaci, V. Mereacre, C. E. Anson and A. K. Powell, Chem.
Commun., 2013, 49, 9215.
13 Y. Funasako, T. Mochida, K. Takahashi, T. Sakurai and H. Ohta,
Chem. - Eur. J., 2012, 18, 11929–11936.
14 H. D. Pratt III, A. J. Rose, C. L. Staiger, D. Ingersoll and T. M. Anderson, Dalton Trans., 2011, 40, 11396.
15 Y. Funasako, T. Inagaki, T. Mochida, T. Sakurai, H. Ohta, K. Furukawa and T. Nakamura, Dalton Trans., 2013, 42, 8317. 16 Y. Funasako, M. Nosho and T. Mochida, Dalton Trans., 2013, 42,
10138.
17 A. Branco, L. C. Branco and F. Pina, Chem Commun, 2011, 47, 2300–2302.
18 P. Zhang, Y. Gong, Y. Lv, Y. Guo, Y. Wang, C. Wang and H. Li,
Chem. Commun., 2012, 48, 2334.
19 R. E. Del Sesto, T. M. McCleskey, A. K. Burrell, G. A. Baker, J. D. Thompson, B. L. Scott, J. S. Wilkes and P. Williams, Chem
Commun, 2008, 447–449.
20 T. Peppel and M. Köckerling, Cryst. Growth Des., 2011, 11, 5461–5468.
21 S. J. Osborne, S. Wellens, C. Ward, S. Felton, R. M. Bowman, K. Binnemans, M. Swadźba-Kwaśny, H. Q. N. Gunaratne and P. Nockemann, Dalton Trans, 2015, 44, 11286–11289.
22 T. Peppel, P. Thiele, M.-B. Tang, J.-T. Zhao and M. Köckerling,
Inorg. Chem., 2015, 54, 982–988.
23 Y. Yoshida, H. Tanaka, G. Saito, L. Ouahab, H. Yoshida and N. Sato, Inorg. Chem., 2009, 48, 9989–9991.
24 S. A. Kozlova, S. P. Verevkin, A. Heintz, T. Peppel and M. Köckerling, J. Chem. Eng. Data, 2009, 54, 1524–1528.
25 T. Peppel, P. Thiele and M. Köckerling, Russ. J. Coord. Chem., 2012, 38, 207–218.
26 D. Prodius, F. Macaev, E. Stingaci, V. Pogrebnoi, V. Mereacre, G. Novitchi, G. E. Kostakis, C. E. Anson and A. K. Powell, Chem.
Commun., 2013, 49, 1915.
27 O. Nacham, K. D. Clark, H. Yu and J. L. Anderson, Chem. Mater., 2015, 27, 923–931.
28 P. A. Angaridis, P. Baran, R. Boča, F. Cervantes-Lee, W. Haase, G. Mezei, R. G. Raptis and R. Werner, Inorg. Chem., 2002, 41, 2219– 2228.
29 R. Boča, L. Dlháň, G. Mezei, T. Ortiz-Pérez, R. G. Raptis and J. Telser, Inorg. Chem., 2003, 42, 5801–5803.
30 Y. Sanakis, M. Pissas, J. Krzystek, J. Telser and R. G. Raptis,
Chem. Phys. Lett., 2010, 493, 185–190.
31 A. Ozarowski, C. J. Calzado, R. P. Sharma, S. Kumar, J. Jezierska, C. Angeli, F. Spizzo and V. Ferretti, Inorg. Chem., 2015, 54, 11916– 11934.
32 A. N. Georgopoulou, I. Margiolaki, V. Psycharis and A. K. Boudalis, Inorg. Chem., , DOI:10.1021/acs.inorgchem.6b01912. 33 Y. V. Rakitin, Y. V. Yablokov and V. V. Zelentsov, J. Magn. Reson.
1969, 1981, 43, 288–301.
34 V. Psycharis, C. P. Raptopoulou, A. K. Boudalis, Y. Sanakis, M. Fardis, G. Diamantopoulos and G. Papavassiliou, Eur. J. Inorg.
Chem., 2006, 2006, 3710–3723.
35 Y. Sanakis, A. K. Boudalis and J.-P. Tuchagues, Comptes Rendus
Chim., 2007, 10, 116–124.
36 T. C. Stamatatos, J. C. Vlahopoulou, Y. Sanakis, C. P. Raptopoulou, V. Psycharis, A. K. Boudalis and S. P. Perlepes, Inorg.
Chem. Commun., 2006, 9, 814–818.
37 Y. Sanakis, A. L. Macedo, I. Moura, J. J. G. Moura, V. Papaefthymiou and E. Münck, J. Am. Chem. Soc., 2000, 122, 11855–11863.
38 A. K. Boudalis, Y. Sanakis, C. P. Raptopoulou, A. Terzis, J.-P. Tuchagues and S. P. Perlepes, Polyhedron, 2005, 24, 1540–1548. 39 A. K. Boudalis, Y. Sanakis, F. Dahan, M. Hendrich and J.-P.
Tuchagues, Inorg. Chem., 2006, 45, 443–453.
40 G. J. A. A. Koolhaas, W. L. Driessen, J. Reedijk, J. L. van der Plas, R. A. G. de Graaff, D. Gatteschi, H. Kooijman and A. L. Spek, Inorg.
Chem., 1996, 35, 1509–1517.
41 P. S. Subramanian, E. Suresh and D. Srinivas, Inorg. Chem., 2000,
39, 2053–2060.
42 B. Bräuer, F. Weigend, M. Fittipaldi, D. Gatteschi, E. J. Reijerse, A. Guerri, S. Ciattini, G. Salvan and T. Ru?ffer, Inorg. Chem., 2008,
47, 6633–6644.
43 Y. P. Singh, R. N. Patel, Y. Singh, D. Choquesillo-Lazarte and R. J. Butcher, Dalton Trans, 2017, 46, 2803–2820.
44 M. Angaroni, G. A. Ardizzoia, T. Beringhelli, G. La Monica, D. Gatteschi, N. Masciocchi and M. Moret, J Chem Soc Dalton Trans, 1990, 3305–3309.
45 Y. Jeon, J. Sung, C. Seo, H. Lim, H. Cheong, M. Kang, B. Moon, Y. Ouchi and D. Kim, J. Phys. Chem. B, 2008, 112, 4735–4740. 46 N. E. Heimer, R. E. Del Sesto, Z. Meng, J. S. Wilkes and W. R.
Carper, J. Mol. Liq., 2006, 124, 84–95.
47 J. G. Vos and W. L. Groeneveld, Inorganica Chim. Acta, 1978, 27, 173–180.
48 G. M. Sheldrick, Acta Crystallogr. Sect. C Struct. Chem., 2015, 71, 3–8.
49 C. B. Hübschle, G. M. Sheldrick and B. Dittrich, J. Appl.
Crystallogr., 2011, 44, 1281–1284.
50 L. Krause, R. Herbst-Irmer, G. M. Sheldrick and D. Stalke, J. Appl.
Crystallogr., 2015, 48, 3–10.
51 N. F. Chilton, R. P. Anderson, L. D. Turner, A. Soncini and K. S. Murray, J. Comput. Chem., 2013, 34, 1164–1175.