HAL Id: hal-00317092
https://hal.archives-ouvertes.fr/hal-00317092
Submitted on 1 Jan 2002
HAL is a multi-disciplinary open access
archive for the deposit and dissemination of
sci-entific research documents, whether they are
pub-lished or not. The documents may come from
teaching and research institutions in France or
abroad, or from public or private research centers.
L’archive ouverte pluridisciplinaire HAL, est
destinée au dépôt et à la diffusion de documents
scientifiques de niveau recherche, publiés ou non,
émanant des établissements d’enseignement et de
recherche français ou étrangers, des laboratoires
publics ou privés.
Case studies of space weather events from their
launching on the Sun to their impacts on power systems
on the Earth
H.-L. Lam, D. H. Boteler, L. Trichtchenko
To cite this version:
H.-L. Lam, D. H. Boteler, L. Trichtchenko. Case studies of space weather events from their
launch-ing on the Sun to their impacts on power systems on the Earth. Annales Geophysicae, European
Geosciences Union, 2002, 20 (7), pp.1073-1079. �hal-00317092�
Annales
Geophysicae
Case studies of space weather events from their launching on the
Sun to their impacts on power systems on the Earth
H.-L. Lam, D. H. Boteler, and L. Trichtchenko
Geomagnetic Laboratory, Geological Survey of Canada, Natural Resources Canada, 7 Observatory Crescent, Ottawa, Ontario, K1A 0Y3, Canada
Received: 21 February 2002 – Revised: 3 June 2002 – Accepted: 5 June 2002
Abstract. Active geomagnetic conditions on 12–13, 15–
16, and 22–23 September 1999 resulted in geomagnetically induced currents (GIC) measurable in power systems in Canada and the United States. Different solar origins for these three events gave rise to dissimilar interplanetary signa-tures. We used these events to present three case studies, each tracing an entire space weather episode from its inception on the Sun, propagation through the interplanetary medium, manifestation on the ground as intense magnetic and electric fluctuations, and its eventual impact on technological sys-tems.
Key words. Geomagnetism and paleomagnetism (rapid
time variations) – Interplanetary physics (interplanetary magnetic fields) – Solar physics, astrophysics, and astron-omy (flares and mass ejections)
1 Introduction
A space weather event has its initiation on the Sun. A coronal mass ejection (CME) associated with a solar flare or disap-pearing filament (Webb and Hundhausen, 1987) often starts the chain of events. At other times, a high-speed solar wind stream emanating from a coronal hole (Krieger et al., 1973) is the culprit. The propagation of the solar wind in the in-terplanetary medium carries the signature of the CME ejecta (Gosling, 1990) or the coronal hole stream (Sheeley et al., 1976). Upon interacting with the Earth’s magnetosphere, solar wind disturbances with large southward interplanetary magnetic fields allow interconnection with the northward magnetospheric fields (Dungey, 1961), thus coupling energy into the magnetosphere and eventually resulting in geomag-netic disturbances observed on the surface of the Earth. De-pending on the sizes of the geomagnetic disturbances which induce electric fields that drive currents, measurable geomag-netically induced currents (GIC) in conductors at the Earth’s surface could result (Lanzerotti and Gregori, 1986).
Techno-Correspondence to: H.-L. Lam (hlam@nrcan.gc.ca)
logical systems using long conductors such as power grids are vulnerable to the GIC (Boteler et al., 1998).
Geomagnetic disturbances, which occurred during 12–13, 15–16, and 22–23 September 1999, resulted in measurable GIC in power systems in Canada and the United States. This paper presents case studies of these three events, tracing each from its solar origin and propagation through the interplane-tary medium, to the measured magnetic and calculated elec-tric fluctuations on the ground, and its eventual impact on the power systems. These events were chosen not because of any damage done to the power grids (there was none) nor because of the size of the geomagnetic disturbance (only the geomag-netic disturbance during 22–23 September could be consid-ered as severe). They were selected because of the availabil-ity of the solar data, solar wind data, ground magnetic data, and GIC related data, thus allowing an entire event from its inception to its final impact to be tracked. We were able to do this for three different scenarios. To our knowledge, these are the first case studies documenting space weather events from their initiations on the Sun, agitations in solar wind, pertur-bations in ground magnetic, as well as electric fields, and to their final impacts on power systems on the Earth.
2 Data
Data obtained from satellites and from ground stations were
used in the case studies. The solar origins of the space
weather events were discerned from sources that include Solar-Geophysical Data Prompt Reports and Comprehensive Reports (published by NOAA National Geophysical Data Center, Boulder), daily Reports of Solar-Geophysical Ac-tivity (issued by NOAA Space Environment Center, Boul-der), Coronal Hole Maps (produced by Kitt Peak National Solar Observatory), solar images captured by the Yohkoh and SOHO (Solar Heliospheric Observatory) satellites, and the SOHO LASCO CME Catalog. The interplanetary sig-natures of the space weather events were gleaned from the solar wind measurements at ACE (Advanced Composition
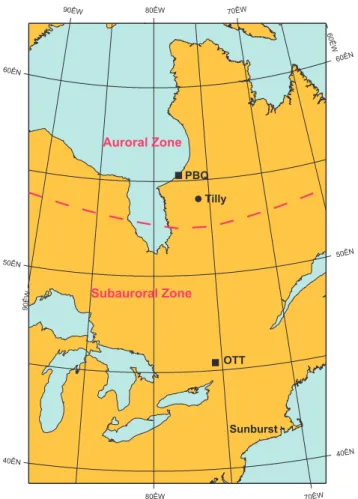
1074 H.-L. Lam et al.: Case studies of space weather events 90ÊW 90ÊW 80ÊW 80ÊW 70ÊW 70ÊW 60ÊW 40ÊN 40ÊN 50ÊN 50ÊN 60ÊN 60ÊN Auroral Zone Subauroral Zone Tilly Sunburst OTT PBQ
Fig. 1. Locations of ground stations used in this study. PBQ
(Poste-de-la-Baleine) and OTT (Ottawa) are magnetic observatories op-erated by the GSC (Geological Survey of Canada). Tilly power substation is operated by Hydro Qu´ebec, and the GIC recording is part of the Sunburst project sponsored by EPRI (Electric Power Re-search Institute).
Explorer) satellite. The ACE data utilized in this study con-sist of 16-s averages of interplanetary magnetic field data in GSM (Geocentric Solar Magnetospheric) coordinates, and 64-s averages of ion density, speed and temperature data. Since ACE is in orbit about the L1 libration point between the Earth and the Sun (which is approximately 1.5 million km from the Earth), the solar wind conditions as measured at the ACE location would take about 45 min to propagate to the Earth.
Ground magnetic data consist of 5-s data recorded at
mag-netic observatories in PBQ (Poste-de-la-Baleine at 55.3◦N,
77.8◦W) and OTT (Ottawa at 45.4◦N, 75.6◦W), which are
operated by the Geological Survey of Canada. The magnetic data from OTT and PBQ were also used with a layered con-ductivity model of the Earth (Ferguson and Odwar, 1997) to calculate the electric fields at the Earth’s surface in those re-gions. The effect of geomagnetic disturbances on power sys-tems can be studied by measuring GIC directly or by mea-suring the AC harmonics resulting from transformer satura-tion due to GIC. For this study we used GIC data recorded in the neutral-ground connection of a transformer at a
sub-station in New York state. At the time of the events studied, the recording system only saved GIC values that exceeded a threshold of 10 A. This GIC monitor is part of the EPRI-sponsored Sunburst project (Lesher et al., 1994). We also
used AC harmonic data recorded at Tilly substation (54◦N,
76◦W) on the Hydro-Qu´ebec system. Figure 1 shows the
lo-cations of the ground stations and their positions relative to the auroral zone and subauroral zone. During quiet times,
the cusp region is located between 75◦–80◦geomagnetic
lat-itude. As activities increase, it shifts equatorward, reaching
70◦for Kpof 7 (see Fig. 9.22 in Akasofu, 1977). Thus,
lo-cated at a geomagnetic latitude of 66.8◦, the magnetic
obser-vatory at PBQ would, except during severely disturbed times, generally be inside the auroral oval where the auroral elec-trojet flows. The recording sites used are all in the Eastern Standard Time (EST) zone, which is UT – 5 h. UT is used throughout this paper.
3 A geomagnetic synopsis
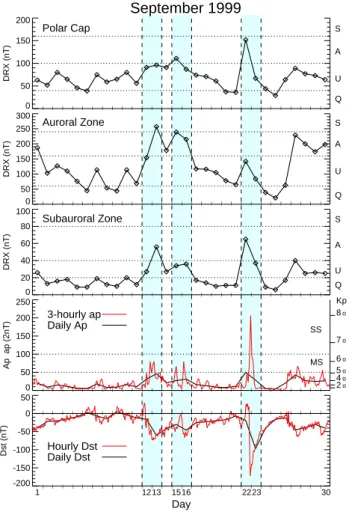
Figure 2 is a synopsis of the geomagnetic activity for the month of September 1999, with the three periods chosen for
this study indicated in shading. Dst and Ap (together with
apand Kp), which are plotted in the two bottom panels, give
a global measure of the geomagnetic activity. Although Dst,
ap, Apand Kpare widely used as indicators of geomagnetic
disturbances, these indices are biased towards the equatorial and mid-latitude regions. Thus, the DRX plots in the three top panels are used to present a more localized picture of ge-omagnetic conditions in the polar cap, auroral zone and sub-auroral zone in Canada. DRX indices are the daily means of the hourly ranges in the x (northward) component of the
geo-magnetic field measured at Resolute Bay (74.7◦N, 94.9◦W)
in the polar cap, Fort Churchill (58.8◦N, 94.1◦W) in the
au-roral zone, and Ottawa (45.4◦N, 75.6◦W) in the subauroral
zone. The Geological Survey of Canada has been producing and disseminating the three-zone forecast and review of geo-magnetic activity in terms of DRX as part of its geogeo-magnetic forecast service since 1986 (Lam, 1997). Figure 2 can be viewed as a plot showing geomagnetic variations from high latitudes to low latitudes.
The daily Ap values, the largest three-hourly ap values,
the corresponding Kpvalues, and the largest hourly Dst
val-ues for each of the six days of interest are shown in Ta-ble 1. According to these global indices, intense activity prevailed only on 22 September. However, from Fig. 2 the localized DRX, which is more useful in delineating geomag-netic conditions pertinent to Canada and the northern US, shows stormy conditions in the auroral zone on 13 and 15 September, in addition to displaying active conditions in the subauroral zone on 22 September, the day of the most in-tense activity indicated by the global indices. This is one of the prime reasons for choosing the specific days for the study. Occurrences of disturbed geomagnetic conditions would en-sure measurable GIC events in the power systems located in these zones (Fig. 1) during the three time periods. It is of
in-Table 1. Geomagnetic indices for the events
12 Sep 13 Sep 15 Sep 16 Sep 22 Sep 23 Sep
Ap 31 46 27 31 50 28
Max ap 80 80 67 80 207 94
(18:00–21:00 UT) (03:00–06:00 UT) (09:00–12:00 UT) (03:00–06:00 UT) (21:00–24:00 UT) (00:00–03:00 UT)
Kp 6◦ 6◦ 6– 6◦ 8◦ 6+
Max Dst –59 –74 –51 –67 –173 –155
(20:00–21:00 UT) (04:00–05:00 UT) (09:00–10:00 UT) (08:00–09:00 UT) (23:00–24:00,UT) (00:00–01:00 UT)
-200 -150 -100 -50 0 50 Dst (nT) Hourly DstDaily Dst | | | | | | | | | | | | | | | | | | | | | | | | | | | | | | | | | | | | | | | | | | | | | | | | | | | | | | | | | | 1 1213 1516 2223 30 Day 0 50 100 150 200 DRX (nT) | | | | | | | | | | | | | | | | | | | | | | | | | | | | | Polar Cap S A U Q 0 50 100 150 200 250 300 DRX (nT) | | | | | | | | | | | | | | | | | | | | | | | | | | | | | Auroral Zone S A U Q 0 20 40 60 80 100 DRX (nT) | | | | | | | | | | | | | | | | | | | | | | | | | | | | | Subauroral Zone S A U Q 0 50 100 150 200 250 Ap ap (2nT) 3-hourly ap Daily Ap | | | | | | | | | | | | | | | | | | | | | | | | | | | | | 2o 4o 5o 6o 7o 8o Kp MS SS September 1999
Fig. 2. Review of geomagnetic activity for September 1999. Plotted
are the daily means of the hourly ranges of the x-component of the geomagnetic field (DRX) for the polar cap (Resolute Bay, 74.7◦ N, 94.9◦W), auroral zone (Fort Churchill, 58.8◦N, 94.1◦W), and subauroral zone (Ottawa, 45.4◦N, 75.6◦W) in Canada, as well as the global magnetic indices of ap, Ap, Kpand Dst. Since ap and Kp are equivalent, the Kp values can be read directly off the Kp
scale using the ap trace. The three time periods chosen for the case studies are shaded in blue. Q, U, A and S in the DRX plots refer to quiet, unsettled, active and stormy conditions, respectively. MS and SS next to the Kpscale stand for major storm and severe storm,
respectively.
terest to note that the parameters plotted for 22–23 Septem-ber show a shift of geomagnetic activity from high latitude to low latitude as the auroral oval expanded southward in re-sponse to increased energy input from the solar wind.
4 The event of 12–13 September 1999
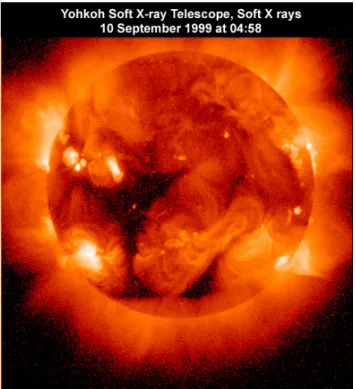
There were no significant solar eruptions associated with this event except for a much earlier M1.4/1B flare that oc-curred on 8 September between 12:08–12:77 UT from a non-geoeffective location of N 12 E 53. However, the Yohkoh SXT (Soft X-ray Telescope) image (Fig. 3) shows a large trans-equatorial coronal hole near the central meridian on 10 September at 04:58 UT. Thus, the solar source for the 12–13 September event is likely to be this coronal hole, which pro-duced a high-speed solar wind stream that eventually caused a geomagnetic disturbance a few days later. Figure 4 is a stack plot of the ACE solar wind parameters (upper panel) and the ground observations (lower panel) for the 12–13 September event. It shows a broad increase in solar wind speed, decrease in density, increase in temperature, and vary-ing interplanetary magnetic fields, especially in the vertical
component Bz, whose fluctuations are a signature of Alfv´en
waves in the high-speed flow (Tsurutani et al., 1995). These solar wind measurements are indicative of the coronal hole as the possible solar source for this event. The occurrence of the geomagnetic disturbance on 13 September is consistent with the lag-time for geomagnetic activity induced by the coro-nal hole in Lam and Samson (1994), and the observed solar wind speed of about 570 km/s on 13 September matches the approximate three day transit-time.
From about 15:00 UT onwards, Bzwas in a predominantly
negative (southward) direction, resulting in an increase in the global measures of geomagnetic activity such as ap. For the early part of this event, North America was on the dayside of the Earth. From 18:00 to 00:00 UT (13:00 to 19:00 EST), PBQ saw an increase in x, the signature of an increased east-ward electrojet which is indicative of enhanced convection resulting from the solar wind – magnetosphere interaction. As North America rotated around to the night side, it came under the influence of a westward electrojet, as seen by the change at 01:00 UT (20:00 EST) to negative excursions of x at PBQ and OTT. The magnetic variations at PBQ were
con-1076 H.-L. Lam et al.: Case studies of space weather events
Fig. 3. Yohkoh soft X-ray image showing a large trans-equatorial
coronal hole near the central meridian on 10 September 1999 at 04:58 UT.
siderably larger than those at OTT (note the different scales in Fig. 4), indicating that the electrojets, although enhanced in amplitude, were remaining in their typical auroral zone location.
Electric fields produced by this disturbance reached 600 mV/km and more at PBQ. This particular value occurred around 01:00 UT (20:00 EST), and was accompanied by a noticeable increase in the power system harmonic levels recorded at Tilly. A second peak (400 mV/km) in the elec-tric field around 03:30 UT (22:30 EST) also produced a sim-ilar increase in power system harmonics. At these times the electric field at OTT also experienced large fluctuations, al-though the amplitude were smaller than those at PBQ. Peak values of GIC just above the 10 A recording threshold were also seen at the Sunburst site at these times.
5 The event of 15–16 September 1999
Several solar events occurred on 13 September. A partial
halo CME with an 182◦ angular width and a plane of sky
speed of 898 km/s billowed away from the Sun at 09:30 UT. It may be associated with a long duration C4.9/SF flare that occurred between 08:05–09:32 UT from an active area cen-tered at N 22 E 10. Later, at 17:31 UT another partial halo
CME with an 184◦angular width and a slower plane of sky
speed of 444 km/s left the Sun. It may be associated with a C2.6/1N flare that occurred between 16:30–17:04 UT from an active area centered at N 15 E 06. In addition to these so-lar eruptions, the Kitt Peak Coronal Hole Maps (based on
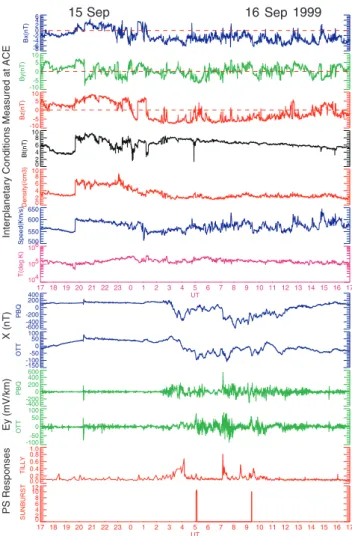
Fig. 4. A stack plot of ACE solar wind data (upper panel) and
ground data (lower panel) for 12–13 September 1999. The upper panel shows the three components of the interplanetary magnetic field in GSM (Geocentric Solar Magnetospheric) coordinate system (Bx, By, and Bz), total interplanetary field strength (Bt), proton
density, solar wind speed and temperature. The lower panel shows the northward component of the geomagnetic field (x) as recorded at the GSC’s magnetic observatories located in PBQ and OTT, and the eastward component of the electric field (Ey) as calculated from x. “PS Responses” stands for Power System Responses and refers to the AC harmonics in percentage measured by Hydro Qu´ebec at the substation Tilly, and the geomagnetically induced current (GIC) in Amperes recorded at the Sunburst site.
He I 1083 nm) showed two small coronal holes located near the equator in the Northern Hemisphere passing the central meridian on 13 and 14 September. Thus, the coronal holes and the partial halo CMEs were possible solar causes for the 15–16 September space weather event.
The ACE solar wind data shown in the stack plot of Fig. 5 show the passage of an interplanetary shock with abrupt in-crease in speed, density and interplanetary magnetic field strength around 19:30 UT on 15 September. The solar wind measurements after the shock passage appear to bear some characteristics of magnetic cloud, which is a region of en-hanced magnetic fields, within which the ion temperature
is low and the field directions rotate slowly (Burlaga et al., 1981). The partial halo CMEs might have delivered glancing blows to the magnetosphere. After 01:00 UT on 16 Septem-ber, the broad increase in high solar wind speed, low density
and variable Alfv´en wave signature in Bz show
characteris-tics of coronal hole streams, and the speed range of 550– 600 km/s suggests a three-day transit-time of the solar wind stream, implying that the coronal hole crossing the central meridian on 13 September may be the possible solar source. The solar wind speed of 600 km/s after the shock passage seems high when compared with the plane of sky speed of 444 km/s at the onset of the slow CME. It is, therefore, tempt-ing to attribute the shock to the fast CME with a speed of 898 km/s. However, an earlier shock at 07:10 UT (not shown) on 15 September may already be due to this fast CME. It is difficult to relate a single structure in the solar wind to a fea-ture of the solar disk without a detailed analysis. During the transit, the CMEs might undergo acceleration or decelera-tion, or the two might merge, and there was a presence of solar wind streams from the two coronal holes. Thus, the shock might be the manifestation of the interactions between two or more streams, and the subsequent global state of fluc-tuating disturbed solar wind conditions would cause an agi-tated interplanetary medium to elicit conditions at Earth for the GICs.
Both PBQ and OTT recorded a sudden impulse around 20:15 UT due to the shock’s impact at the magnetopause, about 45 min after its passage through the ACE satellite at the L1 point. After the sudden impulse, the magnetic field at PBQ and OTT remained quiet until 01:00 UT, while the
IMF Bzwas northwards. From 03:00 UT to 12:00 UT on 16
September, the sustained southward Bzresulted in high
mag-netic activity recorded at PBQ and OTT. At both stations, the variations in x were negative due to the westward electrojet occurring in the local midnight and dawn sectors. The mag-netic variations at PBQ were greater than those at OTT, in-dicating that the westward electrojet was located in a typical auroral zone location.
A spike in the electric field accompanied the sudden im-pulse in the magnetic field at PBQ and OTT. However, this was not accompanied by any noticeable effects in the power system recordings. The first power system effects occurred around 04:00 UT (23:00 EST), when the magnetic variations at PBQ produced an electric field of 200 mV/km and an in-crease in power system harmonics at Tilly. The largest elec-tric field at PBQ was nearly 600 mV/km and occurred around 07:00 UT (02:00 EST) and produced the peak increase in har-monics at Tilly. At OTT there was a different pattern of ac-tivity with a period of electric field fluctuations from 05:00 to 10:00 UT (00:00 to 05:00 EST) reaching a peak amplitude of 100 mV/km. This would be expected to produce some GIC at the Sunburst site, but the GIC exceeded the recording threshold only in two brief intervals shortly after 05:00 UT and 09:20 UT.
Fig. 5. Same as Fig. 4 except for the 15–16 September event.
6 The event of 22–23 September 1999
The SOHO LASCO (Large Angle Spectrometric Corona-graph) C2 running difference image of Fig. 6 shows a full
halo CME (with a reported 360◦angular width) coming out
of the Sun on 20 September at 06:30 UT with a plane of sky speed of 604 km/s. (The LASCO instrument is a suite of three coronagraphs, called C1, C2 and C3, which view
the corona from 1.1–30 RS. The figure shows a running
difference image from the externally occulted C2 telescope
with the field of view of 2–6 RS.) The CME, launched at
06:06 UT, may be associated with the disappearance of a 16◦
filament (S 20 E 14) on 20 September. There were also four filaments that disappeared on 19 September, with the largest
one being a 19◦filament located at N 36 E 38.
The stack plot of Fig. 7 shows the arrival of a shock at ACE around 11:45 UT on 22 September with abrupt increases in solar wind speed, density and interplanetary magnetic field strength. The fluctuating solar wind quantities after the shock probably suggest the presence of a shock sheath (∼ 11:45– 19:00 UT). The shock arrival speed of 450 km/s seems low for a 2.2 days transit time required for the 20 September CME. Perhaps the shock was due to other sources, such
1078 H.-L. Lam et al.: Case studies of space weather events
Fig. 6. SOHO LASCO C2 running difference image showing a
full halo CME with 360◦angular width on 20 September 1999 at 06:30 UT.
as one of the disappearing filaments prior to 20 September, or the CME ejecta had varied in speed. However, around 19:00 UT the speed increased to about 600 km/s, matching the CME’s plane of sky speed of 604 km/s, which requires a transit-time of 2.9 days. The lag-time between the onset of the CME at 06:06 UT on 20 September and the occurrence of the intense geomagnetic activity at OTT 22:00 UT on 22 September is 2.7 days. Since both the transit-time and lag-time are very close, the geomagnetic disturbance is likely to be due to the CME. Indeed, the subsequent solar wind measurements after 19:00 UT show characteristic signatures of a magnetic cloud with the rotation of magnetic field
vec-tor, as indicated by Bz going from positive to negative and
slowly moving to positive again, an enhanced total magnetic
field strength Bt, and a decrease in solar wind temperature
reaching minimum around 03:00 UT. The Bx, By, Bz, and Bt
profiles seem to resemble those shown in a plot of Farrugia et al. (1993), which displays disturbed interplanetary condi-tions (observed by IMP-8) caused by the passage of coronal mass ejecta. Furthermore, the monotonic decrease in the bulk velocity after 20:00 UT, with the related density depletion, is a signature of expansion of the magnetic cloud with outflow from the center (Klein and Burlaga, 1982). Thus, the ground geomagnetic disturbance is likely to be caused by the passage of a magnetic cloud due to the full halo CME.
After the sudden impulse around 12:30 UT on 22 Septem-ber, the magnetic field at PBQ and OTT remained quiet
for the next seven hours while IMF Bz was northward.
The southward turn in IMF Bz around 19:00 UT triggered
the start of intense magnetic activity. Initially (19:00 to
21:00 UT), the magnetic field disturbance was greater at PBQ
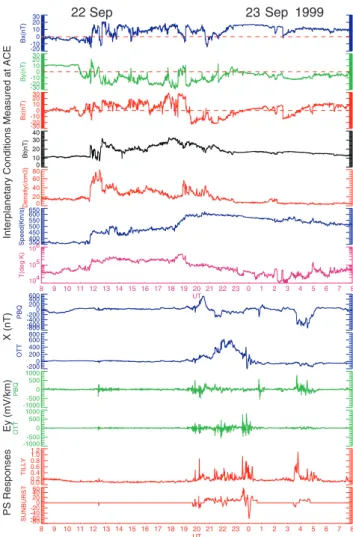
Fig. 7. Same as Fig. 4 except for the 22–23 September event.
than at OTT, indicating that the electrojet was in a typical au-roral zone location. However, from 21:00 to 00:30 UT, the disturbance at OTT was larger showing that the electrojet currents had moved equatorward with an expansion of the auroral oval. The magnetic disturbance between 03:00 and 05:00 UT was larger at PBQ indicating that the electrojet had returned to its normal location. Between 19:00 and 01:00 UT (14:00 and 20:00 EST), x variations were mainly positive at OTT and PBQ indicating an eastward electrojet, while the negative x variations between 03:00 and 05:00 UT (22:00 and 00:00 EST) were due to a westward electrojet.
Electric fields were the largest of the three events dis-cussed in this paper and, unlike the earlier ones, were larger at OTT (peak value 800 mV/km) than at PBQ (peak value 520 mV/km) during the geomagnetically disturbed interval between 19:00–01:00 UT, showing an additional effect of the expanded auroral oval. The power system harmonics recorded at Tilly were closely related to the electric fields at PBQ in the intervals 19:00 to 21:00 UT and 03:00 to 05:00 UT when the activity was greatest at PBQ. However, during the interval 21:00 to 01:00 UT, when the auroral oval had expanded and magnetic activity was greater at OTT, the Tilly harmonics showed less correspondence to the electric
fields at PBQ, and were more closely related to the OTT elec-tric fields. This would indicate that, at this time, GIC located further south in the Hydro-Qu´ebec system were responsible for the generation of harmonics, which then moved to other sites including Tilly. The increased electric field amplitudes experienced further south than usual during this event gave rise to higher GIC levels at the Sunburst site, reaching a peak of −60 A around 00:00 UT (19:00 EST).
7 Summary and discussion
We have presented three case studies. We put the space weather events from start to finish in a coherent picture, trac-ing these events from the Sun, through the solar wind, and to the ground with their eventual impacts on the power sys-tems. In these three cases with different probable solar ori-gins (coronal hole, possibly partial halo CME and coronal hole, and full halo CME) and hence, different solar wind sig-natures, a southward interplanetary magnetic field (i.e.
neg-ative Bz) facilitated an efficient transfer of energy from the
solar wind to the magnetosphere, resulting in intense geo-magnetic activity whose induced electric fields led to induced currents measured in power systems. For the most intense
event of 22–23 September, Bz registered the largest
excur-sion of −25 nT, whereas Bzfor the other two events reached
only −10 nT. In all three cases, the solar wind speeds attained peak values around 600 km/s. The event of 22–23 September produced the largest GIC in the noon and dusk sectors which were due to the eastward electrojet south of the typical au-roral zone location, while the GIC for the other two events were due to the westward electrojet in the auroral zone in the midnight and dawn sectors.
Acknowledgements. We acknowledge the use of Yohkoh, SOHO,
and ACE data maintained by NASA, NRL, and Caltech ACE Sci-ence Center respectively. Yohkoh is a project of the Institute of Space and Astronautical Sciences, Japan, with participation from the US and UK. The Yohkoh SXT was prepared by Lockheed Palo Alto Research Laboratory, the National Astronomical Obser-vatory of Japan, and the University of Tokyo, with the support of NASA and ISAS. SOHO is a project of international cooperation between ESA and NASA. The SOHO LASCO was constructed by a consortium of institutions: the Naval Research Laboratory (US), the University of Birmingham (UK), the Max-Planck-Institut f¨ur Aeronomie (Germany), and the Laboratoire d’Astronomie Spatiale (France). The SOHO LASCO CME Catalog is generated and main-tained by the Centre for Solar Physics and Space Weather, The Catholic University of America, in cooperation with the Naval Re-search Laboratory and NASA. ACE is an Explorer mission man-aged by NASA Office of Space Science. The Dst, ap, and Apdata
were obtained from the NOAA National Geophysical Data Center. We are grateful to Hydro-Quebec for supplying Tilly harmonic data and to Electric Research for providing the Sunburst GIC data.
Topical Editor E. Antonucci thanks P. Cargill and another ref-eree for their help in evaluating this paper.
References
Akasofu, S.-I.: Physics of magnetospheric substorms, D. Reidel Publishing Company, Holland, 1977.
Boteler D. H., Pirjola, R. J., and Nevanlinna, H.: The effects of ge-omagnetic disturbances on electrical systems at the Earth’s sur-face, Adv. Space Res., 22, 17–27, 1998.
Burlaga, L. F., Sittler, E., Mariani, F., and Schwenn, R.: Magnetic loop behind an interplanetary shock: Voyager, Helios, and IMP 8 observations, J. Geophys. Res., 86, 6673–6684, 1981. Dungey, J. W.: Interplanetary magnetic field and the auroral zones,
Phys. Rev. lett., 6, 47–48, 1961.
Farrugia, C. J., Freeman, M. P., Burlaga, L. F., Lepping, R. P., and Takahashi, K.: The Earth’s magnetosphere under continued forc-ing: Substorm activity during the passage of an interplanetary magnetic cloud, J. Geophys. Res., 98, 7657–7671, 1993. Ferguson, I. J. and Odwar, H. D.: Review of conductivity soundings
in Canada, Vol. 3, Geomagnetic Hazard Assessment, Phase II, Geological Survey of Canada Open File No. 3420, 1997. Gosling, J. T.: Coronal mass ejections and magnetic flux ropes in
interplanetary space, in: Physics of Magnetic Flux Ropes, (Eds) Russell, C. T., Priest, E. R., and Lee, L. C., Geophys. Monogr. Ser., Vol. 58, AGU, Washington D. C., 330–364, 1990.
Klein, L. W. and Burlaga, L. F.: Interplanetary magnetic clouds at 1 AU, J. Geophys. Res., 87, 613–624, 1982.
Krieger, A. S., Timothy, A. F., and Roelof, E. C.: A coronal hole and its identification as the source of a high velocity solar wind stream, Sol. Phys., 29, 505–525, 1973.
Lam, H.-L.: Verification of 27 day three-zone geomagnetic fore-cast, in Solar-Terrestrial Prediction-V, Proceedings of a Work-shop at Hitachi, Japan, 23–27 January 1996, (Eds) Heckman, G., Marubashi, K., Shea, M. A., Smart, D. F., and Thompson, R., 315–322, 1997.
Lam, H.-L. and Samson, J. C.: An investigation of the time-delay between solar events and geomagnetic disturbances using a new method of superposed epoch analysis, J. Geomag. Geoelectr., 46, 107–113, 1994.
Lanzerotti L. J. and Gregori, G. P.: Telluric currents: The natural environment and interaction with man-made systems, in: The Earth’s electrical environment, National Academy Press, Wash-ington, D. C., 232–257, 1986.
Lesher, R. L., Porter, J. W., and Byerly, R. T.: SUNBURST – A net-work of GIC monitoring systems, IEEE Trans. Power Delivery, 9, 128–137, 1994.
Sheeley, Jr., N. R., Harvey, J. W., and Feldman, W. C.: Coro-nal holes, solar wind streams and recurrent geomagnetic distur-bances: 1973–1976, Sol. Phys., 49, 271–278, 1976.
Tsurutani, B. T., Gonzalez, W. D., Gonzalez, A. L. C., Tang, F., Ar-ballo, J. K., and Okada, M.: Interplanetary origin of geomagnetic activity in the declining phase of the solar cycle, J. Geophys. Res., 100, 21 717–21 733, 1995.
Webb, D. F. and Hundhausen, A. J.: Activity associated with the solar origin of coronal mass ejections, Solar Phys., 108, 383– 401, 1987.