HAL Id: hal-00271198
https://hal.archives-ouvertes.fr/hal-00271198
Submitted on 17 Dec 2015
HAL is a multi-disciplinary open access
archive for the deposit and dissemination of
sci-entific research documents, whether they are
pub-lished or not. The documents may come from
teaching and research institutions in France or
abroad, or from public or private research centers.
L’archive ouverte pluridisciplinaire HAL, est
destinée au dépôt et à la diffusion de documents
scientifiques de niveau recherche, publiés ou non,
émanant des établissements d’enseignement et de
recherche français ou étrangers, des laboratoires
publics ou privés.
L. Rodriguez, A.N. Zhukov, S. Dasso, C.H. Mandrini, H. Cremades, et al.. Magnetic clouds seen at
different locations in the heliosphere. Annales Geophysicae, European Geosciences Union, 2008, 26
(2), pp.213-229. �10.5194/angeo-26-213-2008�. �hal-00271198�
© European Geosciences Union 2008
Geophysicae
Magnetic clouds seen at different locations in the heliosphere
L. Rodriguez1, A. N. Zhukov1,2, S. Dasso3,4, C. H. Mandrini3, H. Cremades5, C. Cid6, Y. Cerrato6, E. Saiz6, A. Aran7, M. Menvielle8, S. Poedts9, and B. Schmieder10
1Solar Influences Data analysis Center, Royal Observatory of Belgium, Brussels, Belgium 2Skobeltsyn Institute of Nuclear Physics, Moscow State University, Moscow, Russia 3Instituto de Astronom´ıa y F´ısica del Espacio, CONICET-UBA, Buenos Aires, Argentina
4Departamento de F´ısica, Facultad de Ciencias Exactas y Naturales, Universidad de Buenos Aires, Buenos Aires, Argentina 5NASA Goddard Space Flight Center, Greenbelt, MD, USA
6Universidad de Alcala, Madrid, Spain 7Universitat de Barcelona, Spain
8Centre d’´etude des Environnements Terrestre et Plan´etaires, V´elizy, France 9K.U. Leuven, Leuven, Belgium
10Observatoire de Paris, Meudon, France
Received: 17 January 2007 – Revised: 26 July 2007 – Accepted: 26 July 2007 – Published: 26 February 2008
Abstract. We analyze two magnetic clouds (MCs) observed in different points of the heliosphere. The main aim of the present study is to provide a link between the differ-ent aspects of this phenomenon, starting with information on the origins of the MCs at the Sun and following by the analysis of in-situ observations at 1AU and at Ulysses. The candidate source regions were identified in SOHO/EIT and SOHO/MDI observations. They were correlated with H-α images that were obtained from ground-based obser-vatories. Hints on the internal magnetic field configura-tion of the associated coronal mass ejecconfigura-tions are obtained from LASCO C2 images. In interplanetary space, magnetic and plasma moments of the distribution function of plasma species (ACE/Ulysses) were analyzed together with informa-tion on the plasma composiinforma-tion, and the results were com-pared between both spacecraft in order to understand how these structures interact and evolve in their cruise from the Sun to 5 AU. Additionally, estimates of global magnitudes of magnetic fluxes and helicity were obtained from magnetic field models applied to the data in interplanetary space. We have found that these magnetic characteristics were well kept from their solar source, up to 5 AU where Ulysses provided valuable information which, together with that obtained from ACE, can help to reinforce the correct matching of solar events and their interplanetary counterparts.
Keywords. Solar physics, astrophysics, and astronomy (Flares and mass ejections; Magnetic fields)
Correspondence to: L. Rodriguez
1 Introduction
Coronal mass ejections (CMEs) are extremely dynamic events in which the plasma, initially contained in closed coronal magnetic structures, is ejected into interplanetary space. When they are detected in-situ by a spacecraft located in the interplanetary medium, they are termed interplanetary CMEs (ICMEs). If a smooth rotation in the magnetic field vector is present, together with relatively high magnetic field intensity and low plasma temperatures (Burlaga, 1991), then the ICME is called a magnetic cloud (MC). The distinction between a cloud and a non-cloud ICME can only be made in interplanetary space. Only in-situ data can help discern-ing between the two types. When the CME is seen remotely, there is no apparent way of forecasting what the interplane-tary structure will look like. We have compared the features observed at the Sun during and after the eruption of the mag-netic structure with features observed in interplanetary space, first at 1 AU (from ACE data) and after at the Ulysses loca-tion.
Our starting point was a list of events compiled in the frame of an ISSI (International Space Science Institute) workshop. This (non exhaustive) list contains halo CMEs during the SOHO (Solar and Heliospheric Observatory, Domingo et al., 1995) era which, after the arrival at Earth of the ejected CMEs, were followed by severe geomagnetic storms. For the present paper, we have selected two events which were also seen by the Ulysses spacecraft. For one of them (November 2001), the Ulysses spacecraft was at very high latitudes, while for the second one (January 2005) Ulysses was located close to the ecliptic plane. Both events were highly geoeffective. The magnetic storms they caused
frontside and backside halo CMEs, thus allowing us to de-termine if a halo CME is directed towards or away from the Earth. The possibility of identification of solar sources of ICMEs using SOHO observations has been convincingly demonstrated (see e.g. Webb et al., 2000; Zhang and Golub, 2003; Zhukov, 2005).
Using magnetic field models to interpret in situ measure-ments can provide important insights into the properties of ICMEs. Flux rope fitting models have been applied to in situ data for more than 20 years. Beginning with linear force-free models (Goldstein, 1983; Lepping et al., 1990), they have evolved to include the effect of expansion (Osherovich et al., 1993), non force-free effects (Mulligan et al., 2001; Hidalgo et al., 2002a), elliptical geometries (Hidalgo et al., 2002b), the development of a Grad-Shafranov reconstruction technique (Hu and Sonnerup, 2001) and the generalization of the Lundquist solution for an oblate cylinder (Vandas and Romashets, 2003).
A valuable tool to link solar and interplanetary condi-tions is the information from the heavy elements in the solar wind, which provide extremely important information about the origin of the solar wind. Since the ionic composition does not change in interplanetary space, it provides a di-rect measurement of the plasma properties below a few solar radii. Therefore, by means of the freezing-in principle in-troduced by Hundhausen et al. (1968), the electron temper-ature (or freezing-in tempertemper-ature) in the low corona can be derived. Nowadays, it is clear that the periods in which high-est freezing-in temperatures are detected correspond almost unambiguously to ICMEs (i.e. Richardson and Cane, 2004). Henke et al. (1998), Rodriguez et al. (2004) and Rodriguez et al. (2005) demonstrated that the ionization level of oxygen is particularly increased if the ICME has a MC structure.
Other characteristic of magnetic clouds, helpful to link them with their solar source, is their chirality (the sign of their magnetic helicity). Magnetic helicity is one of the few magnetohydrodynamic (MHD) quantities which is almost preserved even under non-ideal conditions in the solar atmo-sphere (Berger, 1984) and in the helioatmo-sphere. This quantity measures the degree of shear and/or twist in coronal and in the interplanetary magnetic structures. A clockwise rotation and right-handed twist of coronal loops or interplanetary flux tubes implies positive helicity, and vice versa for negative he-licity. Rust (1994) and Low (1996) suggested that CMEs are
nique to compute MHD global invariants, some authors have estimated the helicity content in clouds (see e.g. Dasso et al., 2003, 2005, 2006; Lynch et al., 2005; Hu and Dasgupta, 2005). Mandrini et al. (2005) and Luoni et al. (2005) com-puted the magnetic helicity ejected from a very small active region (AR) and a typical size AR and compared those values to the helicity in the MC associated to each ejection. They found a very good agreement in both cases (small AR with small MC, typical size AR with typical MC) that differed in
∼3 orders of magnitude.
In the present work we use the tools mentioned above to analyze the two ICMEs under study. Their counterparts close to the Sun, i.e. their associated CMEs, were identified in the SOHO/LASCO coronagraphs by tracing back in time the interplanetary disturbances, taking into account their speed at 1 AU. Often more than one candidate CME was detected within the required temporal window. In addition, the asso-ciated source regions of the candidate CMEs were identified in SOHO/EIT extreme-UV images of the low corona, as well as in SOHO/MDI magnetograms and in H-α images from the H-α Network (http://www.bbso.njit.edu/Research/Halpha/). Later on, in situ measurements were carefully compared with their close-to-the-Sun counterparts, by considering the three-dimensional position of the spacecraft with respect to the Sun, the properties of the interplanetary disturbances, the morphology and orientation of the involved CMEs (see Cre-mades and Bothmer, 2004), and the characteristics of the as-sociated solar sources.
2 The November 2001 events 2.1 The solar events
On 21 November (DOY 325) a halo CME was observed by LASCO/C2. It started at 14:06 UT as a partial halo, with out-line asymmetry towards the SW (Fig. 1a). It appeared in the field of view (FOV) of LASCO/C3 at 15:18 UT, and later de-veloped as a full halo. This CME was not fast and probably did not have an accompanying shock. Estimated plane-of-sky (POS) speeds are 395 km s−1(from Halo CME Archive at http://lasco-www.nrl.navy.mil/halocme/) and 518 km s−1 and 502 km s−1 (linear and second order fits respectively,
Fig. 1. Wavelet processed LASCO/C2 images of the CMEs in November 2001. (a) CME from 21 November (DOY 325), (b) first CME from 22 November (DOY 326) and (c) second CME from 22 November.
Fig. 2. EIT images of the post eruptive arcades (top panels) and coronal dimmings (bottom panels) corresponding to the three eruptions in November 2001. The lower panels show difference images. (a) CME from 21 November (DOY 325), (b) first CME from 22 November (DOY 326) and (c) second CME from 22 November.
from LASCO CME Catalog at http://cdaw.gsfc.nasa.gov/ CME list).
The long duration event (LDE) C4.7 from NOAA AR9704 (S14W19), with peak emission at 14:58 UT, was most likely associated with this CME. If a disappearing filament was in-volved in this eruption, it must had been an active one, not observable with the cadence of the instruments of the H-α Network on that day. In Fig. 2a EIT post-eruptive loops and coronal dimmings are shown for this event.
From the inspection of LASCO/C2 images, ratio and wavelet-processed (the latter available at http://lasco-www. nrl.navy.mil/index.php?p=content/wavelet), the main axis of this CME seems to be highly vertically inclined, as suggested by the upright threads within the CME and by the orientation of its associated source region.
The following day, 22 November (DOY 326), two halo CMEs were observed. The first came into the field of view in LASCO/C2 at 20:58 UT on the SW limb. It was so fast
Fig. 3. H-α images (from Kanzelh¨ohe Observatory, http://www. solobskh.ac.at/) of the filament disappearance on 22–23 November (DOY 326–327), 2001.
that only one image of the developed event could be recorded (Fig. 1b). It appeared for the first time in the LASCO/C3 FOV at 21:18 UT, showing strong outline asymmetry to-wards the SW. A very tenuous rim surrounded the C3 oc-culter, probably being the manifestation of a shock. The POS speed estimated in the Halo CME Archive amounts to 1246 km s−1, while the LASCO CME Catalog determines values of 1443 km s−1and 1231 km s−1from linear and 2nd order fits.
The eruption could be tracked down to the low corona as observed by the EIT instrument. It was accompanied by a bright flare, dimming in the low corona, an EIT wave, and post-eruptive loops in NOAA AR9698 (Fig. 2b). GOES de-tected an M3.8 flare in that region, centered in S25W67, which peaked at 20:36 UT. Again, the cadence and observ-ing time intervals of the instruments from the H-α network did not allow the observation of the eruption of an active fil-ament within this active region. There is a small filfil-ament to the west of NOAA AR 9698 that is a candidate to play a role in this eruption. However, the source region is almost on the limb on the next day, hindering its inspection. Yohkoh data was unavailable after 16:30 UT on this day.
The morphology of this CME appears highly bubble-like in LASCO/C2 ratio images. However, wavelet enhancing suggests an axis oriented mostly in the E-W direction; this is indicated by the linear features in the CME seen tilted ∼30◦
from the ecliptic, though still in projection.
The second halo CME on 22 November (DOY 326) was first observed by LASCO/C2 at 23:30 UT, as a highly sym-metrical halo, with some brightness asymmetry towards the NW (Fig. 1c). It appeared in the LASCO/C3 FOV at 23:42 UT, propagating with similar, high speed. The POS speed calculated by the Halo CME Archive is 1500 km s−1, while the LASCO CME Catalog gives 1437 km s−1 (linear fit) and 1371 (2nd order fit). This event caused a proton storm in LASCO images.
In the low corona, the eruption began with the activation and rising of a large filament (∼20◦ long), quite curved,
Fig. 4. MDI images showing the evolution of the magnetic con-figuration of AR 9704. The images have been derotated to central meridian passages (CMP). The FOV is 319×207 pixels (each pixel is 1.98 arcsec size) and the field is saturated below (above) −500 G (500 G).
located to the N of NOAA AR9704 (Fig. 3). It was fol-lowed by an EIT wave, a dimming, and post-eruptive loops (Fig. 2c). GOES registered a M9.9 flare with peak at 23:30 UT, centered in S17W24. H-α images from the fila-ment before its eruption/disappearance suggest that it is sinis-tral, which means that it has a positive magnetic helicity (see e.g. Pevtsov et al., 2003), accordingly EIT loops indicate right handedness.
After the inspection of LASCO/C2 images, both ratio and wavelet-processed, we concluded that the main axis of this CME seems to be oriented in the N-S direction. Even if the source region of this CME was located in the Southern Hemi-sphere, the material was ejected in the northward direction. Note that a possible reason for such a deflection could be the location of the heliospheric current sheet (HCS) on that day. The HCS (derived from potential field source surface maps from Wilcox Solar Observatory) was positioned at more than 30◦N.
Figure 4 shows the evolution of the magnetic configuration in AR 9704, from 16 (DOY 320) to 22 (DOY 326) Novem-ber. This AR was born to the east of a big decaying region. The latter is a Hale AR (negative polarity preceding the tive one), but the former seems to be non-Hale, with the posi-tive polarity preceding the negaposi-tive one. There is marked flux emergence during the AR disk transit with the negative polar-ity becoming stronger, while the positive area grows, seems to rotate around the negative polarity and is, partially, can-celled by it. This rotation has been seen before and, in gen-eral, is an indication of the presence of a highly active region (L´opez Fuentes et al., 2002). By 21 November (DOY 325) a new bipole is observed emerging to the north of the AR (see Fig. 4, bottom right panel), this bipole has a strong negative polarity and a more diffuse positive one. This strong flux emergence could have caused the destabilization and erup-tion of the filament discussed in the previous paragraphs.
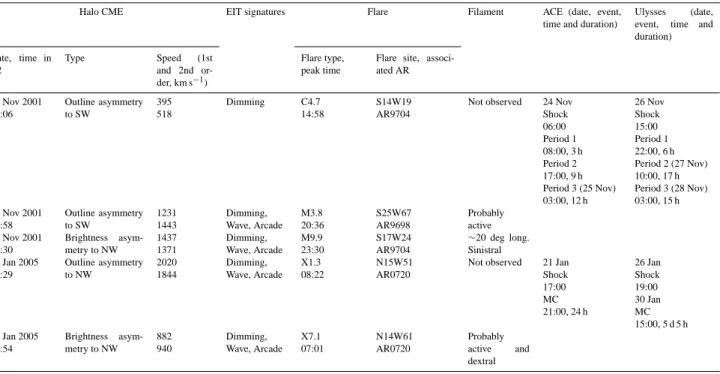
Table 1. Characteristics and timings of the candidate halo CMEs, their associated solar signatures and interplanetary counterparts.
Halo CME EIT signatures Flare Filament ACE (date, event,
time and duration)
Ulysses (date, event, time and duration) Date, time in C2 Type Speed (1st and 2nd or-der, km s−1) Flare type, peak time
Flare site, associ-ated AR 21 Nov 2001 14:06 Outline asymmetry to SW 395 518 Dimming C4.7 14:58 S14W19 AR9704
Not observed 24 Nov Shock 06:00 Period 1 08:00, 3 h Period 2 17:00, 9 h Period 3 (25 Nov) 03:00, 12 h 26 Nov Shock 15:00 Period 1 22:00, 6 h Period 2 (27 Nov) 10:00, 17 h Period 3 (28 Nov) 03:00, 15 h 22 Nov 2001 20:58 Outline asymmetry to SW 1231 1443 Dimming, Wave, Arcade M3.8 20:36 S25W67 AR9698 Probably active 22 Nov 2001 23:30 Brightness asym-metry to NW 1437 1371 Dimming, Wave, Arcade M9.9 23:30 S17W24 AR9704 ∼20 deg long. Sinistral 19 Jan 2005 08:29 Outline asymmetry to NW 2020 1844 Dimming, Wave, Arcade X1.3 08:22 N15W51 AR0720
Not observed 21 Jan Shock 17:00 MC 21:00, 24 h 26 Jan Shock 19:00 30 Jan MC 15:00, 5 d 5 h 20 Jan 2005 06:54 Brightness asym-metry to NW 882 940 Dimming, Wave, Arcade X7.1 07:01 N14W61 AR0720 Probably active and dextral
Information on solar and interplanetary characteristics of these events is grouped in Table 1.
2.2 Interplanetary observations
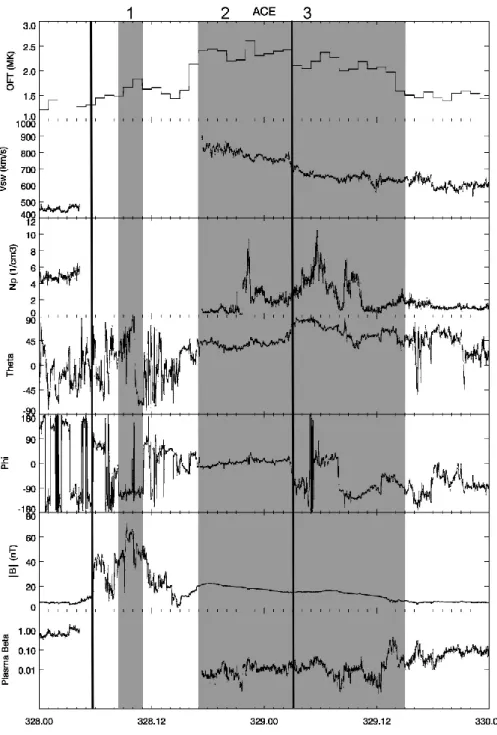
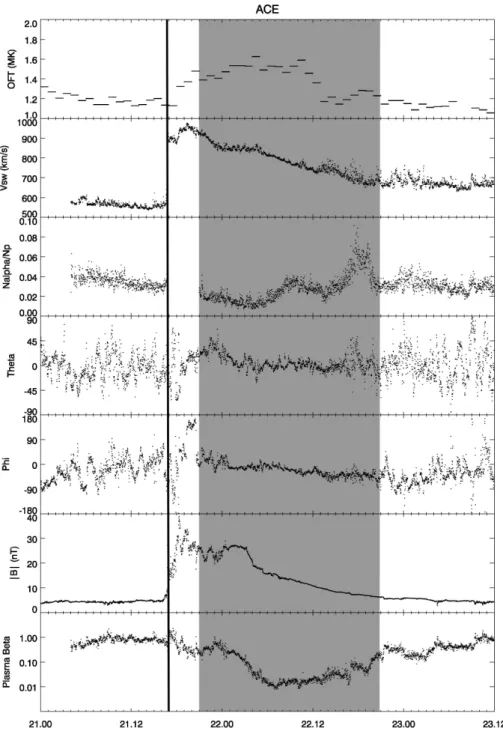
On 24 November (DOY 328), a disturbance arrived at the ACE spacecraft, located at the L1 Lagrange point. A strong shock was clearly seen in magnetic field data around 06:00 UT, plasma data were absent for that period but the presence of the shock was confirmed by data from the WIND spacecraft (data available online at http://ftpbrowser.gsfc. nasa.gov/). As it can be seen in Fig. 5, where plasma and magnetic field parameters for this event are displayed, the shock (first vertical line in the figure) was followed by a sheath region, with compressed magnetic field and plasma, which extended until 17:00 UT on the same day. Right after the end of the sheath, a zone which shows the signatures of an ICME, possibly a magnetic cloud (MC) is seen (shaded area number 2). The signatures of this event are a strong magnetic field magnitude, a smooth variation in the field components (even though it is not a clear rotation), low plasma beta and increased charge states (shown here as oxygen freezing-in temperature, OFT, reaching up to 2.5 MK). The decreasing velocity profile evidences that the cloud was expanding as it passed ACE.
We believe that there are two other structures which can be detected in the vicinity of the one mentioned in the previous paragraph. The first one appears hidden within the sheath preceding the cloud (shaded area number 1). There, only for
a brief period of around three hours, starting at 08:00 UT on 24 November (DOY 328), a structure appears which is somewhat different from normal sheath plasma. It presents a rotation in the magnetic field, accompanied by very high field intensity, with a peak above 60 nT and a local maximum in the OFT, reaching almost 2 MK. Inspection of WIND plasma data shows that this is a period of increased proton temper-ature and density. The other period which shows distinctive characteristics is the one coming right after the end of the MC (shaded area number 3). It shows all the signatures of an ICME (increased OFT and alpha to proton density, decreased temperature and strong magnetic field). It is worth noticing that bidirectional suprathermal electrons (BDEs) measured by the SWEPAM instrument onboard ACE, even though patchy, were present throughout the duration of these tran-sient events and especially during the period which is de-scribed here as a MC.
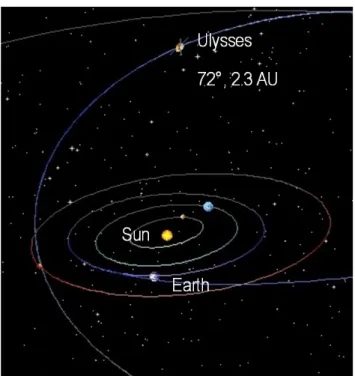
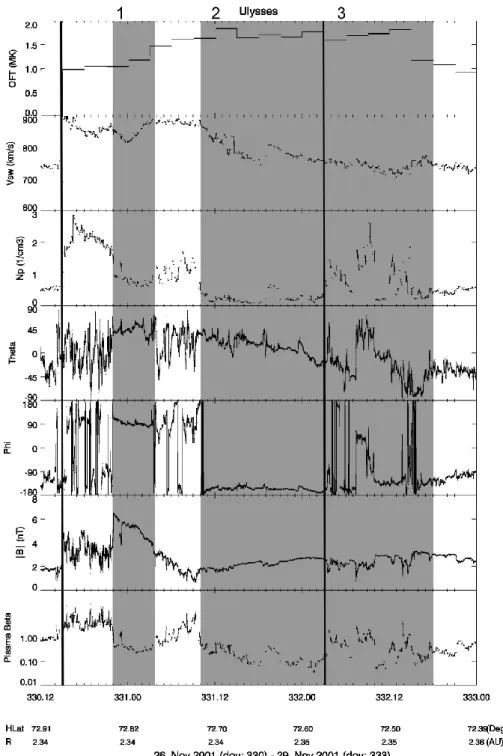
At Ulysses, located at 72◦north of the ecliptic plane and 2.3 AU (Fig. 6) the situation was quite similar to that in ACE, which can be surprising considering the large latitudinal sep-aration. We show the Ulysses data in Fig. 7a, in the same format as Fig. 6. There is a shock clearly discernable in plasma and magnetic field data at approximately 16:00 UT on 26 November (DOY 330), followed by a sheath region in which we again see a structure within the normal chaotic sheath configuration (shaded area number 1). In this case, the structure is much clearer than in ACE, showing all the features of a small scale magnetic cloud, lasting approxi-mately 6 h. Then a period containing a more classical MC
Fig. 5. ACE observations of the events in November 2001. The first vertical line marks the arrival of a shock (corroborated with Wind plasma data, not shown here). The first shading region shows an atypical region within the sheath. The second, bigger, shaded region represents the ejection, with the vertical line close to the middle separating a first part which shows MC characteristics from a second part which presents a non-cloud ICME structure.
appears (shaded area number 2), with its typical rotation and low plasma beta. There is a small discontinuity in plasma and magnetic field data close to the middle of the cloud. Im-mediately following the cloud, there is a region that does not
correspond to the normal solar wind (shaded area number 3). It is marked by high proton density and increased values of OFT, but does not have the corresponding magnetic field con-figuration in order to be classified as a cloud. As in ACE,
BDEs are detected through the duration of the event. This event was also studied by Reisenfeld et al. (2003) and Lario et al. (2004).
Summarizing, we see, first at ACE and then at Ulysses, three closely related intervals which can be the interplane-tary manifestation at 1 AU and 2.3 AU, of the three events that left the Sun several days earlier. Considerations of tran-sit speeds and arrival times are consistent with this identifica-tion. Even though our separation into three periods in inter-planetary space might seem arbitrary, we believe that there are enough clues for it. Nevertheless, it is clear that the sep-aration in parts of an ejecta/s of such complexity is difficult and probably impossible (see Burlaga et al., 2002). What is clear is that three eruptions occurred at the Sun and, after a reasonably well matched amount of time, their combined manifestation was detected in in-situ data. Gopalswamy et al. (2003) analyzed these CMEs and concluded also that they interacted in interplanetary space.
A deeper analysis of the magnetic field data provides fur-ther clues into the configuration of the event termed earlier as a MC, the central event. The chirality at both spacecraft cor-responds with that seen at the Sun for the erupting filament and arcade (right handed, positive). By applying a magnetic field model from Hidalgo et al. (2002b) we obtain the orien-tation of the cloud axis at both spacecraft. This is a non-force free, elliptical cross-section model. The model provides nine parameters: θ and φ (attitude of the cloud axis), λ and α (fac-tors of the current density), η (eccentricity factor), t0 (char-acteristic expansion time), ζ (orientation of the cloud cross section), Byo (magnetic field of the cloud axis), yo (closest approach distance of the spacecraft to the cloud axis).
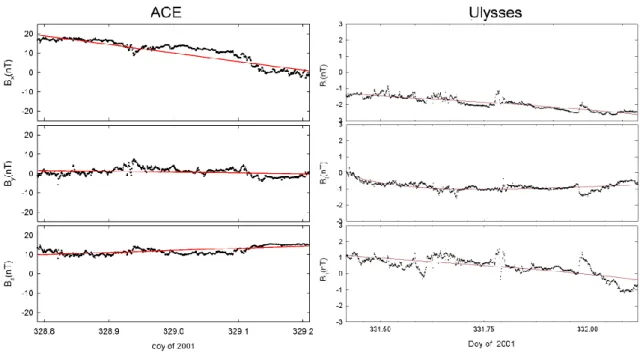
Looking at the orientation of the cloud axis from the val-ues obtained from the model, it can be seen that at ACE it corresponds to a highly inclined flux rope with an angle of 76◦with respect to the ecliptic plane (theta) and 181◦ with respect to the Earth-Sun line (phi). At Ulysses, in RTN co-ordinates, we obtain the cloud axis of theta 40◦(north) with respect to the RT plane and longitude with respect to the Sun-Ulysses line of 360◦(phi). The fits done to the data are shown in Fig. 7b. This configuration corresponds with an inclined CME as seen from Earth, in agreement with the orientation of the second CME and its associated erupting filament on 22 November (DOY 326) whose uppermost part was sam-pled by Ulysses with an axis pointing close to the Ulysses-Sun direction (a sketch of the scenario is shown in Fig. 8).
3 The January 2005 events 3.1 The solar events
On 19 January, LASCO C2 observed a CME, appearing over the NW limb at 08:29 UT in its FOV (Fig. 9a). It reached C3 at 09:16 UT and was classified as a full halo CME. The bulk of the CME was surrounded by a tenuous envelope, which
Fig. 6. Relative position of Ulysses and the Earth (ACE) for the events in November 2001.
probably outlines the shock. It is only this faint shell which appears to surround the C3 occulter after full development of the CME. The Halo CME Archive estimated the speed of this faint envelope as ∼1960 km s−1, and the speed of the bulk of the CME as ∼1855 km s−1. The CME Catalog gives linear and 2nd-order fit speeds of 2020 km s−1 and 1844 km s−1, respectively.
This CME is most likely associated with an eruption in NOAA AR10720, which produced several flares. The closest in time to the eruption was an X1.3 flare located in N15W51, with peak emission at 08:22 UT. There was a second eruption after the main one, associated with an M2.7 flare in N17W52 with peak at 10:24 UT. The material ejected in this erup-tion was injected into the bulk of the previous CME. Both eruptions were associated with EIT waves, coronal dimmings and post-eruptive loops (Fig. 10a). H-α images of NOAA AR10720 reveal the presence of several active filaments, which were interpreted to have dextral chirality, meaning a negative helicity sign (see Pevtsov et al., 2003). It is difficult to tell from the poor cadence of the instruments observing at that time, if one (or more) of them left the Sun to become part of the CME. The near-limb location of this region further complicates its characterization.
This CME exhibits a bubble-like morphology with hints of an axis oriented almost horizontally, as evidenced by the flux-rope like features seen in Fig. 9a. The location of NOAA AR 10720 near the limb by the time of eruption and the apparent geometry of the CME suggest that its principal direction of propagation lies approximately on the plane of
Fig. 7a. Ulysses measurements of the events in November 2001. The first vertical line marks the arrival of a shock. The first shading region shows an atypical region within the sheath. The second, bigger, shaded region represents the ejection, with the vertical line close to the middle separating a first part which shows MC characteristics from a second part which presents a non-cloud ICME structure.
the sky. However, this event could well have reached both ACE and Ulysses.
A second full halo was observed on 19 January. This was classified as front-sided by the Halo CME Archive, due to the intense activity on the front-sided NOAA AR 10720. However, this faint halo CME appears first on the NE
so-lar limb, where no apparent activity on the visible disk can be observed. It is therefore reasonable to classify this halo as backsided.
On 20 January, an extremely intense proton “snowstorm” event degraded LASCO images so severely that the respon-sible halo CME could be hardly discerned. Only the first
Fig. 7b. The three components of the magnetic field for the event of November 2001. The fit of the Hidalgo et al. (2002b) model is overplotted in red. Left panel shows ACE data and the right one the corresponding Ulysses data.
Fig. 8. A sketch showing the scenario of the 3-D magnetic cloud topology as it travels far away from the Sun (blue colour corre-sponds to the cloud when it passes the ACE spacecraft, and grey colour corresponds to the cloud when it is observed by Ulysses).
Fig. 9. (a) LASCO C2 image of the CME on 19 January 2005. Note the circular features towards the NW end of the FOV. (b) The only LASCO C2 snapshot of the CME on 20 January 2005. Due to the proton storm, the image looks blurred after cosmic ray removal.
appearance of the CME could be observed in the C2 FOV, at 06:54 UT (Fig. 9b). After that, all frames appear totally ruined due to the intense proton storm, also in LASCO C3. The only frame in which the CME can be observed, suggests a halo CME with an outline asymmetry towards the NW. The POS linear speed of this event was estimated by the CME Catalog to be 882 km s−1, based only on 3 data points.
This “noisy” halo CME seems to be also associated with NOAA AR 10720. GOES reported an X7.1 flare in that re-gion (centered at N14W6) with peak emission at 07:01 UT (start: 06:36 – end: 07:27). About an hour prior to the flare onset, expanding loops from NOAA AR 10720 can be ob-served in EIT. The flare is followed by bright post-eruptive
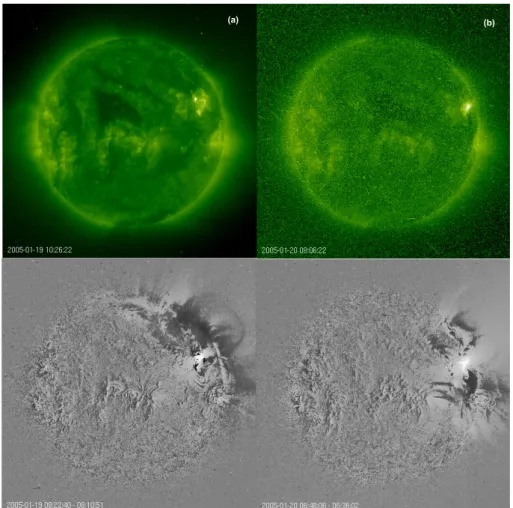
Fig. 10. EIT images of the post eruptive arcades (top panels) and coronal dimmings (bottom panels) corresponding to the activity in NOAA AR 10720 in January 2005. The lower panels show difference images. (a) CME from 19 January, (b) CME from 20 January.
loops (Fig. 10b). H-α high-cadence images from Culgoora Solar Observatory show the appearance of a two-ribbon flare at ∼06:44 UT. Again, the filaments in this AR seem to be dextral. It is hard to tell if any of those active filaments was associated with this halo CME, due to the limb location of this source region and poor spatial resolution of the available H-α data.
It is not possible to deduce anything about the morphology of this halo CME. However, the global geometry of the post-eruptive loops seen in EIT suggests an oblique orientation of its main axis. This inclination is about 45◦–60◦from the
north-south line, but opposite to that predicted by Joy’s law for filament orientations.
Analyzing MDI data, it can be seen that AR 10720 ap-peared at the east solar limb as a simple bipolar region on 10 January. During its disk transit several bipoles emerged within the AR on 12, 13 and 16 January, the most promi-nent one in flux and magnetic shear appeared on 13 January (Zhao and Wang, 2006). All major flares (including 5 X-class X-ray flares) occurred in this region after this last emer-gence. Strong shearing motions could be seen along the main
polarity inversion line, where this strongest bipole emerged. These motions increased the non-potentiality of the region (Zhao and Wang, 2006) and were favorable for the creation of a twisted flux tube, or for increasing the flux of an already present flux tube. The flux could increase up to the point at which the tube would become unstable and erupt giving rise to several eruptive events. Figure 11 shows the evolution of AR 10720 magnetic configuration from 12 to 20 January. The magnetic helicity of AR 10720 is negative, as derived by Zhang (2007), who estimated that between 12 and 18 Jan-uary a total of −2×1043 Mx2 of magnetic helicity was in-jected into the region because of the emergence of the highly sheared bipole near the main polarity inversion line.
As in the previous case, information on solar and inter-planetary characteristics of these events is grouped in Ta-ble 1.
3.2 Interplanetary observations
A shock arrived at ACE at ∼18:00 UT on 21 January, a couple of hours after an ICME with magnetic cloud
characteristics was observed in the data (Fig. 12). The mag-netic field observations point towards a glancing encounter with a side of the cloud, that is the reason why the rotation is not pronounced. The decreasing velocity profile (there is more than 100 km s−1difference between the start and end of the cloud) tell us that the cloud was clearly expanding. The plasma signatures show a low plasma beta, decreased proton temperatures and high oxygen charge states in the cloud.
Considering that Ulysses was at 5.3 AU, 17◦south of the ecliptic and 29◦west of the Earth in longitude (Fig. 13), the travel time derived from the solar wind speed of the MC (close to 800 km s−1at the front) that arrives on 30 January, is consistent with the eruption time of the solar events dis-cussed in the previous section. The same event was stud-ied, using interplanetary scintillation (IPS) and SMEI data by Jackson et al. (2005). The signatures of a MC start around 16:00 UT on that day and continue until 20:00 UT, 4 February (DOY 35, Fig. 14). The larger size of the cloud (∼0.7 AU) at Ulysses, compared to the ∼0.4 AU at ACE, is consistent with the radial expansion of the cloud. The signa-tures are clear: low plasma beta, extremely high charge states (the oxygen freezing-in temperature reaches values above 4 MK), the alpha to proton density ratio increases markedly (and continues to increase beyond the borders of the cloud), the magnetic field rotates smoothly and has a small variance. On 26 January, there was a shock present in the data (not shown in the figure), marking the close arrival of a big dis-turbance at Ulysses.
Even though Ulysses was not far from the Sun-Earth direc-tion, the magnetic field and plasma profiles were quite differ-ent at both spacecraft. Using the magnetic field observations at Ulysses, we applied first a minimum variance analysis (MVA, Sonnerup and Cahill, 1967) obtaining a theta of 54◦ and phi 320◦for the axis of the MC. By applying the MVA, the direction corresponding to the minimum, intermediate and maximum variance of the magnetic field components can be obtained (e.g. Bothmer and Schwenn, 1998). The direc-tion of intermediate variance corresponds to the axis of the flux rope, in the ideal case that the spacecraft is passing right through the axis of the cloud. Any deviation from this ideal case (the spacecraft not going directly through the cloud axis) would increase the errors in the results (e.g. Gulisano et al., 20071). From the Hidalgo et al. (2002b) model, a similar theta (33◦), but a different phi was obtained (131◦). The discrepancies in the phi angle could be the consequence of a large impact parameter (minimum distance between the cloud’s axis and the spacecraft’s path through the MC). The chirality of the cloud was found to be sinistral at both space-craft, in agreement with the sign derived from the solar ob-servations. The fit to the Hidalgo et al. (2002b) model is
1Gulisano, A. M., Dasso, S., Mandrini, C. H., and D´emoulin, P.:
Estimation of the bias of the minimum variance technique in the de-termination of magnetic clouds global magnitudes and orientation, Adv. Space Res., submitted, 2007.
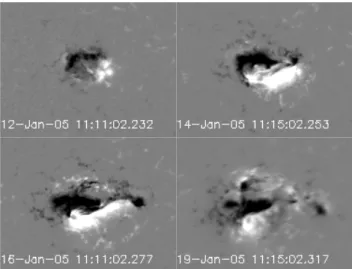
Fig. 11. MDI images showing the evolution of the magnetic con-figuration of AR 10720. The images have been derotated to central meridian passages (CMP). The FOV is 319×207 pixels (each pixel is 1.98 arcsec size) and the field is saturated below (above) −800 G (800 G).
shown in Fig. 15. The plasma data also show differences be-tween the two locations. It is clear that the MC was sampled at different parts by the two spacecraft. Foullon et al. (2007) analyzed this cloud at 1 AU using different techniques and concluded that the core of the cloud is located north of the ecliptic and west of the Sun-Earth direction. This is consis-tent with the cloud expanding on its cruise to 5 AU where it was sampled by Ulysses, located south of the ecliptic plane and west of the Sun-Earth direction. The same authors con-cluded that the most probable direction of the cloud axis at 1 AU would be nearly perpendicular to the ecliptic, with theta
∼90◦. Nevertheless, no model could be successfully applied to fit the magnetic field data correctly. We therefore consider another possibility that could produce similar observations: namely the possibility that the axis has a horizontal orienta-tion, almost parallel to the spacecraft path. In this case the spacecraft would sample the “leg” of the cloud at 1 AU. Mag-netic field observations at 1 AU are not conclusive; they are simply consistent with both scenarios: In the first scenario, ACE observed the edge (with a very large impact parameter) of a very large flux rope whose axis was nearly perpendic-ular to the ecliptic. Thus, the observed magnetic field vec-tor, B, is almost parallel to the X axis in GSE coordinates since ACE observed B∼Bϕ, which is tangential to the
az-imuthal magnetic field component close to the cloud bound-ary. In the second scenario, ACE observed the leg of a not so large flux rope whose axis was close to the Earth-Sun di-rection, lying in the ecliptic with its field pointing during all the observations along its axis, so, a flat axial component of the magnetic field and negligible azimuthal field even at the cloud boundaries. This corresponds to a distorted magnetic structure when compared to those typically observed. In this
Fig. 12. ACE observations of the events in January 2005. The first vertical line marks the arrival of a shock. The shaded region shows a MC.
second scenario, ACE crosses the flux rope close to its axis (a low impact parameter), so B is expected to be almost parallel to X in GSE.
We can estimate the average magnetic field intensity from observations as B∼1 nT and the size of the cloud transverse to Ulysses trajectory as 2 AU (from its duration and an
aver-age velocity of ∼700 km s−1). We can use these two values, assuming a negligible impact parameter, to compute the mag-netic helicity content in the cloud using Lundquist’s model (see e.g. Lepping et al., 1990, for the equations of the mag-netic field components for this model). Taking: B0=1 nT,
length is ∼−3.6×1042Mx2AU−1(for expressions of helic-ity see Dasso et al., 2003). Recalling that the total magnetic helicity input by shearing motions in AR 10720 is −2×1043 Mx2 and assuming that this amount was ejected by each of the 4 halo CMEs that originated in the AR during the pe-riod of helicity injection (Zhang, 2007), we can deduce, as a crude approximation, a length of ∼1 AU for the cloud when observed by Ulysses. This comparison only shows that our helicity computation is consistent with the solar estimates.
There is a second possibility to consider at Ulysses. Close to the middle of the cloud, there is a clear discontinuity in magnetic field and plasma data. This could be considered as a point to place the end of the cloud. We have repeated the calculations for this short period (extending up to 17:00 on 1 February, DOY 32; marked with a vertical line in Fig. 14). From the MVA we obtain axis angles of theta 13◦and phi 330◦, with sinistral chirality as it was obtained for the previ-ous interval. From the helicity calculations, and assuming a null closest approach distance between Ulysses and the MC axis, we obtained a value of −1.4×1040Mx2AU−1, which is much lower than for the previous estimate (mainly because of the small MC size considered in this case) and further away from the values obtained at the Sun. We tend to believe that the rotation continues after this discontinuity and the marked decrease in the field magnitude can be explained as a result of the high expansion that the cloud was undergoing. This signature, beyond the trailing edge of the small magnetic structure with high B, is consistent with the observation of a structure which originally was part of the rear of a previous larger closed flux rope, as discussed by Dasso et al. (2006, 2007) for two different MCs. In those cases (both analyzed only at 1 AU), these authors proposed that magnetic flux was removed from the cloud front in previous times because of magnetic reconnection between the MC front and its envi-ronment; however, magnetic flux at the rear was not removed and it still remained there. In our case, from the comparison of the observations at ACE and at Ulysses and considering the expansion via the relative velocity of the front and the back of the ICME, shaded region in Fig. 12 seems to cor-respond to the equivalent shaded region in Fig. 14 and not with the small time interval. This is in agreement with both points of view to interpret Ulysses observations: a large MC (Foullon et al., 2007, who also studied this event at Ulysses, find approximately the same interval as the one shown in the shaded area of Fig. 14) or a small MC plus the expanding back region.
4 Summary and conclusions
We have analyzed two very active periods at the Sun and their consequences in the heliosphere. Remote sensing data from 1 AU and in-situ observations at the L1 point and at Ulysses orbit were used for the study.
Fig. 13. Relative position of Ulysses and the Earth (ACE) for the events in January 2005.
The first period took place in November 2001, during so-lar maximum when Ulysses was located above the northern solar pole. There are three clear events on the Sun, one oc-curring on day 21 and two more the day after with a small separation in time. The first and the third events originate from the same active region. The third one is associated with the eruption of a vertical sinistral filament. In inter-planetary space we identified three different periods at each spacecraft. The most prominent one is a MC that we be-lieve to be associated with the eruption of a filament whose orientation and chirality deduced at the Sun are in agreement with these parameters deduced from observations at the ACE and Ulysses spacecraft. It appears as a highly inclined cloud which ACE was seeing close to its nose and Ulysses was sampling through its uppermost flank. Both spacecraft ob-served a shock preceding the MC. Within the sheath follow-ing the shock there appears to be a region, lastfollow-ing only a few hours, which belongs to a structure with characteristics dif-ferent from those corresponding to a normal sheath. We be-lieve that this might be the manifestation of the first CME that left the Sun on 21 November (DOY 325) and was being overtaken by the CME (that later appeared in the in-situ data as a MC) which left the Sun the day after. The difference in velocity favors this explanation. The third period that we can differentiate is the one coming right after the MC, where observations of BDE (bidirectional suprathermal electrons)
Fig. 14. Ulysses observations of a MC (shaded area) in January 2005. The vertical line marks the end of the smaller cloud considered as a second possibility in Sect. 3.2.
cover the full period. This seems to be the result of the two events occurring at the Sun on 22 November (DOY 326), interacting in interplanetary space and showing a first part which presents a magnetic field rotation and other character-istics typical of a MC, and a second part resembling an ICME but apparently without cloud structure.
The second period occurs during the decaying phase of solar activity, in January 2005. There were two CMEs leav-ing the Sun on days 19 and 20 comleav-ing from the same active region. The possibility that they interact in interplanetary space is high. There is no obvious filament disappearance but the filaments that can be discerned are dextral. ACE and Ulysses see only one MC. The probability that the events
Fig. 15. The three components of the magnetic field at Ulysses for the event of January 2005. The fit of the Hidalgo et al. (2002b) model is overplotted in red.
have interacted is higher for Ulysses, since it was located further away from the Sun than ACE. The sign of the helicity as deduced from in-situ data corresponds with that seen on the Sun (both negative).
Both events produced geomagnetic storms upon their ar-rival to the Earth’s magnetosphere. The results from the anal-ysis that makes use of different models to reproduce the Dst index are the subject of an upcoming paper.
It is remarkable to see that, when Ulysses and ACE were almost radially aligned (January 2005), the resemblance be-tween the signatures detected by both spacecraft is lower than when they had almost a 90◦ separation in latitude (Novem-ber 2001). For the former case, Ulysses was at 5 AU and for the latter at 2 AU. This fact speaks about how much the inter-action of the transient structures in interplanetary space can affect their structure. Regarding expansion, it can be seen that when Ulysses was at 2 AU, the size of the main structure is approximately the double of that corresponding in ACE data. For the other case, Ulysses is at 5 AU and the main part of the event has expanded around 5 times (these values can be easily checked from Table 1). Moreover, the rela-tionship between the orientations of the November MC axis obtained from the fitting of interplanetary data at locations widely separated in latitude provides valuable information to the understanding of 3-D flux rope scenarios.
Acknowledgements. The present study was developed in the frame of the “International Teams” program from the International Space Science Institute (ISSI) in Bern, Switzerland, the authors thank this institution for the great support provided during the course of this work. L. Rodriguez and A. N. Zhukov acknowledge sup-port from the Belgian Federal Science Policy Office through the ESA-PRODEX programme. C. Cid acknowledges the support from the Cost 274 project. C. H. Mandrini and S. Dasso thank grants: UBACyT X329, PIP 6220 (CONICET) and PICTs 03-12187 and 03-14163 (ANPCyT). C. H. Mandrini and S. Dasso are members of the Carrera del Investigador Cient´ıfico, CONICET. A. Aran acknowledges the financial support of the Spanish Ministe-rio de Educacion y Ciencia under the project AYA2004-03022. We are grateful to the ACE/SWEPAM, ACE/MAG, Ulysses/SWICS, Ulysses/Swoops (specially D. McComas and R. Skoug for pro-viding access to the electron pitch angle data) and Ulysses/VHM-FGM teams, for the data used for this work. The CME catalog is generated and maintained at the CDAW Data Center by NASA and The Catholic University of America in cooperation with the Naval Research Laboratory. The wavelet processed LASCO im-ages have been enhanced using a technique developed by G. Sten-borg. EIT, LASCO and MDI data are a courtesy of SOHO/EIT, SOHO/LASCO and SOHO/MDI consortiums SOHO is a project of international cooperation between ESA and NASA.
Topical Editor R. Forsyth thanks Z. Smith and another anony-mous referee for their help in evaluating this paper.
References
Berger, M. A.: Rigorous new limits on magnetic helicity dissipation in the solar corona, Geophys. Astrophys. Fluid Dynam., 30, 79– 104, 1984.
Bothmer, V. and Schwenn, R.: The structure and origin of magnetic clouds in the solar wind, Ann. Geophys., 16, 1–24, 1998, http://www.ann-geophys.net/16/1/1998/.
Brueckner, G. E., Howard, R. A., Koomen, M. J., Korendyke, C. M., Michels, D. J., Moses, J. D., Socker, D. G., Dere, K. P., Lamy, P. L., Llebaria, A., Bout, M. V., Schwenn, R., Simnett, G. M., Bedford, D. K., and Eyles, C. J.: The Large Angle Spectroscopic Coronagraph (LASCO), Sol. Phys., 162, 357–402, 1995. Burlaga, L. F. E.: Magnetic Clouds, in: Physics of the Inner
He-liosphere II, edited by: Schwenn, R. and Marsch, E., Springer-Verlag, Berlin, 1991.
Burlaga, L. F., Plunkett, S. P., and St. Cyr, O. C.: Successive CMEs and complex ejecta, J. Geophys. Res., 107, A10, SSH 1-1, doi:10.1029/2001JA000255, 2002.
Cremades, H. and Bothmer, V.: On the three-dimensional configu-ration of coronal mass ejections, Astron. Astrophys., 422, 307– 322, 2004.
Dasso, S., Mandrini, C. H., D´emoulin, P., and Farrugia, C. J.: Magnetic helicity analysis of an interplanetary twisted flux tube, J. Geophys. Res., 108(A10), 1362, doi:10.1029/2003JA009942, 2003.
Dasso, S., Mandrini, C. H., D´emoulin, P., Luoni, M. L., and Gulisano, A. M.: Large scale MHD properties of in-terplanetary magnetic clouds, Adv. Space Res., 35, 711, doi:10.1016/j.asr.2005.02.096, 2005.
Dasso, S., Mandrini, C. H., D´emoulin, P., and Luoni, M. L.: A new model independent method to compute magnetic helicity in
mag-for the SOHO Mission, Solar Phys., 162, 291–312, 1995, Domingo, V., Fleck, B., and Poland, A. I.: The SOHO Mission: an
Overview, Solar Phys., 162, 1–37, 1995.
Foullon, C., Owen, C. J., Dasso, S., Green, L. M., Dandouras, I., Elliot, H. A., Fazakerley, A. N., Bogdanova, Y. V., and Crooker, N. U.: Multi-spacecraft study of the January 21st 2005 ICME. Evidence of current sheet substructure near the periphery of a strongly expanding, fast, magnetic cloud, Solar Phys., in press, 2007.
Goldstein, H.: On the field configuration in magnetic clouds, in: Solar Wind Five, NASA Conf. Publ., CP-2280, 731, 1983. Gopalswamy, N., Yashiro, S., Lara, A., Kaiser, M. L.,
Thomp-son, B. J., Gallagher, P. T., and Howard, R. A.: Large solar ener-getic particle events of cycle 23: A global view, Geophys. Res. Lett., 30, 12, doi:10.1029/2002GL016435, 2003.
Henke, T., Woch, J., Mall, U., Livi, S., Wilken, B., Schwenn, R., Gloecker, G., von Steiger, R., Forsyth, R. J., and Balogh, A.: Differences in the O+7/O+6 ratio of magnetic cloud and non-cloud coronal mass ejections, Geophys. Res. Lett., 25, 3465– 3468, 1998.
Hidalgo, M. A., Cid, C., Vinas, A. F., and Sequeiros, J.: A non-force-free approach to the topology of magnetic clouds in the solar wind, J. Geophys. Res., 107(A1), SSH 1-1, 1002, doi:10.1029/2001JA900100, 2002a.
Hidalgo, M. A., Nieves-Chinchilla, T., Cid, C.: Elliptical cross-section model for the magnetic topology of magnetic clouds, Geophys. Res. Lett., 29, 13, 15-1, doi:10.1029/2001GL013875, 2002b.
Hu, Q. and Sonnerup, B. U. ¨O.: Reconstruction of magnetic flux ropes in the solar wind, Geophys. Res. Lett., 28(3), 467–470, 2001.
Hu, Q. and Dasgupta, B.: Calculation of magnetic helicity of cylindrical flux ropes, Geophys. Res. Lett. 32, L12209, doi:10.1029/2005GL023004, 2005.
Hundhausen, A. J., Gilbert, H. E., Bame, S. J.: Ionization state of the interplanetary plasma, J. Geophys. Res., 73, 5485–5496, 1968.
Jackson, B. V., Buffington, A., Hick, P. P., Yu, Y., and Webb, D.: Solar Mass Ejection Imager (SMEI) Solar Wind 3-D Analysis of the January 20, 2005 CME, American Geophysical Union, Fall Meeting 2005, abstract #SH21A-02, 2005.
Lario, D., Decker, R. B., Roelof, E. C., Reisenfeld, D. B., and Sanderson, T. R.: Low-energy particle response to CMEs during the Ulysses solar maximum northern polar passage, J. Geophys. Res., 109, A01107, doi:10.1029/2003JA010071, 2004.
Lepping, R. P., Burlaga, L. F., and Jones, J. A.: Magnetic field struc-ture of interplanetary magnetic clouds at 1 AU, J. Geophys. Res.,
tiochos, S. K.: Solar-cycle dependent helicity transport by magnetic clouds, J. Geophys. Res., 110(A8), A08107, doi:10.1029/2005JA011137, 2005.
Mandrini, C. H., D´emoulin, P., van Driel-Gesztelyi, L., and L´opez Fuentes, M. C.: Magnetic Helicity Budget of Solar-Active Regions from the Photosphere to Magnetic Clouds, Astrophys. Space Sci., 290(3), 319–344, 2004.
Mandrini, C. H., Pohjolainen, S., Dasso, S., Green, L. M., D´emoulin, P., van Driel-Gesztelyi, L., Copperwheat, C., and Foley, C.: The smallest magnetic cloud source-region ever observed, Astron. Astrophys., 434(2), 725, doi:10.1051/0004-6361:20041079, 2005.
Mulligan, T., Russell, C. T., Anderson, B. J., and Acuna, M. H.: Multiple spacecraft flux rope modeling of the Bastille Day mag-netic cloud, Geophys. Res. Lett., 28(23), 4417–4420, 2001. Osherovich, V. A., Farrugia, C. J., and Burlaga, L. F.: Dynamics of
aging magnetic clouds, Adv. Space Res., 13(6), 57–62, 1993. Pevtsov, A. A. and Balasubramanian, K. S.: Helicity patterns on the
Sun, Adv. Space Res., 32(10), 1867–1874, 2003.
Reisenfeld, D. B., Gosling, J. T., Forsyth, R. J., Riley, P., and St. Cyr, O. C.: Properties of high-latitude CME-driven distur-bances during Ulysses second northern polar passage, Geophys. Res. Lett., 30, 19, ULY 5-1, doi:10.1029/2003GL017155, 2003. Richardson, I. G. and Cane, H. V.: Identification of interplanetary coronal mass ejections at 1 AU using multiple solar wind plasma composition anomalies, J. Geophys. Res., 109(A9), A09104, doi:10.1029/2004JA010598, 2004.
Rodriguez, L., Woch, J., Krupp, N., Fr¨anz, M., von Steiger, R., Forsyth, R. J., Reisenfeld, D. B., and Glaßmeier, K.-H.: A statis-tical study of oxygen freezing-in temperature and energetic par-ticles inside magnetic clouds observed by Ulysses, J. Geophys. Res., 109, A01108, doi:10.1029/2003JA010156, 2004.
Rodriguez, L., Woch, J., Krupp, N., Fr¨anz, M., von Steiger, R., Cid, C., Forsyth, R., and Glaßmeier, K.-H.: Bidirectional proton flows and comparison of freezing-in temperatures in ICMEs and mag-netic clouds, Proc. IAU Symposium 226 on Coronal and Stellar Mass Ejections, Beijing, China, 2005.
Rust, D. M.: Spawning and shedding helical magnetic fields in the solar atmosphere, Geophys. Res. Lett., 21, 241–244, 1994. Sonnerup, B. O. and Cahill, L. J.: Magnetopause Structure and
Atti-tude from Explorer 12 Observations, J. Geophys. Res., 72, 171– 183, 1967.
Vandas, M. and Romashets, E. P.: A force-free field with constant alpha in an oblate cylinder: A generalization of the Lundquist solution, Astron. Astrophys., 398, 801, doi:10.1051/0004-6361:20021691, 2003.
Lar-son, D. E., Martin, S. F., Plunkett, S. P., and Rust, D. M.: The origin and development of the May 1997 magnetic cloud, J. Geo-phys. Res., 105(A12), 27 251–27 260, 2000.
Zhang, M. and Golub, L.: The Dynamical Morphologies of Flares Associated with the Two Types of Solar Coronal Mass Ejections, Astrophys. J., 595(2), 1251–1258, 2003.
Zhang, H.: Observational Study of Solar Magnetic Active Phenom-ena, in: ASP Conference Series, 6th SolarB meeting, 2007.
Zhao, M. and Wang, J.: Nonpotentiality and energy transport in NOAA AR 10720, Solar activity and its magnetic origin, Proc. IAU Symp. No. 233, edited by: Bothmer, V. and Hady, A. A., p. 41–44, 2006.
Zhukov, A. N.: Solar Sources of Geoeffective CMEs: a SOHO/EIT View, in: Coronal and Stellar Mass Ejections, IAU Symposium Proceedings of the International Astronomical Union 226, edited by: Dere, K., Wang, J., and Yan, Y., Cambridge: Cambridge University Press, 437–447, 2005.