Economics of End-of-Life Materials Recovery
-
A Study of
Small Appliances and Computer Devices in Portugal
by
Patrick Ford
B.S. Environmental Engineering, Worcester Polytechnic Institute (2013)
Submitted to the Institute for Data, Systems, and Society in partial fulfillment of
the requirements for the degree of
MASSACHUSETTS INSTITUTE
Master of Science in Technology and Policy
OF TECHNOLOGY
at the
MASSACHUSETTS INSTITUTE OF TECHNOLOGY
I
I
June 2016
LIBRARIES
ARCHIVES
Massachusetts Institute of Technology 2016. All rights reserved.
Author...Signature
redacted
Institute for Data, Systems, and Society
Signature redacted
6 May 2016
C ertified by...
...
Elsa Olivetti
Thomas Lord Assistant Professor of Materials Science and Engineering
Thesis Advisor
Certified
C
Signature
C ertified .
redacted...
..
.... ...
h
ei.Adso
(U
Krystyn J. Van Vliet
Asso cate Professor f M
ials Science and Engineering and Biological
Engineering
Thesis Advisor
Accepted by...Signature
...
Munther Dahleh
William A. Coolidge Professor of Electrical Engineering and Computer Science
Acting Director, Technology and Policy Program
Director, Institute for Data, Systems, and Society
Economics of End-of-Life Materials Recovery
-
A Study of
Small Appliances and Computer Devices in Portugal
by
Patrick Ford
Submitted to the Institute for Data, Systems, and Society
on May 6, 2016 in Partial Fulfillment of the
Requirements for the Degree of Master of Science in
Technology and Policy
ABSTRACT
The challenges brought on by the increasing complexity of electronic products, and the criticality
of the materials these devices contain, present an opportunity for maximizing the economic and
societal benefits derived from recovery and recycling. Small appliances and computer devices
(SACD), including mobile phones, contain significant amounts of precious metals including gold
and platinum, the present value of which should serve as a key economic driver for many
recycling decisions. However, a detailed analysis is required to estimate the economic value that
is unrealized by incomplete recovery of these and other materials, and to ascertain how such
value could be reinvested to improve recovery processes. I present a dynamic product flow
analysis (dPFA) for SACD throughout Portugal, a European Union member, including annual
data detailing product sales and industrial-scale preprocessing data for recovery of specific
materials from devices. I employ preprocessing facility and metals pricing data to identify losses,
and develop an economic framework around the value of recycling including uncertainty. I show
that significant economic losses occur during preprocessing (over $70M USD unrecovered in
computers and mobile phones, 2006-2014) due to operations that fail to target high value
materials, and characterize preprocessing operations according to material recovery and total
costs. Finally, I present market level, operational, and policy recommendations aimed at
capturing the unrecovered economic value identified in the Portuguese WEEE recycling system.
Thesis Advisor: Elsa Olivetti
Title: Thomas Lord Assistant Professor of Materials Science and Engineering
Thesis Advisor: Krystyn J. Van Vliet
Title: Associate Professor of Materials Science and Engineering and Biological Engineering
Acknowledgements
This work was made possible by the generous support of the Government of Portugal through the Portuguese Foundation for International Cooperation in Science, Technology, and Higher Education, and was undertaken in the MIT Portugal Program. Professor Paulo Ferrdo of IST in Lisbon provided key leadership in the organization and scoping of this work. Professor Fernanda Margarido of IST in Lisbon not only helped to scope the work, but also put significant effort into the shredding of mobile phones for the materials characterization portion of this project. Dr. Eduardo Santos from 3DRIVERS was instrumental to the success of this work from beginning to end, helping me to analyze the preprocessing data that he had collected as a part of his PhD, and acting as mentor and collaborator throughout.
I would also like to thank several individuals who assisted with various portions of this project
over the past two years. T. Reed Miller, a Research Specialist at MIT, was central to the development of the dynamic product flow analysis. Jae Hyun Kim, an undergraduate at MIT in Course 3, performed the SEM/EDS work for the materials characterization portion of this project. Several employees at ALS Environmental in Tucson, AZ performed the ICP-OES analysis and were responsive and helpful throughout the project.
I would like to say a special thank you to several of the groups and organizations that helped to
make my time at MIT an even more memorable experience, including the MIT Technology and Policy Program, the MIT Sloan Sustainability Initiative, and the Ellen MacArthur Foundation. To my advisors, Professor Elsa Olivetti and Professor Krystyn Van Vliet, thank you for giving me the opportunity to take on this project and the flexibility to make it my own. I am also grateful to each of the group members from the Olivetti Group and the Van Vliet Lab for providing your insights and critiques throughout this project.
Lastly, but certainly not least, I would like to say thank you to all of my friends and family who have supported me throughout my time at MIT, especially my brother, my parents, and my wife, who has been my rock throughout this process.
Contents
C hapter 1: Introduction ... 11 1.1. M otivation... 11 1.2. Research Q uestions... 12 1.3. O verview ... 13 C hapter 2: Background... 142.1. Urban M ine Characterization... 14
2.2. Product and M aterial Flow s... 15
2.3. Recycling System A rchitecture and Perform ance ... 16
2.4. W EEE D irective ... 19
2.5. Battery D irective... 19
2.6. Producer Responsibility Organizations ... 20
2.6.1. A m b3E ... 23
2.6.2. ERP Portugal... 26
2.7. Sum m ary and O utlook... 28
Chapter 3: Characterizing Portuguese Recycling System Losses ... 30
3.1. D ynam ic Product Flow Analysis M ethods... 30
3.1. 1. Sales ... 31
3.1.2. G eneration... 32
3.1.3. Collection... 33
3.1.4. Preprocessing Operations... 34
3.1.5. Preprocessing Costs ... 36
3.1.6. Characterizing the Composition of the Waste Stream... 37
3.1.7. Calculating the Econom ic Value of Preprocessing... 37
3.2. Calculation of Uncertainty... 38
3.3. D ynam ic Product Flow Analysis Results ... 39
3.3.1. M aterial M ass Losses... 39
3.3.2. M aterial Value Losses... 41
3.4. Informing Future Investments ... 44
3.5. Summary and Outlook... 47
Chapter 4: Improved Mobile Phone Material Characterization ... 49
4.1. D ism antling... 50
4.2. PCB to Total Mass Ratio ... 50
4.3. Scanning Electron Microscopy/Energy Dispersive Spectroscopy (SEM/EDS)... 51
4.4. Inductively Coupled Plasma - Optical Emission Spectroscopy ... 52
4.5. Summary and Outlook... 54
Chapter 5: Improving the WEEE Recovery System ... 56
5.1. Amb3E Collaboration Framework... 56
5.1.1. Secondary Materials Supply and Demand... 56
5.1.2. Incorporating Environmental Footprint into Eco-Value... 57
5.1.3. Technological and Operational Best Practices ... 63
5.2. Mass Versus Value Based Metrics ... 66
5.3. European Commission Circular Economy Strategy ... 68
Chapter 6: Conclusions ... ... 70
Appendix A. Dynamic Product Flow Analysis Manual... 73
Appendix B. WEEE Subcategories ... 77
Appendix C. Material Composition Data for Product Groups 1- 5... 81
Appendix D. Summary of Mobile Phones Analyzed ... 89
Appendix E. SEM/EDS Results ... 91
Appendix F. ICP-OES Results... 107
Appendix G. Proposal Letter for Amb3E Collaboration... 111
117 Appendix H. Product Categories Used in WEEELABEX Documentation... 113
Bibliography ... 119
List of Figures
Figure 1. Average ranges of the mass and economic value of the target metals embedded in a
smartphone sold in Germany in 2012 (Figure reproduced from Chancerel et al. 2015). ... 15
Figure 2. Recommended recycling routes for information and communications technology (ICT)
and consumer equipment (CE) (Figure reproduced from Chancerel et al. 2015) . ... 18
Figure 3. Overview of Portuguese WEEE recycling network (Adapted and reproduced from Santos 2013)3-... 21 Figure 4. Number of producers reporting EEE put on the market to Amb3E (Adapted from Amb3E Relatorio de Actividades 201444) ... 24 Figure 5. Tonnes of EEE declared to Amb3E by producers (Adapted from Amb3E Relatorio de A ctividades 201444) ... 25
Figure 6. Thousands of Units declared to Amb3E by producers (Adapted from Amb3E Relatorio de A ctividades 201444)... 25
Figure 7. Number of producers reporting EEE (2006) and EEE and batteries and accumulators (2010 and 2014) put on the market to ERP Portugal (Adapted from 10 Years Promoting
Competition in the Waste's Sector5 6)... 27
Figure 8. Number of ERP Portugal collection points (Note: Value for 2010 is approximate)
(Adapted from 10 Years Promoting Competition in the Waste's Sector 5 6
) ... 27
Figure 9. Breakdown of WEEE management expenses for ERP Portugal (Adapted from Relatorio Anual de Actividades 201345)... 28
Figure 10. Schematic of overall model methodology... 30
Figure 11. Mass of computers sold in 2005 that is generated until 2014 (primary axis) and the cumulative mass of computers generated over the same time period (secondary axis)... 33 Figure 12. Generalized process schematics for three preprocessing facilities within the Portuguese WEEE recycling infrastructure, focusing on the recovery of other metals... 36 Figure 13. Mass of gold from computers at the generation, collection, and preprocessing stages of recycling in Portugal over time. Arrows represent the materials losses incurred from inefficiencies during collection and preprocessing. All values for mass are derived from the material composition data in the dPFA, and shading represents qualitative uncertainty... 40 Figure 14. (a) Total market value of materials recovered during preprocessing by product group in 2010 USD across 16 preprocessing plants within Portugal (b) Total potential market
value not recovered by product group from 2006 - 2014 and the metals impacting the economic losses (Error bars represent one standard deviation). The values for computers and mobile phones are plotted on the primary y-axis, and the values for printers are plotted on the secondary y-axis... 43 Figure 15. Total 2010 USD lost per tonne of each product group that was preprocessed from
2006 -2014 (Error bars represent one standard deviation)... 44 Figure 16. Normalized process and material data showing the tradeoffs between recovery percentages, costs, material values, and tonnes preprocessed ... 46 Figure 17. Dismantled mobile phones from batches 1, 2, and 3 (a. Motorola V325i H/W, 2005; b.
Samsung SGH-A777, 2008; c. LG VX9200M, 2009)... 50
Figure 18. PCBs shredded and analyzed utilizing ICP-OES ... 53
Figure 19. Example thresholds for determining an acceptable dismantling time for electronic displays (Figure Reproduced from Ardente et al.90)... 59
Figure 20. Examples of product measures related to various product policies (Figure Reproduced from Ardente and M athieux, 2014) ... 60
Figure 21. WEEE Forum Temporary Limit Values for Benchmarks (Figure Reproduced from WEEELABEX Documentation to Measure Depollution' 17)... 66
Figure 22. Comparison of material mass recovered versus material value recovered during preprocessing for all product groups as calculated in the recycling system dPFA... 67
List of Tables
Table 1. Assumed mean lifespans of devices within the five product groups7,2 3,67,68... .. . . 32
Table 2. Collection rates over time (Coefficient of variation: CV = 0.10 for 2006 -2013 and CV = 0.20 for 20 14)... 34
Table 3. Inflation adjusted prices for materials included in analysis... 38
Table 4. PCB mass to total device mass for each product category ... 51
Table 5. Summary of the Results of the ICP-OES Analysis of Mobile Phone PCBs... 54
Table 6. Summary of Eco-Values in Dispatch No. 2103/20152... 58
Table 7. Summary of EU Ecolabel Criteria for Electronics ... 61
Chapter 1: Introduction
Portions of this chapter are based on a 2016 publication by Ford et al. in Environmental Science
& Technology, titled Economics of End-of-Life Materials Recovery - A Study of Small
Appliances and Computer Devices in Portugal.
1.1. Motivation
The consumer electronics industry has seen increased adoption rates, device diversification and decreased product lifetimes all resulting in significant product proliferation. Effective disposal of these devices, or management of Waste Electrical and Electronic Equipment (WEEE), has long been a focus of environmental management policy, due primarily to concerns around human
health and ecosystem impact.2 More recently, high demand for, and fluctuating supplies of,
metals within such devices, the mining and primary processing of which includes additional
environmental and geopolitical impact,6 has renewed interest in the overall flow of these devices
at end-of-life. These ongoing efforts aim to discover where materials come to rest within the so-called "urban mine", and to quantify how the embedded value in particular electronic products might drive material recovery.
Despite the potential value present within these devices, collection rates for products and materials recovery remains low. Limited materials recovery stems primarily from the lack of actionable information within the recovery network. Simply put, it is often not clear a priori
whether the recovery of existing materials from used electronic devices is economically competitive with procurement of "new" materials. The composition of the generated waste stream is dynamic and offset in time and geographic location from the sale of the device, such that the available materials for recovery are not considered at the point of recycling system design. More specifically, there are several processes upstream of the actual metal recovery and refinement processes (generally termed preprocessing), which dictate final process yields and resulting value.0, 1 These combined factors can result in scenarios that are intended to promote
effective recycling - e.g., legislated recovery targets, grouping of printed circuit board (PCB)
levels upon collection, and recovery facility design - that do not align well with maximizing the value recovered. Even when the amounts and locations of materials within devices are known, it
may not be clear whether and to whom the recycling of such materials at end-of-life presents value.1 2
In the European Union (EU), an extended producer responsibility scheme has been implemented for WEEE in an attempt to meet the previously mentioned legal recovery targets. However, a lack of granularity with regard to the evolving composition of devices over time, the increase in the supply of secondary materials generated by recovery targets without a clear understanding of the downstream demand, and the inefficient recovery of potentially valuable and/or critical
materials has led to a misaligned optimization of the recycling system around mass based, rather than value based metrics.
1.2. Research
Questions
The economic and material losses incurred in recycling as a result of inefficient operational schemes and a lack of granular materials characterization data at the preprocessing level has led to the following research questions:
* Can the economics of the recycling of small appliances and computer devices drive increased materials recovery?
* What market level and operational dynamics must be leveraged to capture the value of small appliances and computer devices at the end-of-life given material composition information?
Through dynamic product and material flow analysis, coupled with detailed case data for preprocessing facility performance, this work establishes an economic framework for the value of recycling. Here I focus on the country of Portugal as a data-rich and well-defined recovery network that employs advanced technologies within its facilities, and consider the system from the point of sale to the preprocessing step for a subset of products termed small appliances and computer devices (SACD). This categorization is my own term. It is consistent with the classification of recovery data collected in Portugal that includes small consumer products and industrial equipment that share electronic components including PCBs, and to exclude large products (including large household appliances and photovoltaic panels). By considering the perspective of the preprocessor facilities within a particular country, I identify losses in material recovery that could be reinvested in the system in that region. Even though a preprocessor does
12
not typically have visibility into the materials-level recovery potential, the decisions at this stage limit maximum efficiency of downstream recovery and refinement steps that define the secondary materials market.
1.3.
Overview
This thesis will be organized into the following sections:
- Background information on product and material flows, including the Portuguese
framework within which this work will focus
- A characterization of the Portuguese WEEE recycling system through the use of a
dynamic product flow analysis (dPFA)
- An analysis of potential methodologies and frameworks that could be utilized to leverage
the operational inefficiencies characterized in the dPFA to bring about system wide improvements
Chapter 2: Background
Portions of this chapter are based on a 2016 publication by Ford et al. in Environmental Science
& Technology, titled Economics of End-of-Life Materials Recovery - A Study of Small
Appliances and Computer Devices in Portugal.
2.1. Urban Mine Characterization
Understanding overall material and product flows within the current recycling infrastructure infonns criticality assessments, access to the urban mine, legislative compliance, and design for materials or product targeting. The foci of these studies have been twofold, to understand the composition and flow of products and materials in the urban mine, and to analyze the losses during the preprocessing and recovery stages of recycling. This section will focus on the urban mine, and the following two on the flows of materials and losses during preprocessing.
According to Georgiadis and Besiou, the total amount of WEEE to enter the urban mine was projected to rise by 16-28% annually."' Several studies have quantified the materials contained in a variety of electronic devices that make up the urban mine, including but not limited to computers,8' 14 phones,15 2 0 and printers.8 These studies formed the foundation of the material composition data used in the dPFA, however, there is still a need for a more detailed accounting of not only what is contained in the devices, but where the key materials are found within the devices. Detailed insights into which materials are found in which portion of the device, such as the speaker assembly in a mobile phone versus a PCB in a mobile phone, would allow preprocessors to more readily determine how to treat that product at the end-of-life, thereby
increasing the potential for decreased environmental impacts and increased economic recovery.
In 2015, Chancerel et al. examined the quantities of critical metals in consumer equipment, potential pathways for the removal of those metals, and the potential economic impacts of
recovery processes.2' The authors were consistent with other studies in identifying gold as the
economic driver of WEEE recycling. Additionally, a comparison between the mass and economic value contained in mobile phones was carried out, showing that, for the materials analyzed, cobalt had the greatest mass. Other materials analyzed included indium, gallium, light rare earth elements (REE), heavy REE, tantalum, tin, palladium, and silver. Figure I shows the
results of that analysis. This work was an important contribution in that the authors performed a
detailed accounting of the mass of a material versus its economic value, as seen in Figure 1.
Additionally, the types of materials analyzed include those that are known to be economically
advantageous to recover, such as gold, as well as those that are typically lost within the current
recycling system in the EU, such as light and heavy rare earth elements (REE). The analysis that
I performed, and will be expanded upon below, will take this a step further, defining the mass
and economic losses within a specific recycling system, and arguing for an optimization of the
system around economic recoveries rather than mass alone.
Smartphone
12 2.0 --Mass 10Economic value
15 100.5 w
20
0,0
Figure 1. Average ranges of the mass and economic value of the target metals embedded in a smartphone sold
in Germany in 2012 (Figure reproduced from Chancerel et al. 2015).21
2.2. Product and Material Flows
Material flow analysis (MFA) has been applied as a methodology for understanding a plethora of
complex material systems in the past. For the purposes of this work, I will refer to the analysis
completed as a product flow analysis (PFA) because the flow of materials throughout the
recycling supply chain is dependent on the flow of the products they are found in. Muller et al.
compiled a review of dynamic MFA methodologies in 2014, and used several terms to
characterize their overarching processes. The terms that are central to this work are: static versus
dynamic, top-down versus bottom-up, and prospective versus retrospective. This PFA is dynamic
because it captures an analysis over time, allowing me to observe trends in the data rather than a
single snapshot. This PFA represents a top-down approach because the stocks of materials found
within the system boundary at any given time are defined by the difference between the inflows
(i.e., product sales) and outflows (i.e., collection) from the system. Finally, this PFA is
retrospective because it involved the analysis of historical data in order to define the stocks and
flows within the system.
More specifically, this analysis is modeled after work completed by several researchers in the
areas of substance and material flows. Navazo et al. used a material flow analysis to study the
material and energy impacts of the recovery process for mobile phone materials.
23This research
provided insights into the composition of mobile phones, the use of manual dismantling and
mechanical shredding during preprocessing, and the importance of gold as the economic driver
of mobile phone recycling. Chancerel et al. used a substance flow analysis (SFA) to explore the
flow of precious metals through the preprocessing stage of recycling.
24, 25
A SFA is a specific
type of MFA, where elements are tracked within a given set of system boundaries. This research
provided insights into the importance of analyzing the preprocessing stage of recycling from a
granular materials level.
24Several other researchers have employed varying sets of tools, including system dynamics,
agent-based modeling, environmental impact assessments, and life cycle assessments to explore
the recycling system and its impacts.3,
13, 26-30Each of these studies was used to inform the
analysis carried out in this work, either through the types of devices and/or recycling processes
studied, or the methodology employed. The methodology that I followed in developing the dPFA
used in this work follows a similar overall structure to those found in the literature, but expands
upon what is available by using a robust data set focused on preprocessing to couple material
mass and economic flows, as explained in Chapter 3.
2.3.
Recycling System Architecture and Performance
Researchers have investigated system architecture and performance to assess key material losses,
legislative costs, and the environmental and economic health of the system. Meskers et al.
provided an overview of the recycling and recovery process for WEEE and batteries, which
included an analysis of which materials drive the economic argument for recycling, and the
barriers to improved best practices.
19Hageluken discussed the economic, environmental, and
resource recovery opportunities surrounding the processing of electronic waste, finding that
value-based metrics are needed to supplement the weight-based metrics specified in the WEEE
Directive. The author also addressed tradeoffs between manual and mechanical preprocessing,
and challenges such as material comingling and process capital costs.3 1
Two studies described earlier by Navazo and Chancerel were also instrumental in characterizing
the performance of recycling systems. In 2014, Navazo et al. detailed the material losses
experienced during the processing and recovery stages of electronic waste recycling.
23Although
the MFA was applied to the recycling process downstream of preprocessing, it was useful in
understanding the treatment steps that occur outside of the system boundary in Portugal. In 2009,
Chancerel et al. analyzed the flow of one tonne of information technology and
telecommunications equipment (WEEE category 3) through the preprocessing stages of
recycling, focusing on gold, silver, palladium and platinum. The authors provided examples for
the losses of precious metals at the pre-sorting, manual sorting and depollution, pre-shredding
and manual sorting, and shredding and automated sorting stages of preprocessing and
recommendations for system improvements.
24In the 2015 Chancerel et al. study researchers also recommended recycling options for various
types of products, as shown in Figure 2. In Figure 2, the left most set of boxes includes the types
of devices analyzed, which are similar to the categories used in my analysis. The main
exceptions are that they separate smartphones and other mobile phones, group mobile phones
with other small high-grade equipment, and include a category for LCD televisions with CCFL
and LED backlighting. The set of operations in the middle, labeled as "Pre-processing," include
the steps required to remove the components that the authors deem to be the most important.
Finally, the operations listed on the right, labeled "Recovery," include the downstream
operations that depend on the preprocessing step.
The analysis that I present here will focus on the preprocessing stage, and specifically the
removal of the PCBs. Therefore, I feel as though the authors should have included a "further
research required for this route" arrow going from the smartphones and mobile phones categories
to the "Removal of the PCB" step of preprocessing. Due to the need to remove the PCB and the
battery during the de-pollution stage of preprocessing, it may not be possible to send the entire device to downstream recovery operators without this step. Overall, the authors found that, using current technologies, the removal of certain materials, such as indium, gallium, rare earth elements (REE), and tantalum, was not yet economically favorable. However, they also identify the need for additional research to quantify the total potential mass of these materials that reaches the end-of-life in WEEE in order to lay the groundwork for increased materials recovery.
Pr-processming Recovry
Remayr Galliumaf
the gallium recovery or
containing component
-ICS rouse
Smartphowes - Recover
Remnova of of gold,
the PCs palladium,
Moeg phones ser and
and other smal rin
Nh-grade
equ cont s
Removal of
the Tantalum
Desktop hentg orym recoery
personad CapeCitots
coDp antrs
t-Laptops Removal at Cotalt
the battery recovery
LCD televlstonrs
with C'FL and RmvlD
LED -- Rmvla
backlighting Me REE- REE
containing recovery
magnets
Estatlished route emoval D
the Indlum- Idu
-+Furth@( research required for this rote containing -rec-o-veryIniu
display rcvr
Se g, MP3 playerm, poflat neuaullon system, doltel pholo camerw panels
Figure 2. Recommended recycling routes for information and communications technology (ICT) and consumer equipment (CE) (Figure reproduced from Chancerel et al. 2015).
Several other studies have analyzed the preprocessing stage of recycling and quantified key
material and economic losses .20, 32, 33 Further, impact assessments carried out by the United
Kingdom's Department for Business, Innovation, and Skills (BIS), in conjunction with others,
studied the economic costs and benefits of the most recent WEEE Directive, listing impacts for
businesses, government, and recyclers.34
2.4. WEEE Directive
The WEEE Directive was first established in 2003 (2002/96/EC), but was recast in 2012 as
2012/19/EU. This most recent version went into full effect in 2014 and was transposed in
Portugal through Decree-Law No. 67/2014.35 The overall goals of this directive are to minimize the mass of WEEE entering landfills each year, to protect environmental and human health, to increase the mass of commodity materials reused each year, and to hold producers responsible for the devices that they put on the market.34, 36 More specifically, the target collection rate of
end-of-life WEEE is 45% from 2016 - 2019 and 65% from 2019 going forward. The collection
rates are measured by mass, and not by numbers of devices or the economic value of a given
device. Downstream of collection, targets are also established for the recovery and recycling of
the waste materials. Recovery is defined as any operation in which waste serves "a useful purpose by replacing other materials which would otherwise have been used to fulfill a particular function." Recycling is defined as "any recovery operation by which waste materials are reprocessed into products, materials or substances whether for the original or other purposes."37 Starting in August 2015, recovery targets range from 75% to 85% and recycling targets range
from 55% to 80% depending on the category of waste in question.36 The recycling process can
vary by device and facility, but the directive mandates that printed circuit boards with surface areas greater than 10 square centimeters must be removed. However, this is only the case for "separately collected WEEE," which is defined as "collection where a waste stream is kept separately by type and nature so as to facilitate a specific treatment."' Although it was reported in 2008 that 65% of WEEE put on the market was collected separately, it is widely believed that much of this is still improperly handled downstream of the collection process.36 This can lead to large losses of the valuable materials detailed above, attributing to losses of capital and secondary resources, and negative environmental impacts.
2.5. Battery Directive
The Battery Directive (2006/66/EC) went into effect in 2008, and mandates that all batteries be removed from devices prior to being recycled. It also requires that all member states achieve a
collection rate of at least 45% by 26 September 2016. Further downstream of collection, this directive requires that recycling processes for lead-acid, nickel-cadmium, and other batteries and
accumulators recover 65%, 75%, and 50% by weight, respectively.38 These requirements have
been put in place to reduce the negative environmental impacts of materials within batteries, both in use and at end-of-life.'8 Batteries were not included in the PFA that I present in the sections that follow because of the additional steps required for their removal and safe treatment downstream. As downstream operators (beyond preprocessing) develop more effective and economical methods for recovering the key materials in batteries, it may be important for future work to include the incorporation of the flow of batteries within the PFA.
2.6. Producer Responsibility Organizations
The waste directives that have been established in the EU, including the WEEE and Battery Directives, laid the groundwork for the implementation of widespread extended producer responsibility (EPR) schemes. An overview of the EPR scheme for WEEE in Portugal can be found in Figure 3. In Figure 3, there are three major types of flows, mass flows, monetary flows, and information flows, as denoted by the arrows. The work presented in the sections that follow focused on the inefficiencies of the preprocessing plants and the opportunities for improvement that are inherent in the monetary and information flows between the preprocessing plants and the Producer Responsibility Organizations (PROs). Due to this, the mass flows to downstream operators that perform recycling, mass recovery, energy recovery, landfilling, or incineration were not included in the scope of this work. The paragraphs that follow will detail each of the key organizations that participate in the WEEE EPR scheme in Portugal.
Registry
... . Entity
(ANREEE)
Regulatory
EEE ---... .... ... Amb3E & Public
Producers - - - - ERP Portugal Authority
(APA)
Distributors/ Retailers
Collection Logistics Preprocessing
Households -Pinsprtrs P[ants
Outside of Scope Businesses ~~---~ ~~-- ~~-~-~-~ Downstream Operators tReuse-Mass Flow --
---Recycling/ Energy Landfill or
Monetary Flow - - - + Recovery Recovery incineration
!-- --- -- --- 1---.--- ----
---Information Inoraio Fo...I---Flow -.--.--.--.--. --. +
Figure 3. Overview of Portuguese WEEE recycling network (Adapted and reproduced from Santos 2013)39
In Portugal and other EU nations, the companies that put the devices on the market are responsible for ensuring that they are collected and recycled in accordance with the applicable regulations, which in this case are the WEEE and Battery Directives. When a device is placed on the market, it will typically be purchased by a retailer, business, or household. At the end of its first life, the product can either be stored, discarded (not shown in Figure 3), or collected. If it is collected, it can be reused if it is still in working condition, or it can be transported to a preprocessing plant via a series of logistics operators. It is important to note that there is a potential for material losses at each of these steps, but this is not shown in Figure 3.
In order to track the mass flows throughout the country, there are a series of information flows between each of the key players. First, producers of electrical and electronic equipment are required to register with the Associaqdo Nacional Para 0 Registo De Equipamentos Electricos E Electr6nicos (ANREEE), which was licensed in March 2006. ANREEE's mission is "to assure, organize, and keep the mandatory register of EEE (DL 230/2004, altered by DL 132/2010 of 17
December) and B&A (Batteries and Accumulators, DL 6/2009 of 6h January) producers. This will allow the monitoring and financial control of their obligations and objectives laid down in these diplomas and in other relevant legislation." Therefore, ANREEE's major focus is to monitor the quantities of products placed on the market by producers and the product life cycles
in an effort to reduce the overall environmental impact.40 This is represented by the information
flow from the EEE Producers to ANREEE.
Due to the complex nature of WEEE recycling schemes, many of the producers in Portugal delegate the responsibility for the management of WEEE to PROs through the payment of values, as represented by the monetary flow between the EEE Producers and the PROs. The eco-values paid by the producers to the PROs are set as a part of the license issued by the Portuguese
Environment Agency, which is shown in Figure 3 as the Regulatory Public Authority.41 This
authority, which is known as The Portuguese Environment Agency (APA), and falls within the Portuguese Ministry of the Environment, Territory Management and Energy, has the mission to "propose and monitor, on an integrated and participated manner, the public policies for the environment and sustainable development, in close cooperation with other sectorial policies and
public and private entities."42 As seen in Figure 3, information is shared between the PROs,
ANREEE, and the APA.
Once the eco-values are set by the APA in the PROs' licenses, The PROs assume the responsibility for ensuring the collection, recycling, and recovery targets of the WEEE Directive are met.41 This includes the allocation of the eco-values to collection points, logistical operators, and preprocessing plants based on the mass of WEEE handled at each stage and the difference between the cost to process the WEEE in accordance with the WEEE and Battery Directives, and any revenue derived from its treatment. The PROs also work with the various treatment operators within Portugal in an attempt to ensure that they are following industry best practices and having the smallest environmental impact possible.
IL is 1imprtn to note to note that, while this diagram shows the EPR scheme as a snapshot :1
time, the mass flows are constantly changing based on the type and quality of products being put on the market. The evolving composition of the waste stream, caused by changes in device composition and the types of devices being bought and sold, can have downstream impacts on
the revenues that can be derived from preprocessed devices. The dPFA presented in the sections that follow accounts for the changing composition of devices over time as allowed by the available data.
Portugal has two PROs for WEEE, Associagdo Portuguesa de Gestdo de Residuos (Amb3E) and European Recycling Platform Portugal (ERP Portugal), that organize the collection and treatment of WEEE, and have been licensed by the government since 2006.1' 943 Since 2006, operators in Portugal have complied with the recycling and recovery targets set in the WEEE Directive,
which was updated in 2012 as 2012/19/EU and legislates the treatment of electronic waste.44' 4
The following two sections will describe each of the PROs in greater detail.
2.6.1. Amb3E
Amb3E is the larger of the two PROs in Portugal. The Ministry for Environment, Spatial Planning, and Regional Development and The Ministry of Economy and Innovation granted Amb3E its first license by Joint Dispatch No. 354/2006 in 2006. Since that time, its license has been renewed through Dispatch No. 1516/2012.46-8 According to its most recent report, Amb3E manages the WEEE of approximately 1,200 producers, which put roughly 83,000 tonnes of
WEEE on the market in 2013.44.46
Figure 4 shows the number of producers reporting to Amb3E in 2012, 2013, and 2014. It is evident from the graph that the number of producers reporting to Amb3E has increased by approximately 10% from 2012 to 2014. This graph does not say anything about the quantity of products put on the market each year by these producers (which is shown in Figures 5 and 6), but rather, that there may be an increase in the diversity of products and brands being purchased in
Portugal.
1,300 1 241 1,250 1,200 0 0 1,161 1,150 01,102 1 100 -z 1,050 1,000 2012 2013 2014
Figure 4. Number of producers reporting EEE put on the market to Amb3E (Adapted from Amb3E
Relatorio de Actividades 20144)
Figures 5 and 6 show the progression of electrical and electronic equipment (EEE) declared to
Amb3E by producers from 2006 - 2014 in tonnes and thousands of units.14 4, Interestingly,
the mass of EEE declared to Amb3E in 2014 was close to the mass declared eight years earlier in
2006. However, the number of Units put on the market increased by approximately 50%. This
points to the fact that many devices, including laptops and mobile phones, are more compact now than they were 10 years ago. The decreased size and weight of many products. coupled with an increase in complexity, makes it more diflcIult for recyclers to identify and remove key materials from WEEE during preprocessing.
Looking at the values within each of the graphs, it is interesting to note the similar trends found in each. The drop seen between 2008 and 2009 was likely due to the global financial crisis. There is an increase in both the tonnes and units declared to Amb3E in 2010, perhaps pointing to
a small recovery, but another large decrease between 2010 and 2012. This decrease was most
likely due in part to the economic downturn in Portugal that began in 2010. Since 2012. both values have increased steadily, potentially pointing to a period of recovery for the sale of IEEE.
180,000 160,000 140,000 120,000 153,940
[1
U,-e C C 0 1-n 0 Fiue . 126,965 2008 Amb3E U) C 0 U) V C U) V = 0 -c H 45,000 40,000 35,000 30,000 25,000 20,000 15,000 10,000 5,000 0 Figure 6. Thous 38,384 31,547 15,937 2006 2007 2008ands of Units declared t
35,588 32,883
28,113
23,461 23,793 24,093
2009 2010 2011 2012 2013 2014
o Anb3E by producers (Adapted from Amb3E Relatorio de Actividades 20144)
As described in the previous section, each producer pays an eco-value to Amb3E based on the
type and quantity of waste put on the market in a given year. The fee strLlctUre is established by Dispatch No. 2103/2015, and is distributed by Anb3E for the collection., transportation, and processing of end-of-life prod ucts.
]
'
0 83,022 80,000 ~ 60,000 40,000 20,000 0 -2006 2007Tonnes of EEE declared to
CD, .0 LU 123,146 117,134 99,867 76,723 80,567 82,809
~-2009 2010 2011 2012 2013 2014by producers (Adapted from Amb3E Relatorio de Actividades
Amb3E participates in the European Association of Electrical and Electronic Waste Take Back
Systems (WEEE Forum), a not-for-profit, EU wide sector association that conducts
benchmarking analysis of the country-level performance of its members. In addition, the WEEE Forum makes it possible for PROs to work together towards the optimization of WEEE treatment processes and the reduction of environmental impact. In 2012, its 32 members reported the
collection of approximately two million tonnes of WEEE. 5 The WEEE Forum is not included in
Figure 3 because it is not a part of the legal framework that makes up the WEEE EPR scheme.
2.6.2. ERP Portugal
The Ministry for Environment, Spatial Planning, and Regional Development and The Ministry of Economy and Innovation granted ERP Portugal its first license by Joint Dispatch No. 353/2006
in 2006.54, According to its most recent reports, ERP Portugal manages the WEEE and B&A of
approximately 530 producers, and has a network of roughly 1,650 collection points.45 54, 56 In
2013, its producers put approximately 45,000 tonnes of WEEE on the market.45
Figures 7 and 8 show the progression of producers that report to ERP Portugal and the increase in collection points from 2006-2014.56 Overall, since 2006, the total number of producers reporting to ERP Portugal has more than doubled, and the number of collection points has increased thirtyfold. The added collection infrastructure has helped to facilitate an increase in the overall collection of WEEE, at the same time as the number of producers, and thereby the number of products reaching the end-of-life has also increased. Across these collection points, approximately 100,000 tonnes of WEEE was collected between 2006 and 2014.56
U, 0 0 a-E z 600 500 400 300 200 100 496 225 530
0
2006 2010 2014Figure 7. Number of producers reporting EEE (2006) and EEE and batteries and accumulators (2010 and 2014) put on the market to ERIP Portugal (Adapted from 10 Years Proioting Cnniieitmio int the Waste's
Sector56 ) Q 75 0 C) .0 E z 0 CL Figure 8. Number of ER 1662 1500 1325 1000 500 1 57 0 - - -- 2006 2010 2014
P Portugal collection points (Note: Value for 2010 is approximate) (Adapted from
Years Promtting Compeitioii in the WI 1iste's Sector )
Just as with Amb3E, each producer pays a fee to ERP Portugal based on the type and quantity of waste put on the market in a given year. The fee structure is established by Dispatch No. 2 104/20 15, and as seen above, is distributed by ERP PortLIgal for the collection, transportation, and preprocessing of end-of-life products.- Figure 9 shows the breakdown of the payments
made by IERP Portugal to operators at each of these stages of the recvcling chain.4 Due to the large number of collection points managed by ERP Portugal. the total cost for collection is
approximately 3.5 times the cost of transportation and 26.5 times the cost of valorization,
recy clin g, and treatment.
27
Q2,000,000 E 1 580,710 E xC 1,500,000 E E1,000,000 E 449,279 C M500,000 EA LU z 59,512 E tU W 0 E ---
-Collection Transport Valorization,
Recycling and Treatment
Figure 9. Breakdown of WEEE management expenses for ERP Portugal (Adapted front Relat~rio Anual de Actividades 2013 45)
Lastly, in contrast to Arnb3E, which operates only in Portug~ial, ERP operates in 16 additional cou~ntries, inClUding Austria, Denmark, Finland, France, Germany, Ireland. Israel, Italy, Norway, Poland, Slovakia, Spain, Sweden, The Netherlands, TUrkey, and The United Kingdomn. Across all of these territories, ERP manages the WEEE and B&A pu~t Oil the market by approximately
2,600 prodUcers.
2.7. SmmaRre and cyctlgka
In Chapter 2. detailed ho a e researchers have characterized the material composition o EFEE and
modeled the flow of devices thr-Oug(h complex recycling systemis. I also described the WEEE and
Battery Directives, which foro the regratory imperative for the proper collection, handling, and
treatment of WEEE. Lastly, I presented the Portlnese WE EPR sc hemed and two PROs,
Alb3E and ER P Port al, that are primarily responsible or ensuring that all legal reqUirements
are met. Altholh this system has proven to be effiective at ensuringm that the ninimum requirements of the WEEE and Battery Directives are met, I don't believe that it allows for the optimization of the system as a whole around the recovery of certain key materials. This means
that, while the mass based metrics of the Directives are met, valuable materials, such as gold, can be lost.
In Chapter 3, I will apply the background information detailed above to the case of Portugal,
using a dPFA to model the sales, generation, collection, and preprocessing stages of the
recycling system. I will also use the data gathered on the material composition of devices and the
value of the materials within them to characterize the material and economic losses within the
recycling system, accounting for uncertainties throughout the dPFA. I will conclude the chapter
by exploring ways in which this data can be used to inform future invests aimed at optimizing
the recycling system around the recovery of key materials.
Chapter 3: Characterizing Portuguese Recycling System Losses
Portions of this chapter are based on a 2016 publication by Ford et al. in Environmental Science
& Technology, titled Economics of End-of-Life Materials Recovery - A Study of Small
Appliances and Computer Devices in Portugal.'
3.1.
Dynamic Product Flow Analysis Methods
The framework presented here identified the material and economic losses experienced throughout the defined electronic waste supply chain, and identified which opportunities existed to maximize the total recovered value for the system.
A dynamic product flow analysis (dPFA) was developed to determine the amount of materials
available for recovery using a methodology derived from work of Navazo and Chancerel et al.
and combined with a detailed assessment of preprocessing facilities., 4 I used dPFA to track
sales of SACD (Sp) through their projected lifetimes (Gp(t))., collection (Cp(t)), and preprocessing (Rp(t)). At the point of preprocessing I applied detailed accounting for materials composition by product and over time, preprocessing yields, and economic performance within preprocessing facilities. It was also necessary to calculate the costs associated with each operation within the preprocessing plants in an effort to guide potential investments aimed at reducing widespread losses. An overall schematic of the methodology is provided in Figure 10 and an overview of the logistics of the dPFA can be found in Appendix A.
3 N 0CI I I 0, -- w a) a. _Not C) 0 I
~~Lziiz
$
'Loses Collce)-- Recovered -~7
F'$ CostsFigure 10. Schematic of overall model methodology
30
WEEE entering preprocessing stock R in each year t was tracked by product group p, as detailed
below. Therefore, the mass (or units) of WEEE into preprocessing year t, Rp(t), was the amount
of WEEE generated G,(t) multiplied by the fraction of products collected in that year C,(t). Thus, Gp(t) equaled the mass (or units) of products sold in the previous year S, (indexed on s), multiplied by the probability of reaching end-of-life in year t, Xp, summed over all production
years prior to t. Therefore, the amount of product in preprocessing was calculated using the
following relationship.
RP(t) = Sp (s, t) * AP (s, t) * Cp (t)
(S=tO
Rp in each year may be manually dismantled or shredded (or a combination of both), and are then sorted into a range of categories based on material composition. Prior to being shredded, the
battery is removed from the device in accordance with de-pollution regulations.38 The
non-battery fractions, including components such as the PCB, speaker(s), camera(s), and outside casings are then sent to the appropriate downstream processes within the preprocessing facility. At the preprocessing stage, the total mass of each material subcategory not recovered was multiplied by the approximate value for which the material fraction could have been sold on the secondary materials market.
3.1.1.
Sales
The starting point for this analysis was the use of detailed SACD sales data and projections for
the years 2000 - 2014. These years were chosen due to the specificity of data available. A large
portion of the sales information was gathered by ANREEE in its annual market data reports.
58-65
SACD includes WEEE categories two through ten, as defined in the WEEE Directive: small
household appliances; IT and telecommunications equipment; consumer equipment; lighting equipment; electrical and electronic tools; toys, leisure, and sports equipment; medical devices;
monitoring and control instruments; and automatic dispensers.66 The heterogeneity of these
device categories complicates characterization and definitions focused on materials recovery processes. For this reason, I combined these WEEE categories within five product groups that are based on the type of product, the quality of its PCB and the materials contained within, and the projected lifespan of the device. Please refer to Appendix B for a detailed breakdown of the
devices within each WEEE category into the five product groups below. The five product groups used are as follows:
1) Computing Devices
2) Telecommunications Devices
3) Printers
4) Other with 20+ year mean lifespan
5) Other with 0-19 year mean lifespan
3.1.2. Generation
In the context of this model, a waste generation event was defined as the point in which a device enters the waste stream, after being used and/or reused for an amount of time determined by the assumed mean and standard deviation (SD) of its lifespan. The distribution was assumed to be log-normal. According to the methodology developed in this work and modeled after the work of Duan et al., the lifespan of each device included initial use, initial storage, informal reuse, and reuse storage.' T. Reed Miller, a Research Specialist at MIT and co-author on the Duan et al. paper, worked with me to fit the lifespan modeling to my work. Product lifespan data were collected from various sources, including that of Duan et al., Geyer and Blass, and Navazo et al., in conjunction with the Lifespan Database for Vehicles, Equipment, and Structures.72 3-6 7 6 8 ' Table
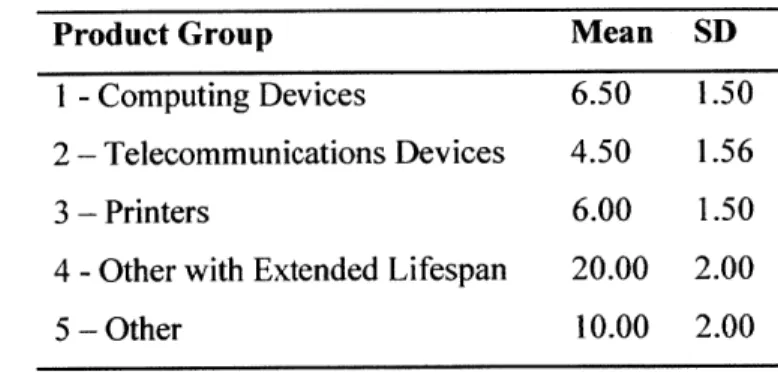
1 shows the mean and standard deviations used for the lifespans of the five product groups.
Table 1. Assumed mean lifespans of devices within the five product groups2'
Product Group Mean SD
I -Computing Devices 6.50 1.50
2 - Telecommunications Devices 4.50 1.56
3 - Printers 6.00 1.50
4 -Other with Extended Lifespan 20.00 2.00
5 - Other 10.00 2.00
Figure 11 shows the mass generated (i.e., that entered the waste stream) by year for an example set of computers sold in 2005 on the primary vertical axis (dashed line). The peak between 2010 and 2011 reflects the average lifespan of computing devices, as noted in Table 1. The secondary
vertical axis portrays the cumulative mass generated over that time period (dotted line). The data
shown in Figure 11 are for computers (product group 1) only and the shading qualitatively
represents the uncertainty in the data, which is propagated throughout the analysis and shown
quantitatively in Figure 14.
600
- - Example Device Generation Curve 25,000
500 ** Cumulative Generation 20,000 V 400 1oE 0 15,000 -* 400 .* * 10,000 0 100
/
* 5,000 0 0 2005 2007 2009 2011 2013 Year GeneratedFigure 11. Mass of computers sold in 2005 that is generated until 2014 (primary axis) and the cumulative
mass of computers generated over the same time period (secondary axis)
3.1.3. Collection
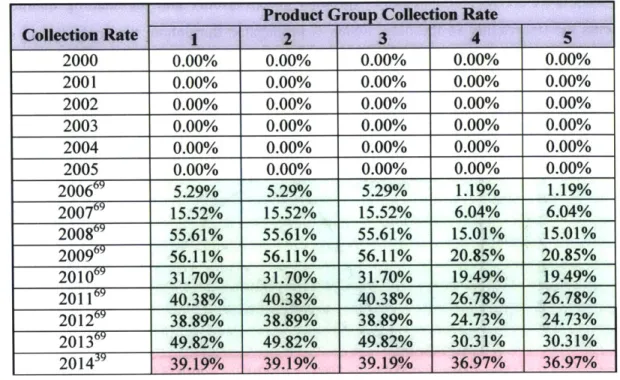
The collection rate varied by the product group and over time. It was assumed that the collection rate for all devices prior to 2006 was 0% because there was a limited form-al collection system established prior to when Portugal transposed the WEEE Directive. Data made available by Eurostat were used for all product groups for 2006 to 2013, and data calculated by my
collaborators were used for 2014."'' For 2006 to 2013, the collection rates were calculated by
dividing the mass of WEEE collected in a given year by the mass put on the market in the preceding three years. For 2014, collection rates were calculated by dividing the mass of WEEE
generated in a given year by the mass of WEEE collected in that year within the Portuguese
recycling infrastructure." As of 2014, the average collection rate for all SACD fell between
37.0% and 40.0%."1ci'rtva
See Table 2 for detailed collection data by year and by product groupincluding uncertainty.
33
Table 2. Collection rates over time (Coefficient of variation: CV = 0.10 for 2006 - 2013 and CV = 0.20 for 2014)
Product Group Collection Rate
Collection Rate 1 2 3 4 5 2000 0.00% 0.00% 0.00% 0.00% 0.00% 2001 0.00% 0.00% 0.00% 0.00% 0.00% 2002 0.00% 0.00% 0.00% 0.00% 0.00% 2003 0.00% 0.00% 0.00% 0.00% 0.00% 2004 0.00% 0.00% 0.00% 0.00% 0.00% 2005 0.00% 0.00% 0.00% 0.00% 0.00% 200669 5.29% 5.29% 5.29% 1.19% 1.19% 200769 15.52% 15.52% 15.52% 6.04% 6.04% 200869 55.61% 55.61% 55.61% 15.01% 15.01% 200969 56.11% 56.11% 56.11% 20.85% 20.85% 201 069 31.70% 31.70% 31.70% 19.49% 19.49% 201 169 40.38% 40.38% 40.38% 26.78% 26.78% 201269 38.89% 38.89% 38.89% 24.73% 24.73% 201369 49.82% 49.82% 49.82% 30.31% 30.31% 2014-' 39.19% 39.19% 39.19% 36.97% 36.97%
3.1.4.
Preprocessing Operations
To calculate material recovery and loss during preprocessing, I used data from sixteen preprocessing facilities within the recycling infrastructure of Portugal collected by one of my collaborators, Dr. Eduardo Santos, as a part of his PhD.39 Dr. Santos played an instrumental role in the analysis of the preprocessing facility data and ensuring that the dPFA reflected the current operations at the facilities to the greatest extent possible. Among the 16 facilities, which comprise the outstanding majority of plants in the country, there was a wide range of material recovery percentages due to variances in their size and use of manual and mechanical separation operations. Smaller plants (twelve in total) relied mostly on manual operations to dismantle fractions for the purpose of recovering the PCB and any other valuable materials (i.e., copper). Medium sized plants (three in total) relied less on manual dismantling, and were equipped with medium sized shredders and separators for the processing, identification, and sorting of metals and plastics. For the sole large plant, a majority of WEEE processing was done in large shredders and separators (i.e., car shredders) along with other waste materials, such as end-of-life vehicles (WEEE generally represented only a small percentage of the feedstock).
I
34As a part of the aforementioned thesis, full-scale batch tests were performed by my collaborators at the main operators in Portugal, representing more than 70% of the total installed capacity, to
evaluate the industrial technologies used to preprocess the WEEE.3 9 These tests yielded detailed
information about the intermediate and final operations at each of the plant, as well as the fractions that were sent downstream. Figure 12 provides a generalized schematic of three of the preprocessing facilities, showing only those fractions that contain other metals. For the dPFA, the category labeled other metals was assumed to contain the following elements: Ag, Au, Pd, Pt, Co, Ni, Sn, Ta, W. and other nonferrous metals except aluminum. The final fractions labeled -other" include iron and aluminum rich fractions. as well as others. It is evident from the figure that other metals are recovered most effectively in PCB containing fractions. In others, where the focus may be more prevalent base metals, other metals are often lost to the waste stream. It should be noted that the three plants shown in this figure are the highest performing from the standpoint of other metals recovery, with approximate average recoveries of 85%, 70%, and 80% respectively. Amongst the other thirteen facilities, the highest average recovery is approximately
15%.
Shredder
4 6. Other O ,0.3% eOther 7.1% Shredder/ rMobile Seaao Mixedf-SDAs Enter Phones Quality PCBs 100.0%
Facility Other
Computers }Iron Rich
Manual Fraction Disassembly Printer Medium 10.0 Quality PCBs 100.0% Other 5.0% 35