Economic Growth and Financial Statement Verification
The MIT Faculty has made this article openly available. Please share how this access benefits you. Your story matters.
Citation Lisowsky, Petro, Michael Minnis, and Andrew Sutherland.
“Economic Growth and Financial Statement Verification.” Journal of Accounting Research 55, no. 4 (March 21, 2017): 745–794.
As Published http://dx.doi.org/10.1111/1475-679X.12165
Publisher Wiley
Version Original manuscript
Citable link http://hdl.handle.net/1721.1/120980
Terms of Use Creative Commons Attribution-Noncommercial-Share Alike Detailed Terms http://creativecommons.org/licenses/by-nc-sa/4.0/
1
Economic Growth and Financial Statement Verification
Petro Lisowsky
University of Illinois at Urbana-Champaign and Norwegian Center for Taxation
Michael Minnis
University of Chicago Booth School of Business [email protected]
Andrew Sutherland+
Massachusetts Institute of Technology Sloan School of Management [email protected]
First draft: April 2014 This draft: August 2016
The online appendix is available at the end of this manuscript.
Previously titled, “Credit Cycles and Financial Statement Verification.” We thank Ray Ball, Itzhak Ben-David
(discussant), Phil Berger, Hans Christensen, Christian Leuz, Canice Prendergast, Nayana Reiter (discussant), Ste-phen Ryan, Amit Seru, Douglas Skinner, Luigi Zingales, and participants at the PCAOB-JAR Conference on Audit-ing and Capital Markets, the FARS Midyear conference, and the Chicago Booth, Iowa, National University of Sin-gapore, Singapore Management University, and Wharton workshops for helpful comments. We are extremely grate-ful to the Risk Management Association, Sageworks, Inc., and the Internal Revenue Service (IRS) for providing data for this project. Confidential tax return information was provided to Lisowsky by the IRS Large Business & Interna-tional (LB&I) Planning, Analysis, Inventory, and Research Division (PAIR). Because tax data are confidential and protected by data non-disclosure agreements under the Internal Revenue Code, all statistics are presented in the ag-gregate so that no specific taxpayer can be identified from this manuscript. Any opinions are those of the authors and do not necessarily reflect the views of the IRS. Lisowsky acknowledges support from the MIT Sloan School of Management and the PricewaterhouseCoopers Faculty Fellowship at the University of Illinois at Urbana-Champaign. Minnis acknowledges support from the ARAMARK Faculty Research Fund and the Chicago Booth School of Business. Sutherland acknowledges support from the Ernie Wish Fellowship at the Chicago Booth School of Business and the MIT Sloan School of Management. Any errors or omissions are our own.
Economic Growth and Financial Statement Verification
Abstract
We use a proprietary dataset of financial statements collected by banks to examine whether eco-nomic growth is related to the use of financial statement verification in debt financing. Exploit-ing the distinct economic growth and contraction patterns of the construction industry over the years 2002 to 2011, our estimates reveal that banks reduced their collection of unqualified audit-ed financial statements from construction firms at nearly twice the rate of firms in other indus-tries during the housing boom period before 2008. This reduction was most severe in the regions that experienced the most significant construction growth. These trends reversed during the sub-sequent housing crisis in 2008 to 2011 when construction activity contracted. Moreover, using bank- and firm-level data we find a strong negative (positive) relation between audited financial statements during the growth period and subsequent loan losses (construction firm survival) dur-ing the contraction period. Collectively, our results reveal that macroeconomic fluctuations pro-duce temporal shifts in the overall level of financial statement verification and that temporal shifts in verification are related to bank loan portfolio quality and borrower performance.
JEL Classification: D82, E32, E44, G21, M40.
Keywords: economic growth; commercial lending; banks; financial crisis; audit; verification; fi-nancial statements; lending standards.
1
Economic Growth and Financial Statement Verification
1. IntroductionA substantial literature in accounting highlights that audited financial statements are a
key input into lenders’ underwriting and monitoring practices. Banks can request financial statements audited by an independent accountant as part of a formal contract or as part of an
im-plicit contracting process to learn more about the borrower (e.g., Armstrong, Guay, and Weber
2010; Christensen, Nikolaev, and Wittenberg-Moerman 2015). Studies examining the use of
ac-counting in debt financing typically consider borrower, bank, or contract-specific characteristics.
However, recent theories argue that broader economic conditions affect banks’ lending standards
(e.g., Ruckes 2004; Dell’Ariccia and Marquez 2006). In particular, favorable economic shocks within a sector create a surge in credit demand, which in turn compels competition among banks
to reduce the actual or perceived benefit of firm-specific credit analysis. As a result, these
theo-ries broadly suggest that economic growth and underwriting standards—of which financial
statement verification via auditing is an important input—are negatively related. Motivated by
this theoretical framework, we investigate two research questions. Does financial statement
veri-fication in debt contracting change with the rate of economic growth? If so, does this variation
have implications for loan portfolio performance?
We use the US construction industry from 2002 to 2011 to examine these questions. This
setting has several useful features. First, the vast majority of the construction activity is
conduct-ed by privately held firms that do not face a regulatory audit mandate: construction firms with
fewer than 500 employees represent over 84% (98%) of total employment (establishments) in the
industry, versus 48% (84%) for all US industries (US Bureau of Economic Analysis). Thus, for
the vast majority of firms in the construction industry, independent verification of financial
2
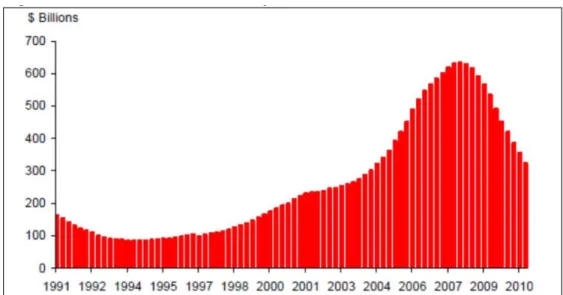
Second, the industry experienced significant variation in economic growth over this period.
Commercial construction and development loans outstanding increased from $200 billion in
2001 to nearly $700 billion by 2008 (see Figure 1 and OIG 2012). Employment (number of
con-struction establishments) increased by 900,000 (74,716), or 13% (11%), during this same period
(US Bureau of Economic Analysis, US Census Bureau). After the onset of the housing crisis,
loan losses related to construction exceeded $100 billion (FDIC Call Reports); the construction
industry accounted for over one-third of net private sector job losses from 2007 to 2011, or 2.1
million jobs (BEA); and the number of construction establishments decreased from a peak of
773,614 to 657,738 in 2011 (US Census Bureau). Moreover, the economic growth experienced
by this industry over this time varied greatly across geographic region, allowing us to exploit not
only temporal, but also spatial variation. Therefore, this setting provides the necessary economic
significance and variation in auditing and economic performance to examine our research
ques-tions.
We use a proprietary dataset of borrower financial reports compiled by the Risk
Man-agement Association (RMA) in a difference-in-difference design to examine how intensively
banks verified the financial condition of their construction borrowers relative to non-construction
borrowers from 2002 to 2011. Each year, financial institutions submit to RMA financial reports
collected by banks from about 200,000 commercial borrowers as a result of a loan application or
ongoing loan monitoring process. The dataset contains firms from a broad spectrum of sizes
cu-mulatively generating trillions of dollars of annual revenue from hundreds of industries. RMA
reports the distribution of financial reports collected across five mutually exclusive categories,
from highest to lowest verification level: unqualified audit, review, compilation, tax return, and
3
industry, size category, and region. We then link this bank-level financial report data to banks’
Report of Condition and Income reports (i.e., “Call Reports”) from the Federal Deposit Insurance
Corporation (FDIC).
Theory offers two broad predictions surrounding the relation between economic growth
and lending standards (e.g., Ruckes 2004; Dell’Ariccia and Marquez 2006). First, as rising
eco-nomic activity increases the number of firms seeking financing, banks’ adverse selection
con-cerns diminish as fewer commercial loan applicants are rejected applicants from other banks.
Sectoral economic growth also provides information to banks. When macroeconomic reports
in-dicate a sector is growing, firm-specific information is less likely to change a lender’s priors
about the applicant’s type. Collectively, lower adverse selection concerns and awareness of the overall state of the economy reduce the benefit of firm-specific information collection. In the
presence of bank competition, banks thus lower lending standards, and in particular reduce their
use of costly firm-specific verified financial information.
Consistent with this prediction, we find that banks substantially decreased the proportion
of unqualified audited financial reports collected from construction firms relative to firms in
oth-er industries in the years of the construction boom; instead, lendoth-ers disproportionally used tax
returns or other financial reports with less independent verification.1 This trend is particularly
strong in medium-sized firms that represent a significant portion of the US construction industry.
The economic magnitude of this change is large: whereas 19% of medium-sized construction
firms provided unqualified audited financial statements to their lenders in 2002, only 10% did so
1 In its annual Survey of Credit Underwriting Practices, the Office of the Comptroller of the Currency (OCC) notes
that financial reporting is a key element of underwriting, defining underwriting standards as those “terms and condi-tions under which banks approve, extend, or renew credit such as financial reporting, collateral requirements, re-payment terms, pricing, and covenants” (OCC 2014, pg. 2, emphasis added). See Becker and Ivashina [2016] for an analysis of a related phenomenon in which lenders significantly reduce their enforcement features, often referred to as “cov-lite” loans.
4
by 2007. This reduction in financial verification was nearly twice as large as the decrease for
non-construction industries over this period.Reinforcing this main result, we find that the
reduc-tion in unqualified audit report collecreduc-tion is most pronounced in the US regions that experienced
the most significant increase in construction lending: the West (e.g., California) and Southeast
(e.g., Florida).2 Moreover, consistent with the link between economic growth and lending stand-ards, we find that the proportion of unqualified audited financial statements collected increases
(i.e., reverses) for construction firms relative to other industries in conjunction with the onset of
the crisis. This supports our inference that the pre-crisis reduction in financial statement
verifica-tion was related specifically to changes in economic activity and not simply a broader secular
trend.
The second theoretical prediction is that the reduction in lending standards triggered by
the surge in economic activity leads to a weaker portfolio of borrowers in the event that the
in-dustry encounters a negative shock. We examine this prediction by testing whether banks with
lower proportions of construction borrowers with unqualified audited financial statements at the
height of the economic boom suffered higher levels of loan losses upon the onset of the crisis. As
another advantage of the construction industry setting, starting in 2007 the FDIC required banks
to report losses specifically attributable to construction and development lending, allowing us to
match each bank’s RMA financial collection data to the bank’s level of construction lending and loan losses as reported in the Call Reports. We find that banks with lower rates of unqualified
audit collection during the boom experienced significantly more construction portfolio losses in
the years of the housing bust. We estimate that a one standard deviation increase in the
percent-age of construction firms with unqualified audits in a bank’s portfolio during the housing boom
2 In a complementary study on the home purchase segment of the market, Dell’Ariccia et al. (2012) provide
empiri-cal evidence that banks reduced the weight on borrowers’ loan-to-income ratios in the subprime mortgage setting, and that this reduction occurred more intensively in regions with more credit demand growth.
5
is associated with a 12% lower construction chargeoff rate during the crisis. These results are
robust to controlling for a variety of bank portfolio characteristics, including the geographic
loca-tion of borrowers and losses in other porloca-tions of the banks’ loan portfolios. Our main results are
thus consistent with theory: bank screening and monitoring intensity varies with economic
growth and this intensity is related to subsequent bank losses.
While our difference-in-difference design and regional cross-sectional tests attempt to
isolate the relation between economic growth and lending standards, we conduct several
addi-tional tests to address alternative explanations. First, the RMA dataset does not provide
borrow-er-level variables other than a size category, which limits the extent to which we can control for
changes in borrower characteristics. Specifically, the economic shocks causing the economic
growth and contraction could also create investment opportunities for new, small firms that are
less likely to have audited financial statements and less likely to survive. Therefore, changes in
the composition of firms over time could be mechanically driving our results. To address this
concern, we restrict our analysis to the subsample of statements provided by firms with at least
$10 million of revenue and find that our results are strongest in this group, which is least likely
to include small startups.3 We also use a separate firm-level panel dataset from Sageworks, Inc. We find that (1) our main results hold and are economically similar even after controlling for
firm-level characteristics, including size, growth, leverage, and profitability; (2) construction
firms had a 30% higher audit termination rate relative to non-construction firms during the
con-struction boom years; and (3) changes in firm attributes over time (i.e., the mix of firm types)
have little explanatory power for our main results. In all, these analyses highlight that our
3 While startups and the arrival of new firms (i.e., a potential change in the mix of construction firms) are part of the
theoretical framework as described in Section 2, these various robustness tests ensure that our main result is not me-chanically driven by the addition of new, small construction firm to the sample, which would not typically have au-dited financial statements.
6
ings are neither idiosyncratic to the RMA sample nor driven by observable changes in the
under-lying mix of firm characteristics. Instead, construction firms change their relative propensity to
receive audits conditional on firm attributes.
Next, to corroborate that independently verified financial statements are associated with
future borrower performance, we use panel data from confidential US tax returns in estimating
firm survival rates during the housing crisis. Starting in 2008, the IRS has required firms with
assets of $10 million or more to indicate whether they receive a GAAP financial statement audit.
Using this panel of all private firms during 2008-2010, we find that construction firms that were
audited in 2008 had a 10% higher likelihood of surviving to 2010 relative to construction firms
without an audit, controlling for factors related to survival and the decision to get an audit. While
not providing a causal effect between audits and firm performance, this test reveals a crucial link
showing that construction borrowers with audits performed better during the economic
down-turn.
Finally, we conduct a variety of cross-sectional and robustness tests. We first examine
whether the relation between audit rates and economic growth is generalizable outside of the
construction industry. In pooled cross sectional tests, we regress the audit rate for each industry
on the annual industry-level GDP growth. The results reveal a significantly negative relation
(though smaller in economic magnitude compared to the tests explicitly examining the
construc-tion industry) suggesting that the relaconstruc-tion between economic growth and financial statement
veri-fication is a general phenomenon. We then return to our construction setting to examine whether
speculative investments in land—which is tangible collateral that requires less financial
state-ment verification—simultaneously drives the relation between credit demand during the boom,
7
construction that have cash flows tightly linked to construction activity, but are not significantly
involved in land speculation. All inferences remain within this subset. Next, we analyze audit
prices to assess whether construction firms potentially faced a higher inelasticity in the supply of
audit services relative to non-construction firms. We find no evidence to support this explanation
and, in fact, find some evidence that audit prices decreased more for construction firms relative
to other firms. Finally, we include bank fixed effects and control for bank securitization activity.
These tests account for time invariant bank characteristics, policies, and strategies. Our
infer-ences do not change, suggesting that banks responded to the construction industry growth by
es-tablishing lending policies that vary over time and across industries and geography, and are not
explained by other activities such as securitization.
Our results contribute to two lines of research. First, we enhance our understanding of
how economic conditions are related to the role of accounting in debt contracting. Because
pub-licly traded firms are required to receive a financial statement audit by regulatory mandate,
set-tings to study the role and value of auditing are difficult to identify. In our setting, financial
re-porting verification is not mandated, but based on negotiation between the borrower and bank,
similar to collateral or other lending terms. Recent studies examining privately held US firms
show that in the absence of regulatory fiat, audited financial statements are not necessarily the
equilibrium outcome, even in larger private firms with external capital (Blackwell et al. 1998;
Allee and Yohn 2009; Minnis 2011; Lisowsky and Minnis 2015). We extend these studies by
providing evidence of the equilibrium level of auditing not only in the cross section, but also
over time, based on economic conditions.
Second, we provide novel evidence of factors associated with the housing crisis. Prior to
re-8
ports for construction borrowers. During the crisis, we find an economically significant negative
link between lending standards and subsequent bank losses. Although prior work shows that
banks lowered their credit standards for individual home purchasers during the same period (e.g.,
Mian and Sufi 2009; Keys et al. 2010; Ben-David 2011; Demyanyk and Van Hemert 2011;
Loutskina and Strahan 2011; Maddaloni and Peydró 2011; Dell’Ariccia et al. 2012), an
im-portant difference for our setting is that, unlike mortgages, banks typically retain small and
me-dium commercial loans. Thus, securitization is unlikely to cause the variation in commercial
lending standards we observe over the economic cycle.
Importantly, we identify how banks reduced their lending standards by analyzing the
ver-ification level of financial reports they collected. Because settings to study the information
col-lected by banks from a large sample of firms are difficult to find, prior literature has been unable
to separate the role of verification from other factors, such as borrower risk, in examining
chang-es in lending standards. Our data allow us to link changchang-es in verification to banks’ loan losschang-es
and firm survival. Also, our research design, which controls for industry, time, and bank
charac-teristics, mitigates concerns that other economic factors, sample composition issues, or audit
market trends explain our results. In all, we demonstrate that lending standards in the commercial
segment of the credit market vary significantly with economic growth, and provide direct
evi-dence of a specific verification mechanism—audits—by which it happens.
2. Theoretical framework and setting
2.1. Theory
Ruckes (2004) and Dell’Ariccia and Marquez (2006) provide a theoretical framework for understanding how lending standards change with the economic growth of an industry. Ruckes
indus-9
try), the default probability of the average borrower within the group declines. In turn, this
im-provement in the average borrower’s prospects reduces the value of borrower-specific screening. This line of reasoning is related to models showing how disclosures by one firm can inform
in-vestors about related firms (Lambert, Leuz, and Verrecchia 2007), and empirical research
relat-ing a bank’s experience in a given sector to its demand for verified information from borrowers in that sector (Berger, Minnis, and Sutherland 2016).
Dell’Ariccia and Marquez (2006) develop a complementary theory in which banks filter between two types of borrowers: “known” (bank knows the creditworthiness of the borrower)
and “unknown” (the bank does not know the creditworthiness of the borrower). For the latter set of firms, the bank must decide if it is worth investing effort in filtering unknown borrowers into
good types that are worthy of credit and bad types that may have been rejected by other lenders.
Dell’Ariccia and Marquez (2006) show that when investment opportunities increase within an industry, the proportion of unknown borrowers in the economy increases. However, the
likeli-hood that a particular unknown borrower is a rejected applicant from an alternative lender is
lower because during good times, on average, firms have a higher probability of having positive
NPV projects. In turn, conducting borrower-specific credit analysis is less beneficial for banks.
This reduction in adverse selection during economic expansions can lead to deteriorated lending
portfolios and higher subsequent loan losses in the event of an economic downturn.4
Collectively, these theories broadly suggest that when a sector receives a positive
eco-nomic shock, the net benefit to banks of screening borrowers is lower. In expectation, firm-level
information, such as that provided in audited financial reports, simply confirms what broader
4 The essence of the Dell’Ariccia and Marquez (2006) model is captured by the following quote: “When the
propor-tion of unknown projects in the economy increases, as may happen after a deregulapropor-tion or during the expansionary phase of a business cycle, such adverse selection problems become less severe, reducing banks’ lending standards. This in turn results in lower bank profitability, higher aggregate credit, and higher vulnerability to macroeconomic shocks” (pg. 2534, see also Section IV.A.).
10
economic data already suggest to banks—that the borrower is creditworthy. In the presence of
bank competition, when costly information collection efforts do not alter a lender’s priors (in
ex-pectation), then the lender will reduce these efforts. Thus, theory suggests that banks make an ex
ante rational tradeoff between lower screening costs during economic expansions with higher
expected levels of portfolio loan losses in the event of negative shock.
While theories typically model banks as screening borrowers, we caution that our setting
does not permit us to track specific borrowers over time, or separate the statements collected by
banks at the application stage from the post-origination stage. As a result, our analyses cannot
distinguish between screening activities for new borrowers versus monitoring activities for
exist-ing ones. Although the theories we draw upon directly model screenexist-ing, related research
consid-ers screening and monitoring as closely related activities that respond similarly to changes in
economic conditions.5
2.2. Construction industry setting
To test the prediction that financial statement verification is related to economic growth,
we examine differences between construction and non-construction firms between 2002 and
2011. This setting is powerful in that commercial borrowers in the construction industry
experi-enced significant increases and subsequent decreases in economic growth during this period. The
housing boom of the early-to-mid 2000s elevated the construction industry to an unprecedented
role in the US economy, peaking at 6.7% (5.6%) of private sector employment (GDP) in 2006
and ranking slightly behind health care and professional services in terms of overall size (US
5 For example, Hellwig (1991) states, “‘Monitoring’ ought to be understood in a broad sense as any form of
collect-ing information about a firm, its investment prospects and its behavior. The information that is collected is useful because it serves to sort out ‘bad’ projects and/or punish ‘bad’ behavior” (pg. 46).
11 reau of Economic Analysis 2014).6
Construction activity contracted sharply starting in 2008, resulting in the industry
shrink-ing by one-quarter to 5.1% (4.0%) of private sector employment (GDP) by 2011. This
reduc-tion—a net loss of 2.1 million jobs—represented 36% of the total decline in net US employment
during the same period. Moreover, construction loan losses were massive, exceeding $100
bil-lion from 2007 to 2011 (FDIC).7 In short, during 2002-2011, the construction industry attracted, and then lost, significant amounts of financial and human capital, while leaving a bloated
inven-tory of housing (Rajan 2010).
2.3. The role of auditing
Prior research demonstrates that audited financial statements play a meaningful role in a
bank’s lending process to mitigate informational risks.8 Independent auditors ensure that the
bor-rower’s transactions and risk exposures are properly represented in the firm’s financial
state-ments according to Generally Accepted Accounting Principles (GAAP). In doing so, they
pro-vide the lender with informative signals of the borrower’s credit risk and the expected proceeds in the event of default. The verification role of audits allows the parties to contract on financial
information through covenants and track compliance on an ongoing basis. In the construction
industry, audits help builders obtain surety bonds, third-party guarantees that the work will be
performed as specified by contract. Audits can also discipline the activities of the firm by
expos-ing and constrainexpos-ing agency problems and strengthenexpos-ing risk management and internal controls
(Watts and Zimmerman 1983). In addition, audited financial statements provide information in
6 We classify firms in NAICS industry 23 as belonging to the construction industry. Firms in this group engage in
construction of buildings, heavy and civil engineering construction, and specialty trade contracting.
7 Specifically, the sum of items RIADC891 (1-4 family residential construction loans, chargeoffs) and RIADC893
(Other construction loans and all land development and other land loans, chargeoffs) totaled $109 billion across all Call Reports filed with the FDIC from US-based, non-foreign owned, corporate banks from the first quarter 2007 until the fourth quarter of 2011.
8 See Armstrong et al. (2010) for an overview and citations of this large literature. Also see DeFond and Zhang
12
the form of footnotes, which—with the exception of reviews—other report types are not required
to include. Moreover, given their relatively long operating cycle, construction firms have
signifi-cant accrual activity that can be (intentionally or unintentionally) misrepresented in unaudited
financial statements.
Pertinent to our study, construction activity is primarily driven by small and medium
pri-vate firms that are not required to undergo financial statement audits. Employment in
establish-ments with fewer than 100 (500) employees makes up 67.9% (84.3%) of the total construction
industry (US Census Bureau Business Register 2010); in contrast, the level of employment
con-tributed by public firms, which are required to obtain audits, peaked in 2005 at only 5.5% of total
construction employment.9 In private US firms, economic forces of supply and demand influence whether financial statements are produced, and if so, the level of verification assured by an
inde-pendent auditor.
While banks prefer lending to firms with audited financial statements, all else equal,
au-dits are costly and consume considerable management time.10 Hence, audit and reporting re-quirements are a meaningful part of the bundle of contractual and price terms that banks offer in
competing for potential borrowers (Minnis 2011; Cassar et al. 2015). Because theory suggests
that banks reduce lending standards to firms in industries experiencing positive economic
shocks, we predict that banks reduce their collection of unqualified reports from construction
borrowers relative to non-construction borrowers during the 2002-2007 housing boom, and that
this pattern reverses in the ensuing crisis.
9 In 2005, there were 7.6 million people employed in the construction industry. The 74 construction firms in
Com-pustat cumulatively employed 418,000 individuals, or 5.5% of the total.
10 Audit fee data are not available for the private firms in our study; however, as a broad point of reference, the
me-dian publicly held construction firm (conditional on having less than $1 billion in revenue to be as consistent as pos-sible with the firms in this study while maintaining adequate sample size) paid 0.26% of revenue for an audit during the time period under study, which is more than 20% of the median construction firm’s profit margin. Of course, differences in firm size and public versus private ownership make these estimates difficult to generalize to the con-struction firms in our sample. See additional discussion about audit fees in Section 4.3.3.
13 3. Data
For our main analyses, we use data from the Risk Management Association’s (RMA)
Annual Statement Studies. RMA, a non-profit association of financial institutions, compiles the
number and type of financial statements its member banks collect from commercial borrowers
and loan applicants. The Annual Statement Studies provide summary financial statistics (e.g.,
income statement and balance sheet ratios) of these borrowers and applicants by year, industry,
US region, and firm size for lenders to reference when evaluating borrowers. While participation
is voluntary, hundreds of financial institutions participate, ranging from small community banks
to nine of the ten largest banks by assets.11 Thus, the dataset represents a broad cross section of banks and a sizable portion of the US commercial lending market. Industry is reported at the
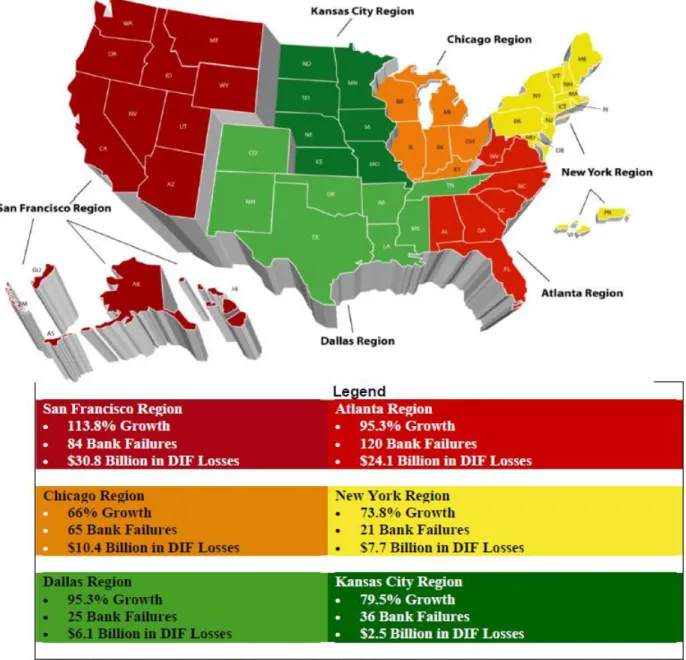
six-digit NAICS level; the regions roughly correspond to the six Federal Reserve regions as
parti-tioned by the Office of the Inspector General (see Figure 2); and firms are partiparti-tioned into six
borrower size categories based on revenues: <$1 million, $1-3 million, $3-5 million, $5-10
mil-lion, $10-25 milmil-lion, and >$25 million. Because RMA does not provide borrower-level data, the
primary unit of observation is the year-industry-region-size level.
Table 1 reports that RMA compiled nearly 1.8 million financial reports collected from
fi-nancial institutions from 2002 to 2011.12 After eliminating financial and real estate firms and
units of observation with very few firms, we use data from over 1.5 million firm-year
observa-tions that are allocated across 4,881 industry-firm size observaobserva-tions and 24,551
11 For example, major commercial lenders including Bank of America, JPMorgan Chase, PNC Bank, SunTrust
Banks, Wells Fargo, and Zions Corporation appear every year, and these six banks alone are responsible for 22.7% of US commercial and industrial lending by banks during the sample period. See the accompanying online appendix to this paper and Berger et al. (2016) for additional description of the RMA dataset and frequency of bank participa-tion.
12 We begin our sample in 2002 because this is the first year that RMA compiled the data electronically by bank,
14
industry-region-size category observations.13 Within each unit of observation, RMA classifies the number of financial reports it collects into five mutually exclusive and collectively
exhaus-tive categories: unqualified audit, review, compilation, tax return, and other. We discuss each of
these reports in detail in Appendix A. Our main variable of interest is the proportion of the
re-ports collected by banks that are unqualified audits—the only report type with the combination
of the highest level of independent attestation, most complete disclosure of information, and lack
of departures from GAAP.
Table 2 reports the number (Panel A) and proportion (Panel B) of financial reports across
the three main categories—unqualified audits; reviews and compilations; and tax and other—by
year for firms in the $3-to-$25 million revenue range. We focus on this size range because the
unconditional likelihood of getting an unqualified audit is very low (high) for the smallest
(larg-est) firms outside this range, though we conduct tests for all size ranges. Panel B reports that the
proportion of unqualified audited financial statements decreases for non-construction firms,
fall-ing from 19.5% in 2002 to 16.2% in 2007. However, for construction firms, the decline over the
same period is more than twice as sharp, from 18.6% to 10.1%. Meanwhile, the collection of tax
and other statements—the reports with the least verification and information—increased at a
sig-nificantly greater rate for construction relative to non-construction firms.14 In contrast, after 2007
the incidence of audits (tax and other reports) rose slightly (fell) among construction firms
13 We eliminate financial firms because they can face various regulatory mandates for financial reporting, and real
estate firms primarily because of concerns that real estate speculation would influence the results in favor of our prediction. If we include real estate industry firms with construction industry firms, our inferences are unchanged. To reduce the number of units of observation with fewer than five firms, we collapse six-digit NAICS industries into three-digit NAICS industries.
14 While unqualified audit opinions are generally regarded as the highest level of verification, ordering the remaining
four categories in terms of verification is imprecise. We group tax and other reports together because these report types explicitly do not include independent accountant verification. In addition, unlike unqualified audits, tax returns do not include a statement of cash flows or footnotes. However, discerning whether compilations provide “more verified” information than tax returns, for example, is beyond the scope of this paper. One caveat, though, is that the “other” category includes qualified audit opinions, which we are unable to disentangle from company generated reports. Our robustness test using Sageworks data (discussed below) mitigates concerns that our inferences are mate-rially affected by this issue.
15
tive to non-construction firms, consistent with a reversal in the pre-crisis trend.15
The difference-in-difference column of Table 2 highlights the main result of this paper:
banks’ collection of unqualified audited financial statements from construction firms declines during the period of economic growth for the construction industry, hitting a trough in 2007, and
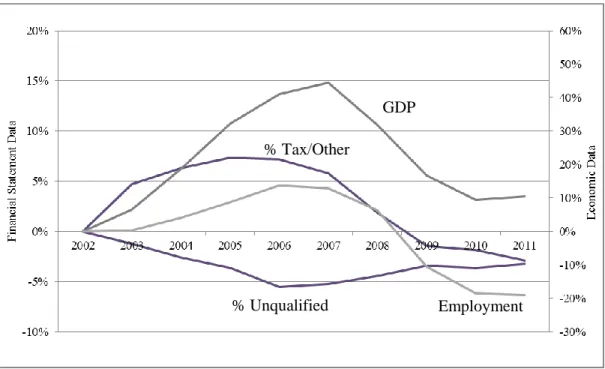
then reversing upon the onset of the crash in construction. Figure 3 illustrates the main result. We
plot the cumulative difference-in-difference in banks’ financial statement collection for
construc-tion firms relative to non-construcconstruc-tion firms alongside plots of the economic activity for
con-struction firms. The figure reveals that as concon-struction activity grew during the credit boom, the
proportion of unqualified audits (tax returns and other) decreased (increased) for the construction
industry relative to non-construction industries. The next section more thoroughly examines this
result.16
4. Analysis of bank collected financial reports
4.1. Changes in the frequency of financial statement verification
To examine whether banks change their verification standards with changes in economic
growth, we begin our analysis by estimating the following difference-in-difference model using
weighted least squares (subscripts for industry i, borrower size category j, and year t are
sup-pressed for brevity) in which each year-industry-size observation is weighted by the number of
firms in the observation:
15 Two additional observations are worth noting from Table 2. First, the decline in the proportion of unqualified
au-dits collected from construction borrowers is not only driven by the denominator. The absolute number of unquali-fied audits also generally declines over the years 2002 to 2007, suggesting that the result is not simply driven by new, unaudited firms entering the sample, but rather firms dropping audits as well. Second, Table 2 suggests that a larger portion of the reduction in unqualified audits for construction firms (relative to other firms) occurs in years leading up to 2006. This result is consistent with the fact that the construction industry grew more rapidly (in terms of GDP and employment) relative to other industries in the years 2003 to 2005; thus, while the construction peak occurred in 2007, more significant growth occurred earlier.
16 To more closely investigate changes in lending market conditions following the onset of the crisis, we examine
origination volumes post-2007. Consistent with Figures 1 and 3, we find that Acquisition, Development, and Con-struction lending peaked in late 2007, then declined each quarter through the end of 2010. Importantly, lending ac-tivity did not tighten rapidly in 2008 with a gradual improvement through 2010, but instead continued to decline over the period 2008 to 2011.
16
1 2
size industry
PercentUnqualifiedYear2007 Year2007 Construction . (1) The dependent variable PercentUnqualified is the percentage of financial statements with
un-qualified audits in the year-industry-size unit of observation and is our proxy for banks’
verifica-tion standards. Construcverifica-tion is an indicator for construcverifica-tion industry borrowers (NAICS code
23), with the main effect included in the industry fixed effects (industry
) which account for the
distinct economic characteristics in each industry (e.g., litigation risk or availability of collateral)
that lead to different levels of verification. The specification in equation (1) only uses years 2002
(beginning of the sample period) and 2007 (end of the economic growth for construction); thus,
Year2007 is an indicator which equals 1 for observations in the year 2007 and 0 for observations
in the year 2002. We also include borrower size fixed effects and cluster standard errors at the
three-digit NAICS industry level.17 The coefficient on the interaction term
Year2007×Construction is the difference-in-difference estimator that measures the differential
change in the collection rate of unqualified audited financial statements (i.e., bank verification)
from 2002 to 2007 from construction firms relative to non-construction firms (i.e., differential
economic growth).
Our empirical design addresses two potential limitations of analyzing trends in financial
verification. First, regulators have asserted that there has been a secular downward trend in the
use of auditing (FAF 2011), such that identifying a trend in construction may not be a result of
our prediction, but rather a more general, long run shift in the supply and demand of auditing.
Second, because the RMA data are repeated cross-sections in which member banks (and their
borrowers) may change year-to-year because of bank participation decisions, we could observe
17 We use indicators for firm size that correspond to two of the revenue categories reported by RMA: $5-$10 million
and $10-$25 million. The holdout size group is the $3-$5 million size group. In an alternative specification, we cal-culate the average firm size within each unit of observation (RMA reports the total assets and total sales for each unit of observation) and use this continuous variable rather than indicator variables. Our results (untabulated) are nearly identical.
17
trends due to sample composition issues rather than population dynamics.18 Our difference-in-difference design mitigates both concerns. Because we control for firm size and industry, we
on-ly require the assumption that sample composition and population secular trend issues affect
construction and construction firms similarly. Thus, our identifying assumption is that
non-construction firms serve as an appropriate counterfactual for non-construction firms in that these
firms are similarly affected by all issues (e.g., supply side shocks, sample selection concerns, and
secular trends in audits) except for changes in economic growth, which is our treatment of
inter-est.
Table 3 presents our regression results examining unqualified audit rates for firms with
revenues between $3 million and $25 million. First note that the coefficient on Year2007 in
Col-umn 1 is significantly negative, indicating that banks had a lower propensity to collect
unquali-fied audited financial statements from medium-sized borrowers in all industries in 2007 relative
to 2002, consistent with anecdotal claims of a secular decrease in the use of auditing in privately
held firms (FAF 2011). More importantly, the difference-in-difference coefficient is a significant
-3.8%, which indicates that banks reduced their collection of unqualified audited reports more
for construction firms than non-construction firms during this time period. Given a base rate of
audit collection from construction firms of 18.6% in 2002, this reduction is economically
signifi-cant and almost twice the rate of non-construction firms over this period.
In Column 2 of Table 3 we consider each of the credit boom years (2002 to 2007) by
re-placing Year2007 with Trend, a count variable from 2002 to 2007, in the following regression:
1 2
size industry
PercentUnqualified Trend Trend Construction . (2) The coefficient on Trend×Construction estimates the average annual difference-in-difference.
18 Bank participation is relatively persistent in the data set, however, so this is likely not a first order issue. See
18
We find that the difference-in-difference estimate in column 2 is -0.82%, which, as expected, is
approximately one-fifth the magnitude of Year2007×Construction in Column 1, and similar to
the annual difference-in-difference estimates from descriptive statistics in Table 2. To examine
which financial statements displace unqualified audits during the credit boom, we replace the
dependent variable in Column 3 of Table 3 to be the proportion of statements collected that are
tax returns or other. Unlike for unqualified audits, there is a positive and significant trend in
gathering tax returns and other statements, which is particularly pronounced for construction
firms (the coefficient on Trend Construction is significantly positive in Column 3).19
Next, we examine the crisis years in which construction activity substantially declined to
confirm the link between economic growth and financial statement verification. If our results for
2002-2007 are not simply identifying a secular reduction in the usefulness of unqualified audits
for construction firms, then we should observe that the difference-in-difference estimates reverse
during the years 2008-2011. Indeed, Columns 4 and 5 of Table 3 report that bank collection of
unqualified audited financial statements from construction firms relative to non-construction
firms increased when the construction industry growth became negative—the coefficients on
both Year2011×Construction and Trend×Construction are significantly positive.20 Thus, the ev-idence from Table 3 confirms both the inferences from Figure 3 and our predictions: bank
collec-tion of verified financial informacollec-tion has a negative covariacollec-tion with economic growth.
To examine the role of firm size and to present a complete set of results, we re-estimate
Eq. (2) separately within all of the RMA revenue size categories: <$1 million; $1 to $3 million;
19 Recall that the “hold out” financial report types are reviews and compilations, which have middle levels of outside
accountant involvement, so the results in this section are not the mechanical mirror image of the audit results.
20 In Table 3 we estimate the regression separately for the boom (2002 to 2007) and crisis (2008 to 2011) periods to
avoid presenting triple interaction terms; however, our inferences are the same when we use a triple interaction spec-ification and pool all years in one regression. We emphasize that our difference-in-difference tests are meant to de-tect deviations in audit rates for construction relative to non-construction firms, rather than make statements about the absolute level of audit rates (or the sign of the trend). Specifically, audit rates of construction firms during 2008 to 2011 stayed constant as audit rates for non-construction firms declined.
19
$3 to $5 million; $5 to $10 million; $10 to $25 million, and >$25 million.21 For brevity we do not tabulate all the results, but Figure 4 plots the coefficient estimates of the interaction term
(Trend×Construction) for each of these groups during the pre-2008 period. The results reveal
that much of the variation occurs in the middle firm sizes. This is a reasonable result because the
smallest firms (with revenues <$3 million) have very low audit rates unconditionally, while
larg-er firms (with revenues >$25 million) have more exposure to issues such as displarg-ersed ownlarg-ership
and larger debt levels (Lisowsky and Minnis 2015). Middle-sized firms have substantial
varia-tion in auditing, but closer ownership and lower loan amounts. A particularly useful finding from
Figure 4 is that, while the results are significant in each of the three middle size categories ($3 to
$5 million, $5 to $10 million, and $10 to $25 million), the most economically significant effect is
in the $10 to $25 million category. This finding suggests that our main results are not simply a
function of new startup construction firms—which typically would not have their financial
statements audited regardless of the economic state—entering the sample and mechanically
de-creasing the PercentUnqualified variable.22 We conduct additional tests below to further consid-er and refute this sample composition explanation.
While the construction industry has several features which make it attractive as the focal
point of our analyses, we also investigate whether our inferences are generalizable beyond this
industry. To do so, we collect industry-level GDP data from the Bureau of Economic Analysis
and measure economic growth for each three-digit industry as (GDPt – GDPt-1)/GDPt-1.23 As
21 We also estimate our model in the pooled sample after adding an interaction term between the 2007 indicator and
firm size. Our inferences are unchanged. We present our tests by size category here to allow the interaction coeffi-cient (Construction×Trend) to vary across firm size without a linear restriction (i.e., we are not forcing the relation to be fixed for each size category).
22 To be clear, as described in Section 2 the theoretical framework suggests that new firm entrants during periods of
growth within a sector are part of the explanation for the reduction in verification standards. New firm entrants re-duce information asymmetry concerns between banks related to all borrowers. Our tests here simply reflect that the new entrants are not mechanically decreasing the PercentUnqualified variable.
20
shown in Table 4, we then regress the change in PercentUnqualifiedt on Changes in GDPt at the
industry level and include industry fixed effects (column 1) and industry and year fixed effects
(column 2). Consistent with our main analyses examining the construction industry, we find that
the change in PercentUnqualified for a given industry decreases as GDP growth increases.
4.2. Regional based tests
We next exploit cross-sectional variation in economic activity across US regions.
Aca-demic research (e.g., Mian et al. 2013) and governmental reports (e.g., OIG 2012) have
docu-mented that housing loan growth and subsequent losses were most prominent in the West and
Southeast regions (i.e., states in the San Francisco and Atlanta Federal Reserve regions, see
Fig-ure 2). If economic shocks alter bank use of verified financial information, then we should find
that our results are more pronounced in regions with the most significant upturn in construction
activity.
In Table 5, we create an indicator variable HotRegion equal to one for observations in the
West and Southeast regions of the US; zero otherwise. Our specification includes all main and
two-way effects, but we only report the double and triple interaction terms with Construction for
brevity. Columns 1 and 2 show that, relative to non-construction firms, the collection of
unquali-fied audits decreased for construction firms in the non-Hot regions (the coefficients on
Year2007×Construction and Trend×Construction are significantly negative, though the
econom-ic magnitude is smaller than the estimate in Table 3). However, construction firms in regions
with more economic growth in construction experienced a much steeper reduction in unqualified
audited financial statement collection (the coefficients on the triple interaction terms of
Year2007×HotRegion×Construction and Trend×HotRegion×Construction are significantly
21 positive for the HotRegion observations.
Columns 3 and 6 indicate that reporting practices for ‘tax’ and ‘other’ statements again
follow an opposite path—one that reinforces the results in Table 3 for these lower verification
reports. The coefficient on the triple interaction term in Column 3 (6) of Table 5 shows that
con-struction borrowers in the West and Southeast were significantly more (less) likely to provide tax
and other statements to their bank prior to (after) 2008, at the same time banks were reducing
(holding steady) collection of unqualified audited reports. Overall, the region-level results bolster
the case that financial statement verification is an important component of lending standards that
evolve with economic conditions. Moreover, these within-construction industry results mitigate
concerns that the results from Table 3 are generated by unobservable national-level supply side
factors specific to the construction industry, or that assertions of a secular decline in auditing is
somehow more acute in the construction industry.
We take two steps to further ensure that our findings are not driven by unobservable bank
characteristics (such as expertise—see Berger et al. 2016) or bank sample composition changes.
First, we include bank fixed effects in our main specifications of Tables 3 and 5. Second, we use
only the subsample of banks with construction lending activity in both “hot” and “not hot” re-gions such that we are identifying only the variation within bank across rere-gions. As reported in
Tables A1 and A2 of the online appendix, these alternative specifications do not alter our
infer-ences, suggesting that neither unobservable bank characteristics nor a change in the mix of
sam-ple banks is driving the results. Rather, banks altered their underwriting and monitoring
stand-ards as it pertains to financial verification across regions and industries.24
24 Berger et al. (2016) find that “novice” banks (with no construction lending in 2002) in fact had higher rates of
audit collection from construction firms than “experienced” banks (with construction lending throughout the period). This evidence suggests that banks did not lower their financial statement verification policies to aggressively enter
22
4.3. Ruling out alternative explanations
4.3.1. Collateral
One potential concern with our inferences presented thus far is that the reduction in
un-qualified audit rates was driven by construction industry participants purchasing land as a
specu-lative long-term investment amid considerable real estate price increases. As a result of the land
purchases, banks demanded fewer audited financial statements because they used the land as
col-lateral and relied on alternative information such as appraisal reports. To mitigate concerns over
this collateral channel driving our results, we conduct our analyses within the construction
indus-try using only those firms least likely to engage in land purchases. Specifically, we eliminate
firms in single-family (NAICS 236115) and multi-family (236116) housing construction, new
housing for-sale building (236117), residential remodeling (236118), industrial building
con-struction (236210), commercial and institutional building concon-struction (236220), land
subdivi-sion (237310), and heavy and civil engineering construction (237990).25 The remaining construc-tion firms are exposed to the cash flow channel related to the housing boom, but are not exposed
(or at least significantly less exposed) to the collateral channel. Using only firms exposed to the
cash flow channel does not affect any of our inferences. We tabulate these results in Table A3 of
the online appendix.26
4.3.2. Borrower composition changes
the construction market, but instead suggests that new banks recognized they were less well-informed than incum-bent banks and, as a result, implemented higher audit standards. This result holds even stronger in “hot” regions.
25 To provide support for our categorization of those sub-industries which we eliminate, we use our firm-level tax
data (described in more detail later). We note two pieces of descriptive evidence. First, firms are required to report the book value of land on the Schedule L balance sheet. We find that land holdings as reported on Schedule L are concentrated in firms in the industries we eliminate, and firms outside those industries report virtually no land as assets. This observation confirms that land speculation was not a significant issue for these firms. Second, the names of firms in eliminated industries contain such words as “development”, “developers”, “investors”, “community”— i.e., words that signify potential land investment. In contrast, the names of firms in the remaining industries include “carpentry”, “contractor”, “plumbing”, etc.—i.e., those firms exposed primarily to cash flow shocks.
26 Focusing on firms exposed only to the cash flow channel (i.e., carpenters, plumbers, and electricians) also rules
out the possibility that builders pre-selling units at a higher rate during the boom allows less monitoring by banks due to lower lending risks.
23
One disadvantage of the RMA data is that they are aggregated at the industry and
bor-rower size-level, preventing an analysis of borbor-rower-specific behavior or sample composition
changes. Thus, one concern could be that our findings are the result of a changing mix of firms
within the construction industry (relative to non-construction firms) when economic growth
changes and that this altered mix of firms has lower levels of financial statement verification. To
investigate this alternative explanation, we supplement our main analysis using an independently
collected firm-level panel dataset compiled by Sageworks, Inc. Sageworks collects income
statement and balance sheet data for privately held US firms and indicates the level of
independ-ent verification of those financial statemindepend-ents (i.e., an audit, review, or compilation). While the
identity of the firms remains confidential, Sageworks assigns a unique identifier to each firm,
generating a panel dataset. This dataset is not ideal for our main analysis because the data are
primarily collected from accounting firms, not banks, creating a selection bias concern: firms are
included in the sample conditional on using an external accounting firm. Firms that stop using an
accounting firm would drop out of the sample, rather than be counted as an observation that
changed its reporting status. Bearing the potential limitations of the data in mind, the structure of
the data enables us to conduct analyses that control for firm-level characteristics and examine
within firm verification decisions over the boom period.
Table 6, Panel A provides descriptive statistics for the 30,706 firm-years (15,742 unique
firms) over the years 2002 to 2007 with valid values of leverage, profitability, and year-over-year
sales growth and with sales between $3 million and $25 million. The 16% audit rate in the
Sageworks sample is slightly higher than the RMA sample, as expected given that the sample is
collected from accounting firms. About 26% of the Sageworks sample consists of firms in the
24
We begin our firm-level analysis by replicating the results from Tables 3 and 5 to ensure
that our main results hold after controlling for firm characteristics and are not dataset specific. In
analyses tabulated in Table A4 of the online appendix, we find very similar results using the
Sageworks data after including controls for firm size (sales), profitability (ROA), leverage, and
growth (year-over-year sales growth). Specifically, audit propensity for construction firms
de-creased relative to other industries. The economic magnitude of the incremental reduction in
au-dits for construction firms (i.e., the coefficient on Trend×Construction) is approximately 1.5%
per year, slightly larger than the estimates using the RMA data. This effect is also larger in the
‘hot’ regions of the US, though with reduced statistical significance. These results corroborate our main analysis using an out of sample, level dataset that permits us to control for
firm-specific characteristics. Moreover, because the Sageworks data groups unqualified and qualified
audit opinions together, these results also provide a check to ensure our inferences are robust to
changes between these report types. In sum, construction firms substantially reduced their
pro-duction of audited financial statements relative to non-construction firms during the construction
boom years, even after conditioning on firm characteristics.
Next, we take advantage of the firm-level panel structure of the dataset to more explicitly
examine the mix of firm types over time. We take an approach similar to the Fama and French
(2001) dividend analysis. We first establish an audit likelihood model for each firm in the year
2003 and then predict the audit propensity for each firm in subsequent years using the parameters
of this model.27 The change in audit rates from 2003 to 2007 can then be partitioned into two ex-planations: changes in firm characteristics and changes in a firm’s propensity to get an audit conditional on its characteristics. We estimate the following parsimonious audit prediction model
for each firm j in year 2003, which includes industry indicators to account for differences in both
25 characteristics and audit propensities across industry:
1 _ 2 3
industry
j j j j j
Audit LN sales ROA Leverage . (3) Table 6, Panel B presents the results of estimating the probit audit prediction model for
firms in 2003. The coefficient on LN_sales (ROA) is significantly positive (negative) and the
sign on Leverage is insignificantly negative. We use the estimated parameters of this model to
predict which firms would have audits in each subsequent year. In Panel C, we report the results
partitioned by construction and non-construction firms. Interestingly, in each year after 2003 the
model predicts that audit rates would be slightly increasing for both construction and
non-construction firms given the mix of firm characteristics in each of the years during the
construc-tion boom period. In other words, the mix of firm characteristics suggests that, if anything, the
rate of auditing should have been increasing in the economy, not decreasing.
We then compare the predicted versus actual audit rates between construction and
non-construction firms. The model performs significantly worse for non-construction firms, consistent
with the hypothesis that the propensity for construction firms to receive audits, not the
observa-ble set of characteristics, explains the decline in financial verification during the housing boom.
In fact, the difference-in-difference estimate in 2007 of -3.4 percentage points (t-stat of -4.40
ac-counting for dependence in the errors at the industry level) is nearly identical to the
difference-in-difference estimates observed in the main analysis using the RMA data.28
In an alternative specification, we again follow Fama and French (2001) and use
portfoli-os of firms based on firm size, ROA, and leverage to predict audit propensity over time. Firm
size is defined as the three RMA sales size categories ($3-$5 million; $5-$10 million; $10-$25
28 In results tabulated in Table A5 of the online appendix, we also include firm growth as an audit predictor
(reduc-ing the sample size in 2003 by about two-thirds because it requires data from 2002). Again, we find similar results— the model predicts that audit rates would have been slightly increasing based on the mix of firms, and the model does substantially worse for construction firms in predicting actual audit rates.
26
million), while ROA and leverage are each based on annual quintiles, resulting in 75 total annual
portfolios of firms. Table 7 reports the number and percentage of construction firms in each
port-folio that receive an audit for 2003 and 2007. Consistent with the Table 6 results, the overall
sample rate of auditing decreased substantially from 17.6% to 11.7%. More interestingly, this
decrease occurred in two-thirds of the portfolios in 2007 (almost evenly distributed across each
of the three size categories), as shown by the shaded cells. If the mix of construction firms
changed, but the audit propensity within portfolio remained constant, the predicted audit rate
should have slightly increased to 18.3%, rather than decreased to 11.7%. Again, this result
high-lights that changes in audit propensity, not the mix of firm characteristics, are driving the results.
Finally, we examine firm-level decisions to terminate and initiate financial statement
au-dits year-over-year. In Table A6 of the online appendix, we find that during the years 2003 to
2007, construction firms elected to terminate their audits from one year to the next (again
con-trolling for size, profitability, leverage, and growth) at a rate 0.5 percentage points higher—or
30% more frequently than the sample base rate (t-stat of 2.53). At the same time, we find no
dif-ference in the decision to initiate audits between construction and non-construction firms. On
net, this evidence reveals that firm-level audit decisions were an important contributing factor in
the audit dynamics during the period of construction growth—construction firms actively
dropped their financial statement audits at a much higher rate than non-construction firms.
4.3.3. Audit supply side explanation
In this section we consider whether our results are driven by differential inelasticity in the
supply of auditors for construction firms relative to non-construction firms. Under this
explana-tion, the positive economic shock to the construction industry increased the demand for financing
inde-27
pendent auditors to verify their financial accounts. In the short run, auditors are in limited supply
and some friction exists such that this limited supply affects construction firms relative to
non-construction firms more severely and, thus, auditors cannot provide all of the services demanded
by construction firms. This alternative explanation suggests three related predictions: (1) the
number of construction firms getting audits does not decline, but the proportion does (i.e., not a
numerator effect); (2) audit services are concentrated in specialized service providers unable to
respond with additional supply and that this concentration is particularly acute for the
construc-tion industry; and (3) audit fees increase as a result of the demand shock for auditing and it
dif-ferentially affects construction audit pricing. We examine each of these predictions.
First, the supply-side inelasticity explanation suggests that construction demand for
au-dits increased and that audit firms simply could not supply all services that were needed. Thus, at
a minimum, the overall level of audit services would not be declining.29 Table 2, which reports
the number of firms receiving audits, suggests otherwise; during the housing boom, the number
of firms receiving audits actually decreases.
Second, to examine the possibility that accounting providers servicing the construction
industry were particularly concentrated, we use tax return data (described in detail in Section 5.2)
that report the name of the external paid preparer of the tax return. Although a paid preparer is
not necessarily equivalent to an auditor, there is overlap in this service (Klassen et al. 2016).
Therefore, examining the supply of paid preparers can provide some insight into the supply of
accounting professionals available to construction and non-construction firms. First, we find that
only 1.6% of construction firms self-prepared their tax return in 2008, compared to 3.4% of
29 This auditor supply side explanation suggests an outward shift in the demand curve with no shift of the supply