EEG synchrony analysis for early diagnosis of Alzheimer's
disease: A several synchrony measures and EEG data sets
The MIT Faculty has made this article openly available.
Please share
how this access benefits you. Your story matters.
Citation
Dauwels, J. et al. “EEG synchrony analysis for early diagnosis of
Alzheimer's disease: A study with several synchrony measures and
EEG data sets.” Engineering in Medicine and Biology Society, 2009.
EMBC 2009. Annual International Conference of the IEEE. 2009.
2224-2227. © 2009 Institute of Electrical and Electronics Engineers
As Published
http://dx.doi.org/10.1109/IEMBS.2009.5334862
Publisher
Institute of Electrical and Electronics Engineers
Version
Final published version
Citable link
http://hdl.handle.net/1721.1/52445
Terms of Use
Article is made available in accordance with the publisher's
policy and may be subject to US copyright law. Please refer to the
publisher's site for terms of use.
EEG Synchrony Analysis for Early Diagnosis of Alzheimer’s Disease: A
Study with Several Synchrony Measures and EEG Data Sets
Justin Dauwels, Franc¸ois Vialatte, Charles Latchoumane, Jaeseung Jeong, and Andrzej Cichocki
Abstract— It has frequently been reported in the medical
literature that the EEG of Alzheimer disease (AD) patients is less synchronous than in healthy subjects. In this paper, it is explored whether loss in EEG synchrony can be used to diagnose AD at an early stage. Multiple synchrony measures are applied to two different EEG data sets: (1) EEG of pre-dementia patients and control subjects; (2) EEG of mild AD patients and control subjects; the two data sets are from different patients, different hospitals, and obtained through different recording systems. It is observed that both Granger causality and stochastic event synchrony indicate statistically significant loss of EEG synchrony, for the two data sets; those two synchrony measures are then combined as features in linear and quadratic discriminant analysis (with crossvalidation), yielding classification rates of 83% and 88% for the pre-dementia data set and mild AD data set respectively. These results suggest that loss in EEG synchrony is indicative for early AD.
I. INTRODUCTION
Alzheimer’s disease (AD) is a neuro-degenerative disease, the most common form of dementia, third most expensive disease and sixth leading cause of death in the United States. It affects more than 10% of Americans over age 65, nearly 50% of people older than 85, and it is estimated that the prevalence of the disease will triple within the next 50 years [1].
While no known cure exists for Alzheimer’s disease, a number of medications are believed to delay the symptoms (and perhaps causes) of the disease. The progression of the disease can be categorized in four different stages. The first stage is known as Mild Cognitive Impairment (MCI), and corresponds to a variety of symptoms — most commonly amnesia — which do not significantly alter daily life. Be-tween 6 and 25% of people affected with MCI progress to AD every year. The next stages of Alzheimer’s disease (Mild and Moderate AD) are characterized by increasing cognitive deficits, and decreasing independence, culminating in the patient’s complete dependence on caregivers and a complete deterioration of personality (Severe AD) [2].
Early diagnosis of Alzheimer’s disease, and in particular diagnosis of MCI and Mild AD, is important for several reasons [3]:
• A positive diagnostic gives the patient and his family
time to inform themselves about the disease, to make
J. Dauwels is with the Laboratory for Information and Decision Systems (LIDS), Massachusetts Institute of Technology, Cambridge, MA, USA,
justin@dauwels.com
Franc¸ois Vialatte and Andrzej Cichocki are with the RIKEN Brain Science Institute, Wako-shi, Saitama, 351-0106, Japan.
Charles Latchoumane and Jaeseung Jeong are with KAIST, Dept of Bio and Brain Engineering, Daejeon, 305-701, South Korea.
life and financial decisions related to the disease, and to plan for the future needs and care of the patients.
• Current symptoms-delaying medications have a given
time frame during which they are effective. Early diagnosis of MCI helps ensure prescription of these medications when they are most useful.
Medical diagnosis of Alzheimer’s disease is hard, and symptoms are often dismissed as normal consequences of aging. Diagnosis is usually performed through a combination of extensive testing and eliminations of other possible causes. Psychological tests such as Mini Mental State Examina-tions (MMSE), blood tests, neurological examination, and increasingly, imaging techniques are used to help diagnose the disease [4].
Our approach is based on medical studies which show that many neurophysiological diseases (such as Alzheimer’s disease) are often associated with abnormalities in neural synchrony: in particular, it has frequently been reported that AD cause brain signals from different brain region [5] to become less correlated. Therefore, developing methods to reliably detect degradations in brain-signal coherence may help to diagnose AD.
In this paper we solely focus on electroencephalograms (EEGs), which are measurements of electrical activity pro-duced by the brain as recorded from electrodes placed on the scalp [6]. EEG recording systems are inexpensive and mobile, in constrast to other brain imaging systems such as MRI. Therefore, EEG analysis may potentially be used as a tool to screen a large number of people for risk of Alzheimer’s disease.
Several research groups have tried to diagnose early-stage AD by detecting perturbations in the synchrony of EEG signals (“EEG synchrony”) (see [7] for numerous refer-ences). However, in most existing studies, a single synchrony measure is applied to a single EEG data set. Since almost every study considers a different synchrony measure and a different EEG data set, it is hard to compare existing studies, and to assess whether loss of EEG synchrony is truly relevant for diagnosing AD.
In this paper, we apply a variety of synchrony measures to EEG data of MCI patients and mild AD (MiAD) patients. We determine which synchrony measures consistently indicate a statistically significant loss in EEG synchrony in those two groups of patients. In addition, we combine the most discriminative synchrony measures to separate MCI/MiAD patients from healthy subjects, through linear and quadratic discriminant analysis. This is probably one of the first studies that assesses multiple synchrony measures on multiple EEG
2224
31st Annual International Conference of the IEEE EMBS Minneapolis, Minnesota, USA, September 2-6, 2009
data sets of early-AD patients (MCI and MiAD), both in terms of statistical significance and discriminative power (determined through crossvalidation).
In an earlier study we applied multiple synchrony mea-sures to one data set (MCI patients), to study the statistical significance of EEG synchrony loss due to MCI [7]. In this paper, we will show that the (positive) results of [7] can be reproduced on EEG data of mild AD patients, recorded from different patients in a different hospital using a different EEG system; more precisely, two synchrony measures (Granger causality and stochastic event synchrony) indicate a statis-tically significant loss in EEG synchrony in MCI patients as well as MiAD patients. Those consistent and promising results suggest that loss in EEG synchrony may potentially be used as an indicator for the onset of AD.
This paper is structured as follows. In Section II we review the synchrony measures used in this paper. In Section III we describe our two EEG data sets (MCI and MiAD). In Section IV we describe our analysis and results, and at the end of the paper we offer some conclusions.
II. SYNCHRONYMEASURES
We briefly review the various families of synchrony mea-sures investigated in this paper: correlation coefficient, coher-ence, Granger causality, phase synchrony, state space based synchrony, and stochastic event synchrony; we describe those measures in much more detail in [7].
A. Correlation Coefficient
The correlation coefficient r is perhaps one of the most well-known measures for linear interdependence between two signals x and y. If x and y are not linearly correlated, r is close to zero; on the other hand, if both signals are identical, then r= 1 [6].
B. Coherence
The coherence function quantifies linear correlations in frequency domain. One distinguishes the magnitude square coherence function c(f ) and the phase coherence function φ(f ) [6].
C. Granger Causality
Granger causality1 refers to a family of synchrony mea-sures that are derived from linear stochastic models of time series; as the above linear interdependence measures, they quantify to which extent different signals are linearly interdependent. Non-linear extensions of Granger causality exist, but we do not consider them here since they are less common. Whereas the above linear interdependence measures are bivariate, i.e., they can only be applied to pairs of signals, Granger causality measures are multivariate, they can be applied to multiple signals simultaneously.
Suppose that we are given n signals X1(k), X2(k), . . . , Xn(k), each stemming from a different
channel. Those signals are modeled as a multivariate
1Granger causality measures are implemented in the BioSig library:
http://biosig.sourceforge.net/.
autoregressive (MVAR) model, which is a linear model that captures the statistical dependencies among the n signals. The Granger causality measures are defined in terms of coefficients of the MVAR model, both in time and frequency domain. Two symmetric Granger measures are:
• MVAR coherence |Kij(f )| ∈ [0, 1] describes the
amount of in-phase components in signals i and j at the frequency f .
• Partial coherence (PC) |Cij(f )| ∈ [0, 1] describes the
amount of in-phase components in signals i and j at the frequency f when the influence (i.e., linear dependence) of the other signals is statistically removed.
The following asymmetric (“directed”) Granger causality measures capture causal relations:
• Directed transfer function (DTF) γij2(f ) quantifies the
fraction of inflow to channel i stemming from channel j.
• Full frequency directed transfer function (ffDTF)
Fij2(f ) △ = |Hij(f )| 2 P f Pm j=1|Hij(f )|2 ∈ [0, 1], (1)
is a variation of γij2(f ) with a global normalization in
frequency.
• Partial directed coherence (PDC) |Pij(f )| ∈ [0, 1]
represents the fraction of outflow from channel j to channel i.
• Direct directed transfer function (dDTF) χ2ij(f ) △
= Fij2(f )Cij2(f ) is non-zero if the connection between
channel i and j is causal (non-zero Fij2(f )) and direct
(non-zero Cij2(f )). D. Phase Synchrony
Phase synchrony refers to the interdependence between the instantaneous phases φx and φy of two signals x and y;
the instantaneous phases may be strongly synchronized even when the amplitudes of x and y are statistically independent. The instantaneous phase φx of a signal x may be extracted
as [9]:
φx(k)= arg [x(k) + i˜△ x(k)] , (2)
wherex is the Hilbert transform of x. The phase synchrony˜ index γ for two instantaneous phases φx and φy is defined
as [9]:
γ=
ei(nφx−mφy)
∈ [0, 1], (3) where n and m are integers (usually n= 1 = m).
E. State Space Based Synchrony
State space based synchrony (or “generalized synchroniza-tion”) evaluates synchrony by analyzing the interdependence between the signals in a state space reconstructed domain. The central hypothesis behind this approach is that the signals at hand are generated by some (unknown) non-linear dynamical system. We consider three state space based synchrony measures: Sk, Hk, and Nk [10]2.
2Matlab code of Sk , Hk , and Nk is available from http://www.vis.caltech.edu/˜rodri/software.htm 2225
F. Stochastic Event Synchrony (SES)
Stochastic event synchrony (SES), a family of interdepen-dence measures that we developed in earlier work [11], [12], [13], describes the similarity between point processes. Here we apply SES to point processes extracted from the time-frequency transforms of the EEG signals; more specifically, we apply the pairwise SES measures. As a first step, the time-frequency transform of each EEG signal is approximated as a sum of (half-ellipsoid) basis functions, referred to as “bumps” (see [14])3. The resulting bump models,
represent-ing the most prominent oscillatory activity, are then aligned4:
bumps in one time-frequency map may not be present in the other map (“non-coincident bumps”); other bumps are present in both maps (“coincident bumps”), but appear at slightly different positions on the maps.
Stochastic event synchrony (SES) consists of five param-eters that quantify the alignment of two bump models:
• ρ: fraction of non-coincident bumps,
• δt and δf: average time and frequency offset
respec-tively between coincident bumps,
• st and sf: variance of the time and frequency offset
respectively between coincident bumps.
The parameters ρ and st are the most relevant for the
present study, since they quantify the synchrony between bump models (and hence, the original time-frequency maps); low ρ and st implies that the two time-frequency maps at
hand are well synchronized. For more details on SES, we refer to [11], [12], [13].
III. EEG DATASETS
A. Data Set 1: MCI and Control
The first EEG data set comprises two study groups. The first consists of 25 patients who had complained of memory problems. These subjects were diagnosed as suffering from mild cognitive impairment (MCI) and subsequently devel-oped mild AD (MiAD). The EEG recordings were conducted while all patients were in the MCI stage. The criteria for inclusion into the MCI group were a mini mental state exam (MMSE) score = 24, though the average score in the MCI group was 26 (SD of 1.8). The other group is a control set consisting of 56 age-matched, healthy subjects who had no memory or other cognitive impairments. The average MMSE of this control group is 28.5 (SD of 1.6). The ages of the two groups are 71.9± 10.2 and 71.7 ± 8.3, respectively.
We provide some more details in the recording setup. Ag/AgCl electrodes (disks of diameter 8mm) were placed on 21 sites according to 1020 international system, with the reference electrode on the right ear-lobe. EEG was recorded with Biotop 6R12 (NEC San-ei, Tokyo, Japan) at a sampling rate of 200Hz, with analog bandpass filtering in the frequency range 0.5-250Hz and online digital bandpass filtering between 4 and 30Hz, using a third-order Butterworth
3Software for bump modeling is available from
http://www.bsp.brain.riken.jp/˜fvialatte/bumptoolbox/toolbox home.html.
4Matlab code of the SES measures can be downloaded from
http://www.dauwels.com/SESToolbox/SES.html.
filter (forward and reverse filtering). We used a common reference for the data analysis (right ear-lobe), and did not consider other reference schemes (e.g., average or bipolar references).
B. Data Set 2: Mild AD and Control
The second EEG data set consists of 24 healthy control subjects (age: 69.4± 11.5 years old; 10 males) and 17 patients with mild AD (age: 77.6 ± 10.0 years old; 9 males) [15]. The patient group underwent full battery of cognitive tests (Mini Mental State Ex- amination, Rey Au-ditory Verbal Learning Test, Benton Visual Retention Test, and memory recall tests). The EEG time series were recorded using 19 electrodes positioned according to Maudsley sys-tem, similar to the 10-20 international syssys-tem, at a sampling frequency of 128 Hz. EEGs were band-pass filtered with digital third-order Butterworth filter (forward and reverse filtering) between 4 and 30 Hz.
C. Recording Conditions Common to Both Data Sets
In both data sets, all recording sessions were conducted with the subjects in an awake but resting state with eyes closed, and the length of the EEG recording was about 5 minutes, for each subject. Only those subjects were retained in the analysis whose EEG recordings contained at least 20s of artifact-free data. Based on this requirement, the number of subjects of EEG Data Set 1 was further reduced to 22 MCI patients and 38 control subjects; in EEG Data Set 2 no such reduction was required. From each subject in the two data sets, one artifact-free EEG segment of 20s was analyzed.
IV. RESULTS
We investigate whether there are statistically significant differences in average EEG synchrony between early-AD patients (MCI and MiAD) and control subjects (see [7] for technical details on the computation of average EEG synchrony). To this end, we apply the Mann-Whitney test to the average EEG synchrony values of MCI/MiAD patients and control subjects. In particular, we conduct a Mann-Whitney test for each individual synchrony measure, each approach to compute the synchrony measures (see [7]), and each parameter setting, e.g., different EEG segment length L; we follow the same approach as in [7]. The results are displayed in Table I.
Since we consider many different synchrony measures, various approaches to compute those measures (see [7]), and many different parameter settings simultaneously, the p-values need to be appropriately corrected. We correct the p-values in two steps (see [7]): first we treat each synchrony measure separately, and correct for the multiple parameter settings and computational approaches; we retain the smallest p-value for each synchrony measure. Then we correct the resulting p-values for the multiple measures. As a result, we obtain one (corrected) p-value for each synchrony measure and for each data set. The p-values that remain significant after post-correction are marked in Table I: interestingly, both Granger causality (full frequency DTF) and stochastic event
Measure MCI vs. Control MiAD vs. Control Correlation 0.025∗ 0.78 Coherence 0.029∗ 0.0085∗† Phase Coherence 0.051 0.42 MVAR coherence 0.15 0.20 Partial Coherence 0.16 0.50 PDC 0.60 0.0085∗ DTF 0.34 0.0019∗∗† ffDTF 0.0012∗∗† 0.0001∗∗† dDTF 0.030∗ 0.013∗ Nk 0.029∗ 0.40 Sk 0.045∗ 0.0013∗∗† Hk 0.052 0.16 Hilbert Phase 0.96 0.53 st 0.051 0.0040∗∗ ρ 0.00044∗∗† 0.0024∗∗† TABLE I
SENSITIVITY OF AVERAGEEEGSYNCHRONY FOR PREDICTION OFMCI (DATASET1):UNCORRECTED P-VALUES FORMANN-WHITNEY TEST; *
AND**INDICATEp < 0.05ANDp < 0.005RESPECTIVELY; †INDICATES P-VALUES THAT REMAIN SIGNIFICANT AFTER POST-CORRECTION.
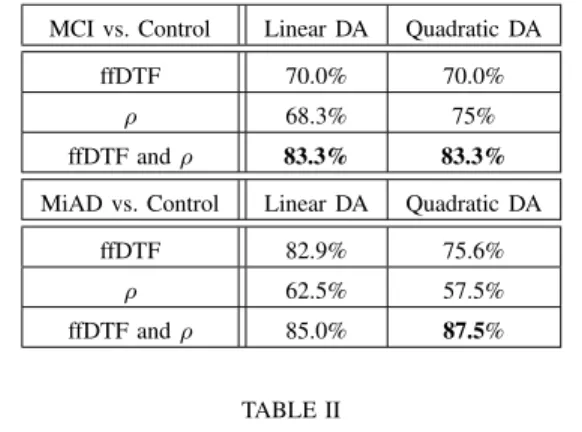
synchrony (ρ) yield significant differences in both data sets. The significance level is chosen sufficiently low so that the expected number of false positives is smaller than one. In the mild AD data set, some additional synchrony measures yield statistically significant results; this is not surprising since mild AD is a more advanced stage of AD than pre-dementia. In addition to the tests of statistical significance, we investigate whether loss of EEG synchrony allows us to sepa-rate MCI/MiAD patients from age-matched control subjects. Using full frequency DTF and ρ, we conduct linear and quadratic discriminant analysis with leave-one-out crossvali-dation; the results are summarized in Table II. Interestingly, ρ is most discriminative for MCI and much less for Mild AD, whereas full frequency DTF is strongly discriminative for Mild AD, but less for MCI. The best classification results are obtained for the Mild AD data set, as expected. Other pairs of features lead to better classification results on the MiAD data set, but perform substantially worse on the MCI data set.
V. CONCLUSIONS
This study demonstrates the discriminative power of EEG synchrony loss to diagnose AD at an early stage. We verified that the results we obtained earlier for MCI patients [7] carry over to miAD patients; more precisely, the two synchrony measures that yielded statistically significant results (after postcorrection, see [7]) for EEG data of MCI patients, i.e., ffDTF and ρ, also yield significant results for EEG data of MiAD patients. In the future, we will analyze additional data sets to verify our results. In addition, it seems to be promising
MCI vs. Control Linear DA Quadratic DA ffDTF 70.0% 70.0%
ρ 68.3% 75% ffDTF and ρ 83.3% 83.3%
MiAD vs. Control Linear DA Quadratic DA ffDTF 82.9% 75.6%
ρ 62.5% 57.5% ffDTF and ρ 85.0% 87.5%
TABLE II
CLASSIFICATION RATES FOR DISCRIMINANT ANALYSIS(DA)OF FULL-FREQUENCYDTFANDρ,DETERMINED THROUGH
LEAVE-ONE-OUT CROSSVALIDATION.
to combine synchrony measures with other EEG features, e.g., spectral features.
REFERENCES
[1] Mattson M., 2004. Pathways towards and away from Alzheimer’s disease. Nature Vol. 430.
[2] Shimokawa A., Yatomib N., Anamizuc S., Toriid S., Isonod H., Sugaid Y. and Kohnoe M., “Influence of Deteriorating Ability of Emotional Comprehension on Interpersonal Behavior in Alzheimer-Type Demen-tia”, Brain and Cognition, Volume 47, Issue 3 pp 423-433, 2001. [3] Ballard C. , Lana MM., Theodoulou M. et al, “A Randomised, Blinded,
Placebo-Controlled Trial in Dementia Patients Continuing or Stopping Neuroleptics (The DART-AD Trial)” PLoS Med. 5 (4), 2008. [4] Palmer K., Berger AK., Monastero R., Winblad B., BŁckman L.
and Fratiglioni L., “Predictors of progression from mild cognitive impairment to Alzheimer disease”, Neurology 68 (19): 1596–1602, 2007.
[5] J. Jeong, “EEG Dynamics in Patients with Alzheimer’s Disease,”
Clinical Neurophysiology, 115:1490–1505 (2004).
[6] P. Nunez and R. Srinivasan, Electric Fields of the Brain: The
Neuro-physics of EEG,Oxford University Press, 2006.
[7] J. Dauwels, F. Vialatte, and A. Cichocki, “A Comparative Study of Synchrony Measures for the Early Diagnosis of Alzheimer’s Dis-ease Based on EEG,” NeuroImage, under revision. Available from
http://www.dauwels.com/files/NeuroImage2009.pdf
[8] M. Kami´nski and Hualou Liang, “Causal Influence: Advances in Neurosignal Analysis,” Critical Review in Biomedical Engineering, 33(4):347–430 (2005).
[9] J.-P. Lachaux, E. Rodriguez, J. Martinerie, and F. J. Varela, “Measuring Phase Synchrony in Brain Signals,” Human Brain Mapping 8:194–208 (1999).
[10] R. Q. Quiroga, A. Kraskov, T. Kreuz, and P. Grassberger, “Perfor-mance of Different Synchronization Measures in Real Data: A Case Study on EEG Signals,” Physical Review E, vol. 65, 2002.
[11] J. Dauwels, F. Vialatte, T. Rutkowski, and A. Cichocki, “Measuring neural synchrony by message passing,” Advances in Neural Information
Processing Systems 20 (NIPS 20),2008, in press.
[12] J. Dauwels, F. Vialatte, T. Weber, and A. Cichocki, “Quantifying Statistical Interdependence by Message Passing on Graphs, Part I: One-Dimensional Point Processes,” Neural Computation, 2009, in press. [13] J. Dauwels, F. Vialatte, T. Weber, T. Musha, and A. Cichocki,
“Quan-tifying Statistical Interdependence by Message Passing on Graphs, Part II: Multi-Dimensional Point Processes,” Neural Computation, 2009, in press.
[14] F. Vialatte, C. Martin, R. Dubois, J. Haddad, B. Quenet, R. Gervais, and G. Dreyfus, “A Machine Learning Approach to the Analysis of Time-Frequency Maps, and Its Application to Neural Dynamics,”
Neural Networks,2007, 20:194–209.
[15] G. Henderson, E. Ifeachor, N. Hudson, C. Goh, N. Outram, S. Wimalaratna, C. Del Percio, and F. Vecchio, “Development and assessment of methods for detecting dementia using the human elec-troencephalogram,” IEEE Trans. Biom. Eng. 53, 2006.