HAL Id: hal-03019034
https://hal.archives-ouvertes.fr/hal-03019034
Submitted on 23 Nov 2020
HAL is a multi-disciplinary open access
archive for the deposit and dissemination of
sci-entific research documents, whether they are
pub-lished or not. The documents may come from
teaching and research institutions in France or
abroad, or from public or private research centers.
L’archive ouverte pluridisciplinaire HAL, est
destinée au dépôt et à la diffusion de documents
scientifiques de niveau recherche, publiés ou non,
émanant des établissements d’enseignement et de
recherche français ou étrangers, des laboratoires
publics ou privés.
Substrate spatial heterogeneity reduces soil microbial
activity
Andong Shi, Arjun Chakrawal, Stefano Manzoni, Benjamin Fischer, Naoise
Nunan, Anke Herrmann
To cite this version:
Andong Shi, Arjun Chakrawal, Stefano Manzoni, Benjamin Fischer, Naoise Nunan, et al.. Substrate
spatial heterogeneity reduces soil microbial activity. Soil Biology and Biochemistry, Elsevier, 2021,
�10.1016/j.soilbio.2020.108068�. �hal-03019034�
Soil Biology and Biochemistry 152 (2021) 108068
Available online 18 November 2020
0038-0717/© 2020 The Authors. Published by Elsevier Ltd. This is an open access article under the CC BY license (http://creativecommons.org/licenses/by/4.0/).
Substrate spatial heterogeneity reduces soil microbial activity
Andong Shi
a,*, Arjun Chakrawal
b,c, Stefano Manzoni
b,c, Benjamin M.C. Fischer
d,
Naoise Nunan
a,e, Anke M. Herrmann
aaDepartment of Soil and Environment, Swedish University of Agricultural Sciences, 75007, Uppsala, Sweden bDepartment of Physical Geography, Stockholm University, 10691, Stockholm, Sweden
cBolin Centre for Climate Research, Stockholm University, 10691, Stockholm, Sweden dDepartment of Earth Science, Uppsala University, 75236, Uppsala, Sweden
eSorbonne Universit´e, CNRS, IRD, INRA, P7, UPEC, Institute of Ecology and Environmental Sciences—Paris, 4 place Jussieu, Paris, 75005, France
A R T I C L E I N F O Keywords:
Carbon cycling models Diffusion
Heat dissipation Scale transition theory Spatial heterogeneity Spatial homogeneity
A B S T R A C T
Soil heterogeneity influences microbial access to substrates and creates habitats varying in substrate concen-trations, thus leading to local variations in carbon (C) dynamics. Based on theoretical considerations, we ex-pected that higher heterogeneity would decrease microbial activity. To test this hypothesis, we modified substrate spatial heterogeneity using 3D-printed cylinders with four compartments (either preventing or allowing diffusion between compartments). The same total amount of glucose (1.5 mg glucose C per cylinder) was added either to one compartment (highest local concentration, 2.0 mg glucose C g−1
soil, and highest heterogeneity), to two (medium concentration, 1.0 mg glucose C g−1 soil, and intermediate heterogeneity), or to four compartments
(lowest local concentration, 0.5 mg glucose C g−1 soil, and equivalent to homogeneous conditions). Thus, we
experimentally created a gradient of substrate spatial heterogeneity. The 3D cylinders containing soil were transferred into standard calorimetry ampoules and were incubated in isothermal calorimeters to monitor soil heat dissipation rates as a proxy of soil microbial activity over 51 h at 18 ◦C. When diffusion among
compart-ments was prevented, the most heterogeneous treatment showed the lowest heat dissipation rates, despite having the highest local substrate concentration. Compared to homogeneous conditions, the heat dissipation rate from the most heterogeneous treatment was 110% lower at the beginning of the experiment (12.7 μJ g−1
soil s−1
) and 50% lower when heat dissipation rates reached a peak (72.6 μJ g−1 soil s−1). Moreover, the peak was delayed by
approximately 2 h compared to the most homogeneous treatment. When diffusion among compartments was allowed, the effect of substrate spatial heterogeneity on microbial activity was strongly diminished. Our findings emphasize the influence of substrate spatial heterogeneity on soil microbial dynamics, highlighting the impor-tance of including it in C cycling models for a better understanding of soil C dynamics.
1. Introduction
Soil microbial communities are critical players in regulating soil C fluxes and the associated feedbacks to the climate system (Phillips and Nickerson, 2015). Microbial communities are C limited, despite being able to feed on soil organic matter (Gallardo and Schlesinger, 1994;
Scheu and Schaefer, 1998; Reischke et al., 2014). This apparent contradiction may be due to the heterogeneous soil matrix where soil microbial communities reside (Lammel et al., 2019), in which a large fraction of the organic matter is inaccessible (physical separation, adsorption to mineral surfaces or encapsulation in microaggregates – (von Lützow et al., 2006)). The heterogeneous nature of soils is caused
by the arrangement of minerals, organic matter, water and gas, which creates different microbial habitats varying in size, hence differing in substrate accessibility and availability (Cernohl´avkov´a, 2009ˇ ; Nunan, 2017; Nunan et al., 2020).
The physical disconnection between decomposers and substrates has been proposed to contribute to organic matter persistence in soil (Dungait et al., 2012; Schlüter et al., 2019; Lehmann et al., 2020). Also, the widespread C limitation of microbial communities suggests that decomposers are not in proximate contact with potentially available substrates. Earlier studies supported this view by showing a reduction in decomposition with increasing distance between decomposers and substrates (Gaillard et al., 1999; Korsaeth et al., 2001). Similarly,
* Corresponding author.
E-mail address: [email protected] (A. Shi).
Contents lists available at ScienceDirect
Soil Biology and Biochemistry
journal homepage: http://www.elsevier.com/locate/soilbio
https://doi.org/10.1016/j.soilbio.2020.108068
Soil Biology and Biochemistry 152 (2021) 108068
2
Pinheiro et al. (2015) found that the co-localization of microbial de-composers and pesticide 2,4-dichlorophenoxyaectic acid (2,4-D) played a critical role in regulating its degradation, and simulations showed a decrease in the degradation rate of 2,4-D with increasing distance be-tween decomposer and substrate (Babey et al., 2017). These findings imply that substrates should be in the vicinity of microbial cells for the latter to successfully take them up, decompose or convert them into biomass (Pallud et al., 2004; Lehmann et al., 2020). Although the in-fluence of substrate accessibility on microbial decomposition has been studied, we still do not know how accessibility combined with other factors, such as substrate concentration, affects microbial activity.
Substrate concentration varies substantially in soils, ranging from hot spots with a high concentration in the rhizosphere and detritusphere (Marschner et al., 2012; Kuzyakov and Blagodatskaya, 2015) to loca-tions deprived of nutrients (i.e., cold spots). Evidence from laboratory studies has shown that substrate utilization and microbial growth do not scale linearly with higher concentrations of substrates because dimin-ishing returns and other limiting factors at high concentrations cause the growth-concentration relationship to saturate (Monod, 1949; Boddy et al., 2008; Cernohl´avkov´a, 2009ˇ ). The influence of both substrate
accessibility and concentration on microbial communities leads to the spatial heterogeneity of substrate distribution and utilization. Two end-member scenarios can be envisioned to characterize the effects of heterogeneities on microbial communities: 1) hot spots with high con-centrations of substrates in close contact with microbes, which promote microbial activity; and 2) cold spots with low substrate concentrations that harbor microbial communities with minimal activity (Ruiz et al., 2020). Naturally, various scenarios between these two extreme cases can occur. Therefore, it is crucial to take into account substrate spatial heterogeneity that considers both accessibility as well as concentration in order to understand how soil microbial communities are influenced. Such an investigation may provide a better understanding of how ecosystem C fluxes respond to variations in heterogeneity.
Furthermore, it has been suggested that a ‘passively waiting’ approach, rather than actively foraging (due to the low investment re-turn on energy expenditure), is the preferred nutrient acquisition strategy of soil prokaryotes (Nunan et al., 2020). Dechesne et al. (2010)
found a sharp decrease in bacterial motility after only a small fluctuation in moisture (− 0.5 to − 2.0 kPa), which also suggests that the ‘passive waiting’ strategy could be the only option for bacteria in unsaturated conditions. Furthermore, it has been estimated that less than 10−6% of
total soil surface area is covered by soil microbes (Young and Crawford, 2004), indicating that the probability of microbes meeting their nutrient demand is low. This finding also supports the paradigm that most soil microorganisms remain inactive most of the time (Kuzyakov and Bla-godatskaya, 2015), which in turn partially explains the persistence of C in soil. While this evidence points to the important role of substrate spatial heterogeneity (by integrating both accessibility and concentra-tion) on soil microbial activity, so far, there is no systematic investiga-tion of these effects.
The investigation of the effects of substrate spatial heterogeneity on soil microbial activity poses great challenges (Nunan, 2017) and is difficult to achieve directly, especially when considering how soil sub-strates are accessed and assimilated by microbial communities. In C cycling models, the role of substrate spatial heterogeneity is seldom accounted for (Tang and Riley, 2019; Chakrawal et al., 2020). Typically, these models assume that the same decomposition kinetics apply to both homogeneous and heterogeneous conditions (Chakrawal et al., 2020), despite the impact of substrate accessibility on microbial degradation of organic matter (Vogel et al., 2015; Babey et al., 2017; Nunan et al., 2020). Mathematically, the role of spatial heterogeneity in C cycling models could be included via ‘scale transition theory’ (Chakrawal et al., 2020). This theory was originally applied in ecology to study the dy-namics of population densities at different spatial scales (Chesson, 1998,
2012). Scale transition theory described the effects of spatial heteroge-neity in substrate concentration on C fluxes (Chakrawal et al., 2020),
thus explaining the differences in observable decomposition rates be-tween homogeneous and heterogeneous conditions. In essence, as demonstrated by Chesson (1998; 2012), the heterogeneous distribution of substrates causes the observed decomposition rates to be smaller than they would be under homogeneous conditions, even when substrate amounts are the same. Mathematically, the decomposition rate in het-erogeneous conditions is quantified as the sum of the rate attained under homogeneous conditions (at the same mean substrate concentration as in the heterogeneous conditions) and ‘correction’ terms that account for heterogeneity. Such ‘correction’ terms are comprised of the spatial variance of the substrate concentration (always positive), multiplied by the curvature of the decomposition rate-substrate concentration relation (always negative for Monod type kinetics) (for more details, see section
2.4 and Chakrawal et al. (2020)). Therefore, the most important feature of the ‘correction’ terms is that they are negative and proportional to the substrate spatial variability, thus resulting in the lower decomposition rate in heterogeneous, as compared to homogeneous conditions.
Based on the evidence presented above and the theoretical pre-dictions of scale transition theory, we tested three specific hypotheses on the effect of substrate spatial heterogeneity on microbial activity: i) soil microbial activity is lower under heterogeneous than under homoge-nous conditions for a given total amount of supplied C; ii) the larger the heterogeneity, the lower the microbial activity, and iii) microbial ac-tivity will be closer to that of a homogeneous system when the substrate concentration gradients are reduced by diffusion. To test these hy-potheses, we manipulated the substrate spatial heterogeneity (via the modification of substrate accessibility and concentration) using 3D- printed cylinders comprised of four compartments of equal volume. The same amount of substrate was added to each cylinder, but the substrate concentration in each compartment varied. In doing so, we generated a gradient of substrate spatial heterogeneities, ranging from the most heterogeneous (‘extremely patchy’, where only one compart-ment received substrate with the highest concentration) to the most homogeneous treatment (‘well-mixed’ condition, where four compart-ments received the same amount of substrate). This allowed us to investigate the direct role of substrate spatial heterogeneity on soil mi-crobial activities. In this study, soil mimi-crobial activity was determined as the heat dissipation rate using isothermal calorimetry. This approach was chosen because dissipated heat integrates microbial catabolism and anabolism and is therefore a more complete measure of activity than soil respiration (Herrmann et al., 2014).
2. Material and methods
2.1. Soil
Soil samples (5–15 cm) were taken at the Pilmore soil cultivation experiment in October 2014, (56◦27ʹ N, 03◦04ʹ W, The James Hutton
Institute, Dundee, U.K.) on a free-drained Dystric-Fluvic Cambisol (WRB, 2006) with a sandy loam texture (Griffiths et al., 2010; B¨olscher et al., 2017). The site has a maritime climate with an average annual air temperature of 8.3 ◦C and a precipitation of 720 mm (30 years average)
(Ghee et al., 2013). Soils from plots without any amendment were used with the following basic soil characteristics: soil organic C content: 2.7%, total N content: 0.2%, C/N ratio: 12.7, pH: 5.1, microbial biomass C: 182 mg C kg−1 soil, and maximum water-holding capacity (WHC):
583 g kg−1 soil (B¨olscher et al., 2017). We aimed to understand the
fundamental role of substrate spatial heterogeneity and accessibility on soil microbial activity at high precision, hence it was necessary to minimize variations among field replicates. Therefore, a representative soil sample was achieved by pooling soils from three field replicates together. Fresh soil samples were passed through a 2 mm sieve, and visible plant material and macrofauna were manually removed. The soil was maintained at such moisture content (52% WHC) and kept frozen at − 20 ◦C until use. Prior to the start of the experiment, the soil was thawed
and pre-incubated for 10 days at same moisture content at approx. 20 ◦C.
2.2. Experimental design and incubation set-up
We tested the effects of substrate spatial heterogeneity on microbial activities by introducing a gradient of substrate accessibility and con-centration using a custom-made cylinder (diameter 1.5 cm, height 2.4 cm) which consists of a solid inner cross to divide the system into four compartments of equal volume (Fig. 1). The cylinder was designed in Fusion 360 (Fusion360, 2019, Autodesk, USA), sliced in Cura v4.1.0 (Ultimaker, the Netherlands), and printed using an Ultimaker S3 3D- printer with a 0.4 mm nozzle (Ultimaker, the Netherlands). Polylactic acid (PLA) filament ∅ 2.85 mm (Ultimaker, the Netherlands) was chosen due to its print reliably, dimensional accuracy, and quality of the surface finish to print cylinders. A preliminary test with 3D cylinder alone in standard 20 ml calorimetry reaction ampoules (made of high density poly ethylene-HDPE) found no interferences with heat signals. The 3D designs in .stl file format are shared in a separate file.
After the pre-incubation, 0.75 g soil per compartment, equal to 3 g soil in total (dry weight equivalent), was weighed into the 3D cylinder. The substrate solution was added in such a way as to create a gradient of heterogeneities: a total amount of 1.5 mg glucose C was added either to a single compartment (equivalent to 2.0 mg glucose C g−1 soil and
referred to as 100%), to two compartments (equivalent to 1.0 mg glucose C g−1 soil and referred to as 50%), or to all four compartments
(equivalent to 0.5 mg glucose C g−1 soil and referred to as 25%) (see Table 1). An equal volume of MQ water was added to the remaining compartments in order to obtain the same WHC in all compartments. Hence, the gradient of heterogeneities varied from the most heteroge-neous (100-0-0-0%), intermediate heterogeheteroge-neous (50-50-0-0% and 50- 0-50-0%), to the most homogeneous treatment (25-25-25-25%) (Fig. 1). The different concentrations (0.5, 1.0 and 2.0 mg glucose C g−1 soil)
were chosen because a preliminary experiment carried out under the same conditions showed that microbial activities reached a peak at similar times and without reaching a plateau with increasing substrate concentration (Reischke et al., 2014), as compared to other concentra-tions (0.05, 0.1, 0.2 and 4.0 mg glucose C g−1 soil, Fig. S1, based on our
previous study (Shi and Marschner, 2017)). A control treatment, to which only MQ water was added, was also included. All solution addi-tions brought the soil moisture content up to 65% WHC. The cylinders containing soil were then transferred to standard 20 ml reaction vessels (three replicates per treatment) and introduced into an isothermal calorimeter (TAM Air, TA Instruments, Sollentuna, Sweden). Soil heat dissipation rates (μJ g−1 soil s−1) were monitored over 51 h at 18 ◦C and
averaged at the interval of 5 min, and cumulative heat dissipated (J g−1
soil) was also calculated.
In order to evaluate the diffusion of spatially heterogeneous sub-strates on microbial activities, the experiment was repeated in another set of cylinders of the same size. Instead of a solid inner cross, a cross- shaped mesh (consisting of holes with ∅ 0.6 mm) to divide the system into different compartments (equal volume each) and allow substrate diffusion between compartments (Fig. 1, right panel). We assumed that the diffusion would be minimal or negligible in the most homogeneous treatment (25-25-25-25%) due to similar substrate concentrations in each compartment. The diffusion was assumed to be maximal in the treatment of 100-0-0-0%, because of the largest concentration gradient between the compartment receiving substrate and two compartments nearby.
2.3. Evaluation of spatial heterogeneity and approximation of substrate diffusion time
To illustrate the influence of spatial heterogeneity on soil microbial activity, the differences in heat dissipation rates and cumulative heat dissipated among heterogeneous and homogeneous treatments were calculated as follows:
Heterogeneity effects = Rheterogeneous treatments− Rhomogeneous treatment (1)
where R represents either soil heat dissipation rate (μJ g−1 soil s−1) or Fig. 1. Experimental schedule of the influence of
substrate spatial heterogeneity on soil microbial activity (left panel), including control treatment with MQ water addition, and treatments with the most homogenous (25-25-25-25%), intermediate heterogeneous (50-50-0-0% and 50-0-50-0%) and the most heterogeneous substrate (100-0-0-0%) in custom-designed cylinders with solid inner cross to divide the system into equal volume of each compartment with no diffusion (a) and with
diffusion (b) between compartments. Substrate
concentrations at 25, 50 and 100% were 0.5, 1.0 and 2.0 mg glucose C g−1 soil, respectively; thus,
the same amount of substrate was applied per treatment. Diffusion of the substrate between compartments was feasible in (b) by printing a cross-shaped inner mesh (mesh consisting of holes with ∅ 0.6 mm), as also indicated by double- headed arrows in blue color. Arrow with solid and dashed line indicate affirmative and possible diffusion, respectively.
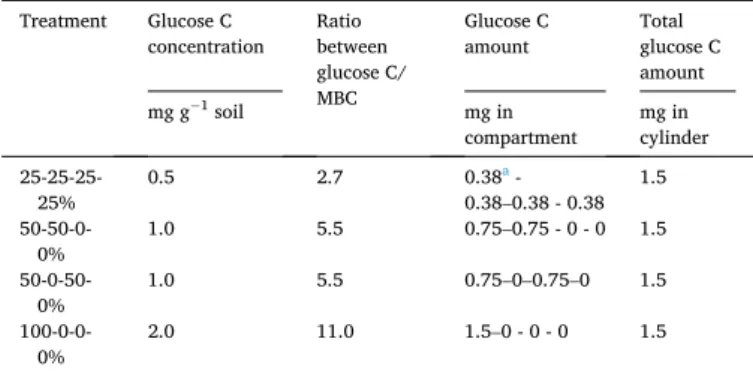
Table 1
Glucose C concentration, the ratio between glucose C and microbial biomass C (MBC), the amount of glucose C in each compartment of cylinder (equal volume) and the total amount of glucose C in each cylinder in treatments with the most homogenous (25-25-25-25%), intermediate heterogeneous (50-50-0-0% and 50- 0-50-0%) and the most heterogeneous substrate (100-0-0-0%).
Treatment Glucose C
concentration Ratio between glucose C/ MBC
Glucose C
amount Total glucose C amount mg g−1 soil mg in compartment mg in cylinder 25-25-25- 25% 0.5 2.7 0.38 a - 0.38–0.38 - 0.38 1.5 50-50-0- 0% 1.0 5.5 0.75–0.75 - 0 - 0 1.5 50-0-50- 0% 1.0 5.5 0.75–0–0.75–0 1.5 100-0-0- 0% 2.0 11.0 1.5–0 - 0 - 0 1.5 a The value of 0.38 is rounded to two places after the decimal.
Soil Biology and Biochemistry 152 (2021) 108068
4 cumulative heat dissipated (J g−1 soil). The larger the value, the higher
is the effect of substrate spatial heterogeneity on soil microbial activity, compared to the homogeneous treatment.
Moreover, to evaluate the influence of diffusion on microbial activ-ity, we calculated the differences in heat dissipation rates and cumula-tive heat dissipation between the systems with and without diffusion.
Diffusion effects = RWith diffusion− RWithout diffusion (2)
The larger the value, the higher is the effect of diffusion for the specific treatment.
In the system with substrate diffusion, we estimated the character-istic time scale (T) required for glucose to diffuse from the compartment amended with glucose to the nearby compartment without amendment. This first-order approximation of the diffusion time follows dimensional arguments based on the definition of diffusivity as the ratio of a char-acteristic length squared over a charchar-acteristic time. As a result, T is found as follows,
T =d
2
D (3)
where the characteristic length d is, in our case, the distance between the centers of nearby compartments (0.65 cm), and D represents the diffu-sivity in the soil medium. To calculate D under unsaturated conditions, we used Archie’s law (Hamamoto et al., 2010),
D = D0×n1.5× (Θ
n
)2
(4) where D0 is the diffusivity of glucose in pure water (approximately 6.0
×10−10 m2 s−1) at 20 ◦C (Stein, 1990), n is the soil porosity (0.53), and
Θ is the volumetric water content (0.47), and is obtained from the
gravimetric water content, given a soil bulk density of 1.25 g cm−3
(Griffiths et al., 2010), and assuming a particle density of 2.65 g cm−3.
2.4. Scale transition theory
Organic C dynamics in heterogeneous conditions differ from those in homogeneous conditions when the decomposition kinetics is non-linear, such as in the case of the microbial response to substrate concentration (Chakrawal et al., 2020). The difference is due to the fact that averaging a non-linear response function of substrate concentration is not the same as evaluating the response function at the average substrate concen-tration. To proceed and quantify microbial responses in heterogeneous systems, scale transition theory can be applied, as it allows correctly averaging non-linear kinetics, by taking into account the substrate spatial heterogeneity. The theory involves three steps: 1) defining the dynamics in the homogeneous system; 2) defining the nature of het-erogeneity; and 3) using scale transition theory to derive the dynamics in the heterogeneous system. Here, the theory is used to interpret heat dissipation rates, instead of population dynamics for which the theory was originally proposed (Chesson, 1998, 2012) or C fluxes (Chakrawal et al., 2020).
For the first step, we assumed a concave-downward function for the microbial response (in terms of heat dissipation rate) to glucose con-centration. For this reason, a Monod function is a choice for demon-stration (Monod, 1949; Liu, 2007), but the qualitative predictions of the theory are not affected by the specific shape of this function, as long as it is concave downward. Accordingly, the heat dissipation rate can be expressed as follows,
Rq=
k1S
k2+S (5)
where Rq and S are the local heat dissipation rate and concentration of
substrate C, respectively; k1 and k2 are the maximum rate of heat
dissipation and half-saturation constant, respectively. In our experi-mental system, Eq. (5) applies in each compartment, assumed well-
mixed condition owing to the relatively large amount of glucose addi-tion. In a homogeneous system, concentrations of a substrate are the same at all locations within the soil system; thus, the mean concentra-tion is also the same as the local concentraconcentra-tions. Therefore, Rq and S are
the same as their mean quantities in Eq. (5) and represent the heat dissipation rate and substrate concentration from each compartment in our homogeneous treatment. Since the heat dissipation rate is calculated at the mean substrate concentration, Eq. (5) constitutes our kinetics model in homogeneous conditions.
For the second step, we define heterogeneity as the non-uniform spatial distribution of the glucose in the system, while the parameters of the model (k1 and k2) are considered spatially homogenous.
There-fore, heterogeneity in our experiment is provided by the different glucose concentrations in the four compartments. Initially, the microbial biomass is spatially homogeneous; however, as microorganisms start to consume substrate, a spatially heterogeneous pattern is expected to develop, causing k1 to vary spatially, but we neglect this effect given the
short duration of the experiment.
In the third step, the heat dissipation model for homogeneous con-ditions in Eq. (5) is scaled up using scale transition theory to obtain the dissipation rate for the heterogeneous system as described in Eq. (6) (see
Chakrawal et al. (2020) for details on the mathematically equivalent case of organic matter decomposition rate),
Rq≈ k1S k2+S ⏟̅̅̅⏞⏞̅̅̅⏟ 1 +1 2 d2R q dS2|Sσ2S ⏟̅̅̅̅̅̅̅⏞⏞̅̅̅̅̅̅̅⏟ 2 (6)
where Rqand S are the mean heat dissipation rates and mean
concen-trations of the substrate in the system, respectively, σ2S is the spatial
variance of the substrate across the four compartments, and the second derivative represents the curvature of the relation between dissipation rate and substrate concentration. Note that S is the local concentration of the substrate, which is different from the mean concentration S. In our case, the dominant source of variability is at the compartment scale with
σ2S being highest in the treatment where all glucose is added to a single
compartment, whereas in the homogenous treatment with σ2S=0 will cause the second term to disappear. For illustration, only the effect of substrate variance is considered, and higher-order (smaller) terms are neglected. The effect of spatial heterogeneity in Eq. (6) is graphically explained in Fig. S2.
The first term on the right-hand side of Eq. (6) explains heat dissi-pation rates under homogeneous conditions, which is modified by the ‘correction’ term; i.e., the second term in Eq. (6) that accounts for the spatial heterogeneity in substrate distribution. In the absence of het-erogeneity, σ2S=0 (thus the second term will disappear), and then we recover Eq. (5) at the mean substrate concentration. However, in the presence of spatial heterogeneities, the ‘correction’ terms become important: The spatial variance σ2S is always positive and the second
derivative of the dissipation rate with respect to substrate concentration is always negative for concave downward relations. As a result, the correction term is negative as long as the microbial response is a concave-downward function of substrate concentration.
Equation (6) can be used to obtain three qualitative predictions that provide the theoretical basis for our hypotheses: heterogeneity de-creases heat dissipation rate, this decrease is larger for increasing σ2S, and
any process reducing σ2S (such as diffusion) will lower the role of initially
imposed heterogeneity on the dissipated heat.
2.5. Statistical analysis
Prior to the analysis, the value of both heat dissipation rate and cu-mulative heat dissipated in the control treatment were subtracted from those in all heterogeneous treatments. One-way ANOVA was used to test the difference in heat dissipation rates between treatments (25-25-25-
25%, 50-50-0-0%, 50-0-50-0% and 100-0-0-0%) at specific time points (at the beginning of the experiment, at its peak and at the end), as well as cumulative heat by the end of the experiment at P < 0.05 level using PAST (Hammer et al., 2001). The homogeneity of variance was checked before the analysis using Levene’s test at P < 0.05. When the test failed, the difference between treatments was tested using Kruskal-Wallis one-way ANOVA at P < 0.05 level using SPSS (IBM Corp. Released, 2017. IBM SPSS Statistics for Windows, Version 25.0. Armonk, NY: IBM Corp). Significant differences in either heat dissipation rates or cumu-lative heat dissipated between treatments were further analyzed using Dunn’s post hoc test.
3. Results
3.1. Effects of substrate spatial heterogeneity on heat dissipation
The soil heat dissipation rate was at 26.6 ± 1.9 μJ g−1 soil s−1 in the
25-25-25-25% treatment at the beginning of the experiment (t = 3 h, when the heat signals were stabilized), which was between 67% and more than twice as much as the other treatments (Fig. 2a). The addition of glucose induced a strong increase in heat dissipation rates, which reached a peak and then decreased, with the peak heights and timing differing among heterogeneity treatments (Table 2). The peak of the heat dissipation rate appeared the earliest in the most homogeneous treatment (30.5 h), and the latest in 50-0-50-0 and 100-0-0-0% treat-ments, approximately 2 h later. The height of the peak was the smallest in the most heterogeneous treatment (100-0-0-0%), being more than 50% smaller than the other treatments. These results support our first two hypotheses.
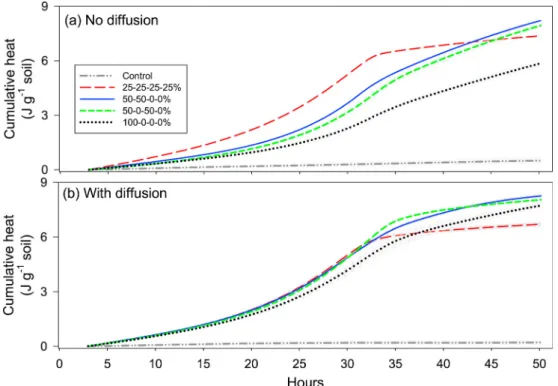
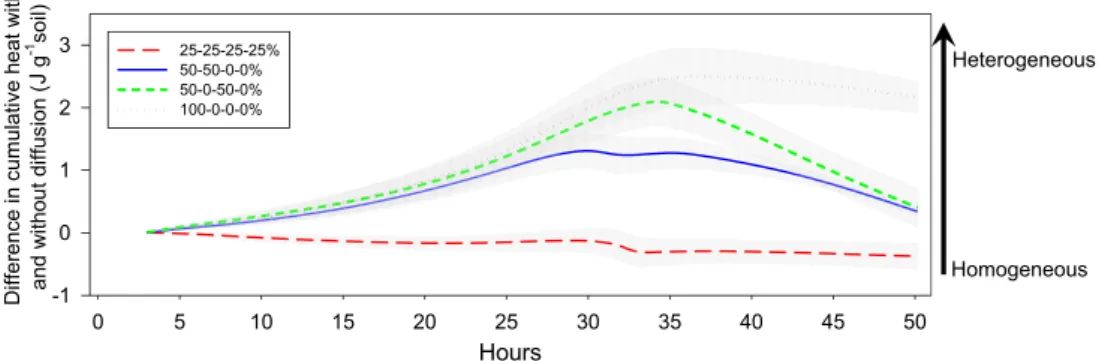
At the end of the experiment (t = 51 h), cumulative heat dissipation was the lowest in the most heterogeneous treatment, and highest in the intermediate treatments of 50-50-0-0% and 50-0-50-0%, being 30% significantly higher (Fig. 3a). We applied (Eq. (1)) to better illustrate how the heterogeneous treatments drove the differences in cumulative heat dissipated from that of homogeneous treatment. The differences between heterogeneous and homogeneous treatments increased gradu-ally until approximately 33 h, and decreased thereafter (Fig. 4a).
Throughout the incubation period, the most heterogeneous treatment dissipated less heat compared to the homogeneous treatment. The dif-ferences were largest at approximately 32 h, during which the most heterogeneous treatment had dissipated 3.3 ± 0.1 J g−1 soil less heat
compared to the homogeneous treatment. The intermediate heteroge-neous treatments (50-50-0-0% and 50-0-50-0%) had dissipated approximately 1.7 J g−1 soil less heat at the similar time. The differences
between the homogeneous and the most heterogeneous treatments decreased towards the end of the experiment at t = 51 h, but remained high for the most heterogeneous treatment, which by then had dissi-pated 1.5 ± 0.1 J g−1 less heat compared to the homogeneous one.
3.2. Effects of reduced substrate spatial heterogeneity (via diffusion) on heat dissipation
The differences in heat dissipation rates among treatments were less pronounced when diffusion was allowed across the compartments
Fig. 2. Soil heat dissipation rate (μJ g−1 soil s−1) in control treatment and in treatments with the most homogeneous (25-25-25-25%), intermediate heterogeneous
(50-50-0-0% and 50-0-50-0%) and the most heterogeneous substrate (100-0-0-0%) in cylinder with no diffusion (a) and with diffusion (b). Bars on the symbols are standard error at 5 min interval (n = 3).
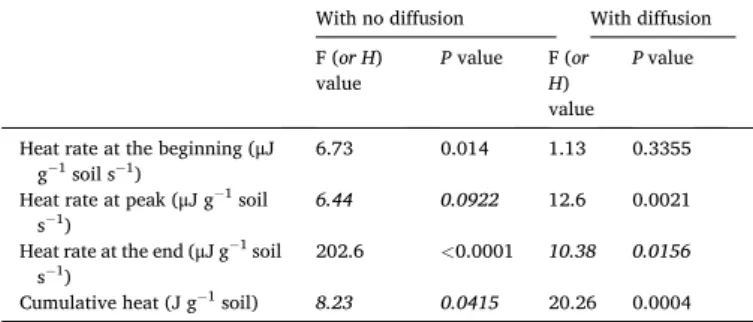
Table 2
Statistical results of one-way ANOVA or Kruskal-Wallis test (shown in italic) on heat dissipation rate at the beginning of the experiment (hour 3), at the peak, at the end (hour 51) and the cumulative heat between substrate spatial neity treatments (the most homogenous 25-25-25-25%, intermediate heteroge-neous 50-50-0-0% and 50-0-50-0%, and the most heterogeheteroge-neous treatment 100- 0-0-0%) in cylinder with no diffusion and with diffusion between compartments.
With no diffusion With diffusion F (or H)
value P value F (or H)
value
P value
Heat rate at the beginning (μJ
g−1 soil s−1) 6.73 0.014 1.13 0.3355
Heat rate at peak (μJ g−1 soil
s−1) 6.44 0.0922 12.6 0.0021
Heat rate at the end (μJ g−1 soil
s−1) 202.6 <0.0001 10.38 0.0156
Soil Biology and Biochemistry 152 (2021) 108068
6 (Fig. 2b). Heat dissipation rates did not differ between treatments initially, nor during the peak, except for the treatment of 50-0-50-0%, which exhibited 23% higher dissipation rate. Heat dissipation rates at the end of the incubation were highest in 100-0-0-0%, which was about twice that of the 50-50-0-0% and 50-0-50-0% treatments, and more than three times higher than that of the homogeneous treatment. Overall, these results support our third hypothesis.
The highest soil cumulative heat dissipated was found in 50-50-0-0% and 50-0-50-0% treatments, while the lowest in the most homogeneous treatment (Fig. 3b). The differences in cumulative heat between het-erogeneous and homogeneous treatments were less pronounced when
substrates were allowed to diffuse (Fig. 4b). Throughout the incubation, the difference was negligible in the 50-50-0-0% and 50-0-50-0% treat-ments until around 33 h, while the most heterogeneous treatment had dissipated 0.9 ± 0.2 J g−1 soil less heat compared to the homogeneous
treatment by that time. After 33 h, the heterogeneous treatments tended to dissipate more heat compared to the homogeneous treatment. The cumulative difference was largest at the end, being 1.6 ± 0.1, 1.3 ± 0.1 and 1.0 ± 0.2 J g−1 soil in 50-50-0-0%, 50-0-50-0% and 100-0-0-0%
treatments, respectively.
As expected, there were no differences in cumulative heat dissipated between samples with and without diffusion in the most homogeneous
Fig. 3. The cumulative heat (J g−1 soil) in control treatment and in treatments with the most homogeneous (25-25-25-25%), intermediate heterogeneous (50-50-0-
0% and 50-0-50-0%) and the most heterogeneous substrate (100-0-0-0%) in cylinder with no diffusion (a) and with diffusion (b). Bars on the symbols are standard error at 5 min interval (n = 3).
Fig. 4. The differences in cumulative heat (J
g−1 soil) between heterogeneous (50-50-0-
0%, 50-0-50-0% and 100-0-0-0%) and ho-mogeneous treatment (25-25-25-25%) in cylinder with no diffusion (a) and with
diffusion (b). Bars on the symbols are
stan-dard error at 5 min interval (n = 3). Pre-sented values were the data subtracted with those in the control treatment. The arrows of ‘Degree of heterogeneity’ indicate the in-crease in substrate spatial heterogeneity from intermediate to high level.
treatment, based on the metric defined by Eq. (2) (i.e. red dashed curve in Fig. 5). However, the differences increased gradually from the 50-50- 0-0% treatment (cumulative difference increased up to 1.3 ± 0.3 J g−1
soil) to the 100-0-0-0% treatment (up to 2.5 ± 0.5 J g−1 soil, and
maintained at such high level) (Fig. 5). By the end of the experiment, the cumulative difference was smallest in 25-25-25-25% treatment, and increased with the increasing degree of heterogeneity.
4. Discussion
4.1. Effects of substrate spatial heterogeneity on soil microbial activity
We created a gradient of substrate spatial heterogeneity by the addition of glucose solution with different concentrations in either one (the most heterogeneous), two or all four compartments (the most ho-mogeneous) in our experimental system. Viewing the entire cylinder as a system, the most heterogeneous treatment represents an extremely patchy environment with an organic matter hot spot, compared to well- mixed conditions in the homogeneous treatment. We can assume that the distribution of glucose in each compartment is relatively even. This is substantiated given that i) the sorption of glucose to soil surfaces is negligible (Gunina et al., 2014); ii) soil microbial communities only cover a very small fraction of the soil surface (Young and Crawford, 2004); and 3) the glucose concentration was large, even in the homo-geneous and most diluted treatment (i.e. 25% of glucose addition). We can thus focus on heterogeneity caused by the manipulation of glucose concentrations at the compartment scale.
The decrease in microbial activity in the 100-0-0-0% treatment could be due to several reasons. Firstly, the rate of substrate consumption increases sub-linearly with increasing substrate concentration (Fig. S1, as also in Monod equation, due to decreasing returns at high concen-trations), so that concentrating the substrate in only one compartment does not allow as efficient utilization of microbial substrate as in the homogeneous treatment. Lower rates of glucose uptake at high con-centrations can be explained by saturation of cell wall transporters or mass transport limitations (Liu, 2007), but may also be caused by local oxygen limitation. This reduced efficiency was confirmed by the smaller increase in heat dissipation rate between 1.0 and 2.0 mg glucose C g−1
soil (corresponding to the compartments that received 50% and 100% glucose, respectively), as compared to the increase between 0.5 and 1.0 mg glucose C g−1 soil (corresponding to 25% and 50%) (Fig. S1).
Sec-ondly, the access of large colonies to substrates could be reduced, because microbial colony size often increases with increasing glucose concentration and in a large colony, substrate mass transport can become a limiting factor (Pirt, 1967; Rieck et al., 1973). This would be particularly true in the most heterogeneous treatment, where the local concentration was highest, possibly causing large colonies to grow, but only in the substrate-amended compartment. This effect would also be captured by a concave downward relation between uptake rate and concentration. Thirdly, the abundance of the amended substrate could also limit the interaction between microbial communities and substrate
in the most heterogeneous treatment (100-0-0-0%), because microbes require a longer period to cope with the abundant substrate in only one soil compartment.
In contrast to the heterogeneous treatments, the same amount of substrate was distributed evenly in all four compartments in the 25-25- 25-25% treatment. Thus, the rate of substrate uptake was larger on average owing to relatively more efficient metabolism of smaller and more numerous microbial colonies. As a result, the most heterogeneous treatment has induced lower microbial activity, as well as a delay in the rate of maximum microbial activity (discussed later).
In line with this argument, the dislocation between bacteria and organic C sources was modeled and showed to decrease decomposition, as compared to a well-mixed scenario (Vogel et al., 2015; Portell et al., 2018). In the modelling work by Portell et al. (2018), the location of C substrates was manipulated to obtain aggregated (single spot), inter-mediate aggregated (four spots) or homogeneous patterns, while maintaining the same amount of C source as we also did. The likelihood for microbes to encounter and assimilate substrate was lower when substrates were distributed in an aggregated pattern (Portell et al., 2018). Consistent with this result, Kaiser et al. (2015) found that a reduced decay rate corresponded with high degree of spatial distribution of substrates, but the substrate distribution was the result of interactions among microbial functional groups, rather than being externally-manipulated. These modelling studies were conducted at the soil pore scale—much smaller than our compartments. However, similar evidence emerges also from empirical studies at scales comparable to our experiment (in the order of a few mm). For example, the importance of co-location between microbial community and substrate was high-lighted in a ‘sandwich-shaped’ microcosm, where plant residues were placed in the middle of two soil layers (Gaillard et al., 1999). Decom-position was the highest in the soil in direct contact with residues (thereby the spot with the highest substrate concentration), and was reduced with increasing distance (Gaillard et al., 1999). All these studies emphasize the importance of accessibility and concentration of substrate sources for microbial decomposition. They imply that laboratory ex-periments, where well-mixed conditions are imposed, might over-estimate microbial activity, as compared to the level in situ where hot spots are likely to occur.
Further, soil microbial activity in the treatments with intermediate heterogeneity remained between the two extreme treatments (25-25-25- 25% and 100-0-0-0%) throughout most of the incubation (Fig. 3a). Thus, we can confirm both our first hypothesis (soil microbial activity is lower under heterogeneous than under homogenous conditions for a given total amount of supplied C), and the second hypothesis (the larger the heterogeneity, the lower the microbial activity). Both hypotheses were also supported by the scale transition theory, which accounts for the degree of substrate spatial heterogeneity in the second term of the equation for the mean heat dissipation rate (Eq. (6)). After the heat release peak, the heat rate decreased dramatically in the most homo-geneous treatment, while other treatments exhibited a more gradual decrease. It is likely that the consumption of substrate is more complete
Fig. 5. The differences in cumulative heat (J
g−1 soil) between cylinders with no
diffu-sion and with diffudiffu-sion in substrate
het-erogeneity treatments (the most homogeneous 25-25-25-25%, intermediate heterogeneous 50-50-0-0% and 50-0-50-0%, and the most heterogeneous substrate 100-0- 0-0%). Presented values were the data sub-tracted with those in the control treatment. The arrow on the right indicates the increase in substrate spatial heterogeneity from the most homogeneous to the most heterogene-out treatment.
Soil Biology and Biochemistry 152 (2021) 108068
8 in the homogeneous treatment, due to higher rate of utilization, as mentioned above. On the contrary, the increases in substrate spatial heterogeneity limited the utilization of substrate by decomposers, thereby reducing the decomposition rate, and causing a delay of at least 2 h in the peak of heat dissipation rate (Fig. 2a). Under heterogeneous conditions, this delay can also be predicted based on scale transition theory (Eq. (6))—if C utilization is low at the beginning. It will therefore take longer to reach the peak. Overall, the delay in the heat dissipation peak and the slower decrease in microbial activity after the peak suggest that: i) the limited access to substrates sustains its utilization in the longer term, confirmed by the relatively narrow range of heat dissipa-tion rates (e.g., 9.1–69.6 μJ g−1 soil s−1 in the 100-0-0-0% treatment,
compared to 9.5–107.9 μJ g−1 soil s−1 in the 25-25-25-25% treatment);
and ii) microbial process rates differ across degrees of heterogeneity, because no delay of the heat dissipation peak was observed when sub-strates were homogeneously amended, regardless of substrate concen-tration (0.5, 1.0 and 2.0 mg glucose C g−1 soil in Fig. S1).
In summary, the arrangements of soil components (minerals, organic matter, etc.), together with the influence of other factors (e.g., microbial mobility (Dechesne et al., 2010), moisture status (Vogel et al., 2015)), create local microbial hot and cold spots (Kuzyakov and Blagodatskaya, 2015), that result in altered microbial process rates at the whole system scale. Notably, the effects of these local heterogeneities on observed rates are similar when considering pore-scale or mm-scale patches. Our results highlight that not only the presence of hot spots, but also their position with respect to cold spots (i.e., the magnitude of spatial het-erogeneity) influence soil microbial functioning. This provides direct evidence to support the hypothesis that spatial heterogeneity controls C flow rates and organic matter stabilization, as proposed by Lehmann et al. (2020).
4.2. Effects of reduced substrate spatial heterogeneity (via diffusion) on microbial activity
In the system where substrates were allowed to diffuse, the differ-ences in soil heat dissipation rate remained smaller than in the system without diffusion (Fig. 2b), which is likely caused by substrate transport to the ‘empty’ compartments (i.e., those without substrate addition). Substrate needs time to diffuse to empty compartments, especially for the diagonal one in 100-0-0-0%, where the distance is the longest. Indeed, the estimated amount of time (Eq. (3)) for glucose to diffuse between nearby compartments is in the order of ~60 h (0.65 cm from center to center of compartments). Thus, the time required to diffuse likely contributed to the delay in microbial activity. Equally important to note is that decomposition continues while diffusion occurs, as confirmed by the similar size of heat peak among treatments (except the treatment of 50-0-50-0%). Therefore, the observed delay in heat release can also be viewed as a consequence of the distance between substrate and decomposer—the closer between substrate and decomposer are, the faster the decomposition (Pinheiro et al., 2015; Babey et al., 2017). Moreover, the estimated time for diffusion between compartments (~60 h) indicates that we probably had a relatively homogeneous condition by the end of the experiment (51 h). Therefore, our last hy-pothesis was also confirmed, namely that microbial activity will be closer to that of a homogeneous system when the substrate concentra-tion gradients are reduced by diffusion.
Notably, there was a stronger microbial activity during the peak in the treatment of 50-0-50-0%, compared to 50-50-0-0%. We speculate that it could be due to the different local substrate concentration, or the different rates and patterns of substrate diffusion into the empty com-partments. As shown by the layout of the experimental design (Fig. 1), the two empty compartments would receive substrate at different rates between these two treatments. The two compartments with substrate are side-by-side in the 50-50-0-0% treatment, while they are in direct con-tact with the other two compartments with substrate in the 50-0-50-0% treatment. Therefore, substrate could enter from both sides in the latter,
and only from one side in the former, thus leading to relatively higher local glucose concentration in the 50-50-0-0% treatment. We thus sur-mise that the observed lower soil microbial activity in the 50-50-0-0% treatment is due to the lower substrate transport to compartments that had not been amended. Moreover, the peak in heat dissipation rate appeared later in the 50-0-50-0% treatment, suggesting that the different local substrate concentrations altered the rate of substrate assimilation and thus the timing of the peak. Such delay occurred regardless of whether substrate is able to diffuse or not (Fig. 2a and b)— a result that we cannot readily explain. Because soil organic matter is heterogeneously located (Ettema and Wardle, 2002; Vieuble-Gonod et al., 2009), and natural transport processes tend to decrease spatial gradients, variability in decomposition rates is expected. This is dependent on the specific arrangement of hot and cold spots, and the degree of mass transfer between them.
The differences between treatments of 50-50-0-0% and 50-0-50-0% cannot be explained by the ‘correction’ terms (that account for hetero-geneity) in Eq. (6) of scale transition theory, because mathematically, the ‘correction’ terms are the same between these treatments. Further, scale transition theory as formulated in Eq. (6) only explained the ob-servations before heat peak is reached, because Eq. (6) does not account for dynamic changes in substrate and microbial biomass. Once those changes are included (as in Chakrawal et al. (2020)), the same theory might be able to describe the whole response curve. Moreover, various kinetics of microbial processes might emerge at different substrate concentrations (Reischke et al., 2014; Rousk et al., 2014), which is not taken into account in the model. Obtaining a representative kinetic model for microbial substrate utilization, and coupling it to mass and energy balance equations would improve the capacity of scale transition theory in explaining spatial heterogeneity-related changes, and ulti-mately provide novel decomposition formulations for soil C cycling models.
5. Conclusions
We experimentally manipulated a gradient of substrate spatial het-erogeneity, ranging from homogeneous (well-mixed) to heterogeneous (extremely patchy) conditions, representing biogeochemical hot spots in soils (Kuzyakov and Blagodatskaya, 2015). In addition, to reflect the complexities of spatial heterogeneity, we manipulated the co-arrangement of hot and cold spots. Soil microbial activity decreased with increasing degree of substrate spatial heterogeneity and the most heterogeneous treatment also delayed the peak of microbial activity, compared to the homogeneous treatment. This evidence supports the view that the spatial heterogeneity between decomposer and substrates could explain the persistence of organic C in soils. The scale transition theory qualitatively captured the reduction in microbial activity and the delay caused by substrate spatial heterogeneity. Overall, our findings emphasize the prominent influence of substrate spatial heterogeneity on soil microbial communities and thus C cycling in soils.
Declaration of competing interest
The authors declare that they have no known competing financial interests or personal relationships that could have appeared to influence the work reported in this paper.
Acknowledgments
We thank Louis Dufour for helpful discussion, and Tobias B¨olscher (Lund University, Sweden) and Alan Sim (The James Hutton Institute, UK) for providing the soil samples. This work is funded by Swedish Research Council Vetenskapsrådet (Grant No. 2016-04146).
Appendix A. Supplementary data
Supplementary data related to this article can be found at https:// doi.org/10.1016/j.soilbio.2020.108068.
References
Babey, T., Vieuble-Gonod, L., Rapaport, A., Pinheiro, M., Garnier, P., de Dreuzy, J.R., 2017. Spatiotemporal simulations of 2,4-D pesticide degradation by microorganisms in 3D soil-core experiments. Ecological Modelling 344, 48–61.
Boddy, E., Roberts, P., Hill, P.W., Farrar, J., Jones, D.L., 2008. Turnover of low molecular weight dissolved organic C (DOC) and microbial C exhibit different temperature sensitivities in Arctic tundra soils. Soil Biology and Biochemistry 40, 1557–1566.
B¨olscher, T., Paterson, E., Freitag, T., Thornton, B., Herrmann, A.M., 2017. Temperature sensitivity of substrate-use efficiency can result from altered microbial physiology without change to community composition. Soil Biology and Biochemistry 109, 59–69.
ˇ
Cernohl´avkov´a, J., 2009. Effects of Selected Environmental Pollutants on Soil Microbial Community in Laboratory and Field Studies [online]. Masaryk University, Faculty of Science, Brno.
Chakrawal, A., Herrmann, A.M., Koestel, J., Jarsjo, J., Nunan, N., Katterer, T., Manzoni, S., 2020. Dynamic upscaling of decomposition kinetics for carbon cycling models. Geoscientific Model Development 13, 1399–1429.
Chesson, P., 1998. Spatial scales in the study of reef fishes: a theoretical perspective. Australian Journal of Ecology 23, 209–215.
Chesson, P., 2012. Scale transition theory: its aims, motivations and predictions. Ecological Complexity 10, 52–68.
Dechesne, A., Wang, G., Gülez, G., Or, D., Smets, B.F., 2010. Hydration-controlled bacterial motility and dispersal on surfaces. Proceedings of the National Academy of Sciences of the United States of America 107, 14369–14372.
Dungait, J.A.J., Hopkins, D.W., Gregory, A.S., Whitmore, A.P., 2012. Soil organic matter turnover is governed by accessibility not recalcitrance. Global Change Biology 18, 1781–1796.
Ettema, C.H., Wardle, D.A., 2002. Spatial soil ecology. Trends in Ecology & Evolution 17, 177–183.
Gaillard, V., Chenu, C., Recous, S., Richard, G., 1999. Carbon, nitrogen and microbial gradients induced by plant residues decomposing in soil. European Journal of Soil Science 50, 567–578.
Gallardo, A., Schlesinger, W.H., 1994. Factors limiting microbial biomass in the mineral soil and forest floor of a warm-temperate forest. Soil Biology and Biochemistry 26, 1409–1415.
Ghee, C., Neilson, R., Hallett, P.D., Robinson, D., Paterson, E., 2013. Priming of soil organic matter mineralisation is intrinsically insensitive to temperature. Soil Biology and Biochemistry 66, 20–28.
Griffiths, B.S., Ball, B.C., Daniell, T.J., Hallett, P.D., Neilson, R., Wheatley, R.E., Osler, G., Bohanec, M., 2010. Integrating soil quality changes to arable agricultural systems following organic matter addition, or adoption of a ley-arable rotation. Applied Soil Ecology 46, 43–53.
Gunina, A., Dippold, M.A., Glaser, B., Kuzyakov, Y., 2014. Fate of low molecular weight organic substances in an arable soil: from microbial uptake to utilisation and stabilisation. Soil Biology and Biochemistry 77, 304–313.
Hamamoto, S., Moldrup, P., Kawamoto, K., Komatsu, T., 2010. Excluded-volume expansion of Archie’s law for gas and solute diffusivities and electrical and thermal conductivities in variably saturated porous media. Water Resources Research 46.
Hammer, ø., Harper, D.A.T., Ryan, P.D., 2001. PAST: paleontological statistics software package for education and data analysis. Palaeontologia Electronica 4, 9pp.
Herrmann, A.M., Coucheney, E., Nunan, N., 2014. Isothermal microcalorimetry provides new insight into terrestrial carbon cycling. Environmental Science and Technology 48, 4344–4352.
Kaiser, C., Franklin, O., Richter, A., Dieckmann, U., 2015. Social dynamics within decomposer communities lead to nitrogen retention and organic matter build-up in soils. Nature Communications 6, 8960.
Korsaeth, A., Molstad, L., Bakken, L.R., 2001. Modelling the competition for nitrogen between plants and microflora as a function of soil heterogeneity. Soil Biology and Biochemistry 33, 215–226.
Kuzyakov, Y., Blagodatskaya, E., 2015. Microbial hotspots and hot moments in soil: concept & review. Soil Biology and Biochemistry 83, 184–199.
Lammel, D.R., Arlt, T., Manke, I., Rillig, M.C., 2019. Testing contrast agents to improve micro computerized tomography (μCT) for spatial location of organic matter and
biological material in soil. Frontiers in Environmental Science 7.
Lehmann, J., Hansel, C.M., Kaiser, C., Kleber, M., Maher, K., Manzoni, S., Nunan, N., Reichstein, M., Schimel, J.P., Torn, M.S., Wieder, W.R., K¨ogel-Knabner, I., 2020. Persistence of soil organic carbon caused by functional complexity. Nature Geoscience 13, 529–534.
Liu, Y., 2007. Overview of some theoretical approaches for derivation of the Monod equation. Applied Microbiology and Biotechnology 73, 1241–1250.
Marschner, P., Marhan, S., Kandeler, E., 2012. Microscale distribution and function of soil microorganisms in the interface between rhizosphere and detritusphere. Soil Biology and Biochemistry 49, 174–183.
Monod, J., 1949. The growth of bacterial cultures. Annual Review of Microbiology 3, 371–394.
Nunan, N., 2017. The microbial habitat in soil: scale, heterogeneity and functional consequences. Journal of Plant Nutrition and Soil Science 180, 425–429. Wiley-VCH Verlag.
Nunan, N., Schmidt, H., Raynaud, X., 2020. The ecology of heterogeneity: soil bacterial communities and C dynamics. Phil. Trans. R. Soc. B 375, 249, 2019.
Pallud, C., Dechesne, A., Gaudet, J.P., Debouzie, D., Grundmann, G.L., 2004. Modification of spatial distribution of 2,4-dichlorophenoxyacetic acid degrader microhabitats during growth in soil columns. Applied and Environmental Microbiology 70, 2709–2716.
Phillips, C.L., Nickerson, N., 2015. Soil Respiration, Reference Module in Earth Systems and Environmental Sciences. Elsevier.
Pinheiro, M., Garnier, P., Beguet, J., Martin Laurent, F., Vieubl´e Gonod, L., 2015. The millimetre-scale distribution of 2,4-D and its degraders drives the fate of 2,4-D at the soil core scale. Soil Biology and Biochemistry 88, 90–100.
Pirt, S.J., 1967. A kinetic study of the mode of growth of surface colonies of bacteria and fungi. Journal of General Microbiology 47, 181–197.
Portell, X., Pot, V., Garnier, P., Otten, W., Baveye, P.C., 2018. Microscale heterogeneity of the spatial distribution of organic matter can promote bacterial biodiversity in soils: insights from computer simulations. Frontiers in Microbiology 9.
Reischke, S., Rousk, J., Bååth, E., 2014. The effects of glucose loading rates on bacterial and fungal growth in soil. Soil Biology and Biochemistry 70, 88–95.
Rieck, V.T., Palumbo, S.A., Witter, L.D., 1973. Glucose availability and the growth rate of colonies of Pseudomonas fluorescens. Journal of General Microbiology 74, 1–8.
Rousk, J., Hill, P.W., Jones, D.L., 2014. Using the concentration-dependence of respiration arising from glucose addition to estimate in situ concentrations of labile carbon in grassland soil. Soil Biology and Biochemistry 77, 81–88.
Ruiz, S.A., McKay Fletcher, D.M., Boghi, A., Williams, K.A., Duncan, S.J., Scotson, C.P., Petroselli, C., Dias, T.G.S., Chadwick, D.R., Jones, D.L., Roose, T., 2020. Image-based quantification of soil microbial dead zones induced by nitrogen fertilization. The Science of the Total Environment 727, 138197.
Scheu, S., Schaefer, M., 1998. Bottom-up control of the soil macrofauna community in a beechwood on limestone: manipulation of food resources. Ecology 79, 1573–1585.
Schlüter, S., Zawallich, J., Vogel, H.J., D¨orsch, P., 2019. Physical constraints for respiration in microbial hotspots in soil and their importance for denitrification. Biogeosciences 16, 3665–3678.
Shi, A.D., Marschner, P., 2017. Soil respiration and microbial biomass in multiple drying and rewetting cycles - effect of glucose addition. Geoderma 305, 219–227.
Stein, W.D., 1990. Channels, Carriers, and Pumps: an Introduction to Membrane Transport. Academic Press, Elsevier Science Technology.
Tang, J., Riley, W.J., 2019. A theory of effective microbial substrate affinity parameters in variably saturated soils and an example application to aerobic soil heterotrophic respiration. Journal of Geophysical Research: Biogeosciences 124, 918–940.
Vieuble-Gonod, L., Benoit, P., Cohen, N., Houot, S., 2009. Spatial and temporal heterogeneity of soil microorganisms and isoproturon degrading activity in a tilled soil amended with urban waste composts. Soil Biology and Biochemistry 41, 2558–2567.
Vogel, L.E., Makowski, D., Garnier, P., Vieubl´e-Gonod, L., Coquet, Y., Raynaud, X., Nunan, N., Chenu, C., Falconer, R., Pot, V., 2015. Modeling the effect of soil meso- and macropores topology on the biodegradation of a soluble carbon substrate. Advances in Water Resources 83, 123–136.
von Lützow, M., K¨ogel-Knabner, I., Ekschmitt, K., Matzner, E., Guggenberger, G., Marschner, B., Flessa, H., 2006. Stabilization of organic matter in temperate soils: mechanisms and their relevance under different soil conditions – a review. European Journal of Soil Science 57, 426–445.
WRB, I.W.G., 2006. World Reference Base for Soil Resources 2006 - A Framework for International Classification, Correlation and Communication. Food and Agriculture Organization of the United Nations (FAO), Rome.
Young, I.M., Crawford, J.W., 2004. Interactions and self-organization in the soil-microbe complex. Science 304, 1634–1637.