HAL Id: hal-00304640
https://hal.archives-ouvertes.fr/hal-00304640
Submitted on 1 Jan 2001HAL is a multi-disciplinary open access archive for the deposit and dissemination of sci-entific research documents, whether they are pub-lished or not. The documents may come from teaching and research institutions in France or abroad, or from public or private research centers.
L’archive ouverte pluridisciplinaire HAL, est destinée au dépôt et à la diffusion de documents scientifiques de niveau recherche, publiés ou non, émanant des établissements d’enseignement et de recherche français ou étrangers, des laboratoires publics ou privés.
Using vegetation indices for soil-moisture retrievals from
passive microwave radiometry
E.J. Burke, W.J. Shuttleworth, A.N. French
To cite this version:
E.J. Burke, W.J. Shuttleworth, A.N. French. Using vegetation indices for soil-moisture retrievals from passive microwave radiometry. Hydrology and Earth System Sciences Discussions, European Geosciences Union, 2001, 5 (4), pp.671-678. �hal-00304640�
Using vegetation indices for soil-moisture retrievals from passive
microwave radiometry
Eleanor J. Burke
1, W. James Shuttleworth
1and Andrew N. French
21Department of Hydrology and Water Resources, University of Arizona, Tucson AZ 85721 2USDA ARS Hydrology & Remote Sensing Laboratory, Beltsville, MD 20750
Email for corresponding author: [email protected]
Abstract
Surface soil moisture and the nature of the overlying vegetation both influence microwave emission from land surfaces significantly. One widely discussed but underused method for allowing for the effect of vegetation on soil-moisture retrievals from microwave observations is to use remotely sensed vegetation indices. This paper explores the potential for using the Normalised Difference Vegetation Index (NDVI) in soil-moisture retrievals from L-band (1.4 GHz) aircraft data gathered during the Southern Great Plains ’97 (SGP97) experiment. A simplified version of MICRO-SWEAT, a soil vegetation atmosphere transfer (SVAT) scheme coupled with a microwave emission model, was used as the retrieval algorithm. Estimates of the optical depth of the vegetation, the parameter that describes the effect of the vegetation on microwave emission, were obtained by calibrating this retrieval algorithm against measurements of soil moisture at 15 field sites. A significant relationship was found between the optical depth so obtained and the observed NDVI at these sites, although this relationship changed with the resolution of the microwave brightness temperature observations used. Soil-moisture estimates made with the retrieval algorithm using the empirical relationship between optical depth and NDVI applied at two additional sites not used in the calibration show good agreement with field measurements.
Keywords: NDVI, soil moisture, passive microwave, SGP97
Introduction
The L-band (1.4-GHz frequency, 21-cm wavelength) passive microwave emission of land surfaces is influenced strongly by both surface soil moisture and the nature of the overlying vegetation (Schmugge, 1998). Knowledge of the optical depth, the parameter that quantifies the effect of the vegetation on the microwave emission, is crucial for the retrieval of accurate soil-moisture values (Burke and Simmonds, 2001a). At present, there are two recognised methods for quantifying the optical depth. In the first, two or more measurements of microwave brightness temperature for the same area are used to retrieve simultaneous estimates of both the soil moisture and the vegetation optical depth using optimisation procedures (e.g. Burke et al, 2001; Wigneron et al, 2000; Owe et al, 2001). In the second method, ancillary remotely sensed data are used to estimate the value of optical depth required to retrieve soil moisture from a single measurement of microwave brightness temperature (e.g. Jackson et al., 1999).
It is often assumed that optical depth (τ) is proportional to the vegetation water content (θveg), thus:
τ = bθveg (1)
where b is a parameter related to the nature of the vegetation cover. Jackson et al. (1999) used land cover classifications to specify the parameter b based on published data such as those of Jackson and Schmugge (1991). To specify regional fields of vegetation water content, Jackson et al (1999) used a quadratic relationship between the ground-based vegetation water content measurements and the remotely sensed NDVI at a set of calibration sites. This relationship was derived for the whole of the SGP97 area, but required modifications at specific locations within El Reno, where there was dense vegetation. Otherwise, little effort has hitherto been devoted to evaluating additional methods for obtaining optical depth indirectly from remotely sensed vegetation indices.
Eleanor J. Burke, W. James Shuttleworth and Andrew N. French
This paper explores the feasibility of retrieving soil moisture from single look angle, single frequency, and single polarisation brightness temperature observations using a simple but physically based retrieval algorithm, with the optical depth estimated from a remotely sensed NDVI using an empirical relationship. The empirical relationship between optical depth and the NDVI used was derived from data collected at the El Reno site during the Southern Great Plains ’97 (SGP97) field study by calibrating the retrieval algorithm against field measurements of soil-moisture measurements and airborne observations of microwave brightness temperature data. The dependence of this empirical relationship on the resolution of the microwave brightness temperatures was explored, and the overall retrieval process was tested against observations made at the two other SGP97 sites at Little Washita and the Central Facility.
Simple model for retrieving soil
moisture from microwave brightness
temperature
The MICRO-SWEAT model couples the simulation of heat, water and microwave transfers in the soil-vegetation-atmosphere system and can be used to predict the relationship between near-surface water content and microwave brightness temperatures (Burke et al., 1997; 1998). However, the model is not readily applied when data are limited because it requires detailed information on soil and vegetation properties and local meteorological forcing data. Recognising this issue, Burke and Simmonds (2001a,b) used MICRO-SWEAT to simulate the relationship between near-surface water content and microwave brightness temperatures under a wide variety of conditions and, in this way, generated the simpler representation described below. The brightness temperature measured by a radiometer, TB, can be expressed as a product of the apparent emissivity of the land surface, eapp, and the effective physical temperature of the soil, Teff, thus:
TB = eapp Teff (2)
In the simple retrieval algorithm used in this study, the effective temperature is assumed equal to the soil temperature at 11 cm (Simmonds and Burke, 1999). This temperature is, in turn, estimated by simulating the propagation of a sinusoidal temperature wave into the soil, forced by the (assumed sinusoidal) daily cycle of air temperature (Burke and Simmonds, 2001a). The apparent emissivity is then assumed to be linearly related to the
near-surface soil moisture for both bare and vegetation covered soils (Burke and Simmonds, 2001a). In the case of bare soil, the intercept of the linear relationship depends on the particle size distribution (Simmonds and Burke, 1998), while, for a vegetation-covered soil, both the slope and intercept depend on the optical depth of the canopy (Burke and Simmonds, 2001b). Readers are referred to Burke and Simmonds (2001b) for more detail of this simple retrieval algorithm.
The Southern Great Plains ’97
experiment (SGP97)
The SGP97 experiment was a large, interdisciplinary experiment carried out over a one-month period (18 June– 17 July, 1997) in 1997 (SGP97 home page). Its main focus was to test previously established soil-moisture retrieval algorithms for the ESTAR L-band passive microwave radiometer at 800-m resolution (Jackson et al., 1999). However, many ancillary observations were made and subexperiments carried out to answer additional research questions (e.g. Mohanty et al., 2000; Kustas et al., 2001; Famiglietti et al., 1999).
This paper uses data collected using the Scanning Low Frequency Microwave Radiometer (SLFMR), a vertically polarised L-band push-broom microwave radiometer (Jackson, 2001). The SLFMR was flown over the three intensively monitored areas - El Reno (ER), the Central Facility (CF), and Little Washita (LW), on the days and at the resolutions shown in Table 1. In this study, the data from the ER site are used for calibration, and the data from the LW and CF sites are used for validation purposes. For purpose of analysis, the SLFMR data were mapped from their irregular grid using standard geostatistical techniques. Figure 1 shows examples of the microwave brightness temperatures mapped for the El Reno region on July 2, 1997 at resolutions of 200, 400, and 600 m. The fields in which ground sampling of soil moisture was made are also shown. As expected, the variability of brightness temperatures decreases as the resolution of these images increases. Paler
Table 1. Timetable of relevant SLFMR flights during SGP97
Site Resolution (m) Date
ER 200, 400, and 600 6/29/97 ER 200, 400, and 600 7/2/97 ER 200, 400, and 600 7/3/97 LW 200 and 600 7/1/97 CF 600 6/30/97 CF 600 7/4/97
colours represent areas that have relatively high vegetation cover, relatively low soil water content, or a combination of the two. The very dark area at 590500 °E, 3934500 °N represents a small sewage treatment plant whose presence becomes less distinct as the resolution decreases.
Gravimetric soil-moisture samples were taken at 8 to 20 locations at each site where intensive sampling was made (i.e. ER, CF and LW). The sampling strategy was designed so these samples could provide average soil moisture for 800 m × 400 m areas (Jackson et al., 1999). The bulk density of the soil measured by the USDA Salinity Laboratory (http:/ /daac.gsfc.nasa.gov/CAMPAIGN_DOCS/SGP97/ soil_bd.html) was used in this analysis. Readers are referred to Jackson et al. (1999) for additional detail on the nature and procedures used for the field sampling of soil moisture. The Normalised Difference Vegetation Index (NDVI) was taken from a Landsat Thematic Mapper, TM scene that was taken on July 25, 1997, and calculated using the equation:
NDVI = (3)
where ρ4 is the reflectance in the near-infrared wavelengths
(band 4), and r3 is the reflectance in the visible wavelengths (band 3). Unfortunately, these 30 m resolution NDVI data were taken 25 days after the SLFMR brightness temperature observations, so there are likely to be some small differences in the vegetation characteristics between the two data sets. However, these data were used in this study because they were the only relevant data available that cover all three of the study sites (ER, CF, and LW).
Calibration of retrieval algorithm
The simple retrieval algorithm was calibrated using field-average soil moisture measurements from 15 locations at the ER site and tested against similar data from two locations at the LW and CF sites. At the 15 El Reno locations, retrievals of field-average near-surface soil moisture were made from the independent measurements of microwave brightness temperatures available on three days at the three available resolutions. It was assumed that, at each location, ρ4 – ρ3ρ4 + ρ3
Fig. 1. Microwave brightness temperatures measured on July 2, 1997 across the El Reno site during SGP97 at
resolutions of 200, 400, and 600 m. 584000 586000 588000 3932500 3933500 3934500 3935500 3936500 584000 586000 588000 3932500 3933500 3934500 3935500 3936500 150 160 170 180 190 200 210 220 230 240 250 260 584000 586000 588000 3932500 3933500 3934500 3935500 3936500 600 m resolution 400 m resolution 200 m resolution (K)
Eleanor J. Burke, W. James Shuttleworth and Andrew N. French
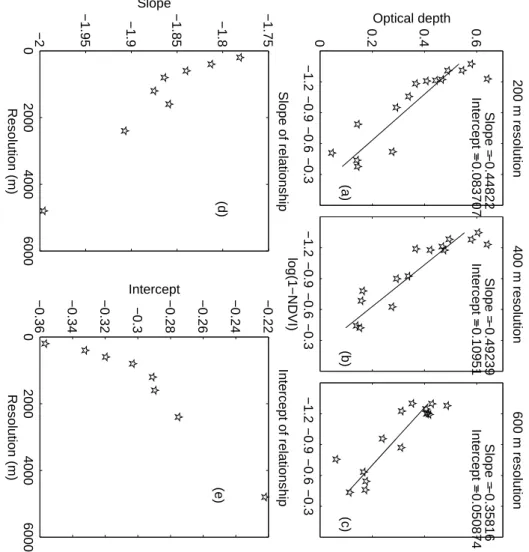
the difference between the retrieved and measured soil moisture was attributable solely to the optical depth of the canopy, the value of which was then adjusted in the retrieval algorithm to give a minimum difference between the measured and retrieved values. It is important to recognise that the optimum value of optical depth obtained implicitly includes contamination from the effects of soil-surface roughness, errors in the measurements of microwave brightness temperature, soil moisture, the estimation of effective temperature, and limited knowledge of soil particle size distributions. Fortunately, each of these factors on its own is likely to result in only a very small error in the retrieved soil moisture. Notwithstanding this contamination, Figs. 2a-c show that, at all three resolutions, when the independently derived value of optical depth is compared with the field-average NDVI, there is a significant relationship (with the standard error of the fit between optical depth and log(1-NDVI) ranging from 0.062 to 0.082).
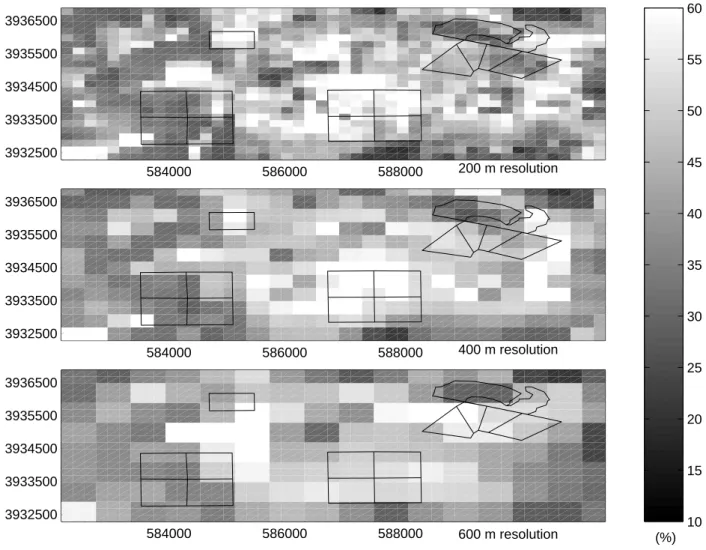
The three empirical relationships shown in Figs. 2a-c can be used to estimate optical depth across the study region from the measured NDVI and, given these estimates of optical depth, surface soil moisture can be estimated from the retrieval algorithm (Fig. 3). The absolute values of the retrieved soil moisture range from around 20 to 60 %, with the lower values in the west of the image, where there were several areas of wheat stubble, and the higher values towards the east, an area dominated by rangeland. In addition, there is significant variability in the retrieved soil moisture, with very high values sometimes close to much lower values, and it is difficult to know whether this variability is real or an artifact of the retrieval process. Again, the lower resolution data have the lower variability. The retrieved soil moisture depends strongly on the value of NDVI and, consequently, any change in land-surface conditions between the SLFMR data collection and the satellite overpass from which NDVI is derived will influence strongly
Fig. 2. The relationship, at resolutions of (a) 200, (b) 400, and (c) 600 m, respectively, between NDVI and optical depth derived by optimising
a simplified version of the MICRO-SWEAT model against field measurements of surface soil moisture. (d) The slope and (e) the intercept of the linear relationship between NDVI and derived optical depth at the different resolutions.
−1.2 −0.9 −0.6 −0.3 0 0.2 0.4 0.6 −0.44822 Slope = −0.083707 Intercept = (a) 200 m resolution Optical depth −1.2 −0.9 −0.6 −0.3 −0.49239 Slope = −0.10951 Intercept = (b) 400 m resolution log(1−NDVI) −1.2 −0.9 −0.6 −0.3 −0.35816 Slope = −0.05087 4 Intercept = (c) 600 m resolution 0 2000 4000 6000 −2 −1.95 −1.9 −1.85 −1.8 −1.75 Resolution (m) Slope (d) Slope of relationship 0 2000 4000 600 0 −0.36 −0.34 −0.32 −0.3 −0.28 −0.26 −0.24 −0.22 Resolution (m) Intercept Intercept of relationship (e)
the retrieved soil moisture fields. On the other hand, during the SGP97 experiment, it is known that, in some fields, there were substantial (100 × 100 m) areas of open water near areas where the soil water content was just 30–40%.
Figures 2a-c show that there are obvious differences between the empirical relationships derived at three different resolutions which might merely be the result of measurement errors in these experimental data, but which might also reflect a more basic weakness in the NDVI-based retrieval method. To investigate this, both the 200-m microwave brightness temperature data and the 200-m retrieved soil moisture were aggregated to 400, 600, 800, 1200, 1600, and 2400 m resolution, and the preferred value of optical depth was calculated by minimising the difference between retrieved and re-scaled soil moisture, as before. In all cases, there is a linear relationship between optical depth and log(1-NDVI) (with R2 > 99%). Figures 2d-e show that the
slope and intercepts of the linear relationships, derived in this way, depend on resolution. Studies in which empirical relationships between optical depth and NDVI derived at
one resolution were applied in experimental retrievals at another resolution (Fig. 4) suggest that the resulting errors in the regional average surface soil moisture may be as much as 2%. This error is in addition to any retrieval error that may already be present. The transferability of NDVI/optical depth relationships clearly merits study with other data sets and is particularly needed for very low-resolution satellite data.
Validation of retrieval process
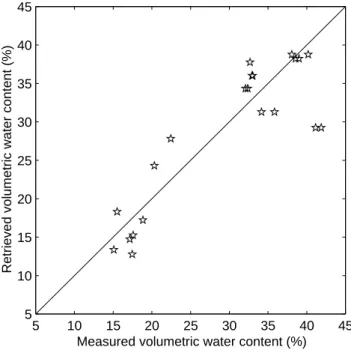
The retrieval process using the simple retrieval algorithm (with optical depth specified from NDVI) was tested at the two remaining sites overflown by the SLFMR during SGP97 (at Little Washita and the Central Facility). In each case, the optical depth was determined from NDVI data using the relationship derived at relevant resolution at El Reno (Figures 2a-c). Figure 5 shows the excellent agreement between retrieved and measured soil moisture at these test sites, with the standard error of the fit 3.8%. Clearly, the
Fig. 3. Retrieved soil moisture for the El Reno area on July 2, 1997 at resolutions of 200, 400, and 600 m.
584000 586000 588000 3932500 3933500 3934500 3935500 3936500 584000 586000 588000 3932500 3933500 3934500 3935500 3936500 10 15 20 25 30 35 40 45 50 55 60 584000 586000 588000 3932500 3933500 3934500 3935500 3936500 600 m resolution 400 m resolution 200 m resolution (%)
Eleanor J. Burke, W. James Shuttleworth and Andrew N. French
rigour of this validation is restricted by the limited validation data available. Much larger data sets are required to test the NDVI-based retrieval process, and this merits consideration in the planning of future field experiments.
Discussion and conclusions
Estimates of optical depth are required for the retrieval of surface soil moisture from remotely sensed microwave brightness temperatures, and it has been suggested that relating optical depth to vegetation water content (Eqn. 1) represents a potential mechanism to meet this need, with the value of b perhaps specified for different vegetation classes from past field studies. However, vegetation water content (and, indeed, the value of b) cannot be derived from remotely sensed data.
This paper explores the potential for using empirically calibrated relationships between optical depth and vegetation index in soil moisture retrieval, with the resolution of the vegetation index data similar to that of measurements of the microwave brightness temperatures. The main disadvantage of this approach is that, during the calibration, it is necessary to assume that the systematic bias is small. Notwithstanding this shortcoming, Fig. 2 shows that, at least in the case of the SGP97 data and at least for lower values of optical depth, there is a strong correlation between the resulting optical depth and NDVI. It is likely that, at high values of optical depth, the relationship between log(1-NDVI) and optical depth may become non-linear, and there may be evidence of this for optical depths greater than 0.6 given in Figs. 2a–b. However, at such high optical depths, microwave brightness temperatures are already relatively insensitive to the soil moisture, and errors in the retrieval algorithm are arguably already significant.
On the basis of the present study, there seems to be some worthwhile potential in using remotely sensed vegetation indices in general, and NDVI in particular, as a surrogate measure of optical depth for surface soil moisture retrieval. However, it is important to remember that the relationship upon which the approach is based is largely empirical and, in this study, the empirical relationship shows some sensitivity to the resolution of the data used. Further studies of the transferability of such empirical relationships clearly merit further investigation. Therefore, it is recommended that future field experiments include field data collection at enough sites to allow both calibration and a more rigorous validation of the retrieval process whose utility is the subject of investigation in the present paper.
Acknowledgments
Primary support for Dr. Eleanor Burke for preparing this paper came from NOAA project NA96GP0412. Additional support for Prof. James Shuttleworth came from NASA project NAG5-7554. The authors wish to acknowledge the contribution of the many people who obtained the soil
Fig. 4. Difference between soil moisture retrieved using a resolution
specific relationship between optical depth and NDVI (lines) and that retrieved using the 200 m resolution relationship between
optical depth and NDVI (lines and symbols).
Fig. 5. Measured and retrieved soil moisture for the (limited)
validation data available during SGP97 at Little Washita and the Central Facility. 5 10 15 20 25 30 35 40 45 5 10 15 20 25 30 35 40 45
Retrieved volumetric water content (%)
Measured volumetric water content (%)
0 500 1000 1500 2000 2500 30 32 34 36 38 40 42 44 46 48 50 Mean Resolution (m)
Soil moisture (% vol.)
June 29 rescaled July 2 rescaled July 3 rescaled June 29 bad tau July 2 bad tau July 3 bad tau
moisture samples at El Reno: and to thank Dr Zoe Frogbrook for geostatistical insight. The editorial assistance of Corrie Thies is greatly appreciated.
References
Burke, E.J., Bastidas, L.A. and Shuttleworth, W.J., 2001. Multi-patch retrieval for the SMOS mission. IEEE Trans. Geosci.
Remote Sens. Submitted.
Burke, E.J., Gurney, R.J., Simmonds, L.P. and O’Neill, P.E., 1998. Using a modeling approach to predict soil hydraulic properties from passive microwave measurements. IEEE Trans. Geosci.
Remote Sens., 36, 454–462.
Burke, E.J., Gurney, R.J., Simmonds, L.P. and Jackson, T.J., 1997. Calibrating a soil water and energy budget model with remotely sensed data to obtain quantitative information about the soil.
Water Resour. Res., 33, 1689–1697.
Burke, E.J. and Simmonds, L.P., 2001a. A simple physically based soil moisture retrieval algorithm and its sensitivity to measurement errors. Hydrol. Earth Syst.Sci., 5, 39–48. Burke, E.J. and Simmonds, L.P., 2001b. Passive microwave
emission from bare soils: developing a simple model to predict near surface water content. Int. J. Remote Sens. In press. Famiglietti, J.S., Devereaux, J.A., Laymon, C.A., Tsegaye, T.,
Houser, P.R., Jackson, T.J., Graham, S.T., Rodell, M. and van Oevelen, P.J., 1999. Ground-based investigation of soil moisture variability within remote sensing footprints during the Southern Great Plains 1997 (SGP97) hydrology experiment. Water
Resour. Res., 35, 1839–1851.
Jackson, T.J., 2001. Multiple resolution analysis of L-band brightness temperature for soil moisture. IEEE Trans. Geosci.
Remote Sens., 39, 151–164.
Jackson, T.J., Le Vine, D.M., Hsu, A.Y., Oldak, A., Starks, P.J., Swift, C.T., Isham, J.D. and Haken, M., 1999. Soil moisture mapping at regional scales using microwave radiometry: the Southern Great Plains Hydrology Experiment. IEEE Trans.
Geosci. Remote Sens., 37, 2136–2151.
Jackson, T.J. and Schmugge, T.J., 1991. Vegetation effects on the microwave emission of soils. Remote Sens. Environ., 36, 203– 212.
Kustas, W.P., Jackson, T.J., French, A.N. and MacPherson, J.I., 2001. Verification of patch- and regional-scale energy balance estimates derived from microwave and optical remote sensing during SGP97. J. Hydrometeorol. 2, 254–273.
Mohanty, B.P., Skaggs, T.H. and Famiglietti, J.S., 2000. Analysis and mapping of field-scale soil moisture variability using high-resolution, ground-based data during the Southern Great Plains 1997 (SGP97) Hydrology Experiment. Water Resour. Res., 36, 1023–1031.
Owe, M., de Jeu, R. and Walker, J., 2001. A methodology for surface soil moisture and vegetation optical depth retrieval using the microwave polarisation difference index. IEEE Trans.
Geosci. Remote Sens., 39, 1643–1654.
Schmugge, T.J., 1998. Applications of passive microwave observations of surface soil moisture. J. Hydrol., 213, 188–197. SGP97 home page. http://daac.gsfc.nasa.gov/CAMPAIGN_DOCS
/SGP97/sgp97.html.
Simmonds, L.P. and Burke, E.J., 1998. Estimating near-surface soil water content from passive microwave remote sensing— an application of MICRO-SWEAT. Hydrolog. Sci. J., 43, 521– 534.
Simmonds, L.P. and Burke, E.J., 1999. Application of a coupled microwave, energy and water transfer model to relate passive microwave emission from bare soils to near-surface water content and evaporation. Hydrol. Earth Syst. Sci., 3, 31–38. Wigneron, J.-P., Waldteufel, P., Chanzy, A., Calvet, J.-C. and Kerr,
Y.H., 2000. Two-D microwave interferometer retrieval capabilities over land surfaces (SMOS Mission). Remote Sens.