Dynamic Processes on Complex Networks:
from Disease Spreading to Neural Activity
by
Christos Nicolaides
B.S., Aristotle University of Thessaloniki (2008)
M.Sc., Imperial College London (2009)
S.M., Massachusetts Institute of Technology (201
AE|NES
~MASSACHUSE& I"OF TECHNOLOGY
JUN
132014
LIBRARIES
Submitted to the Department of Civil and Environmental Engineering
in partial fulfillment of the requirements for the degree of
Doctor of Philosophy in Civil and Environmental Engineering
at the
MASSACHUSETTS INSTITUTE OF TECHNOLOGY
June 2014
@
Massachusetts Institute of Technology 2014. All rights reserved.
Signature redacted
A u th o r ...
...
Department of Civil and Environmental Engineering
May 6, 2014
Certified by...
...
Signature
redacted
Ruben Juanes
Associate Professor of Civil and Environmental En ineerin
Thesis
erviso
Signature
redacted
A ccep ted by ...
Heidi M. Nepf
Chair, Departmental Committee for Graduate Students
Dynamic Processes on Complex Networks:
from Disease Spreading to Neural Activity
by
Christos Nicolaides
Submitted to the Department of Civil and Environmental Engineering on May 6, 2014, in partial fulfillment of the
requirements for the degree of
Doctor of Philosophy in the field of Civil and Environmental Engineering
Abstract
The study of dynamic processes that take place on heterogeneous networks is essen-tial to better understand, forecast, and manage human activities in an increasingly connected world. In this Thesis, we elucidate the role of the network topology as well as the nature of the underlying processes in a variety of phenomena rooted on
highly connected network systems. We use real world applications as the motivation
to address three distinct questions.
The first question is: how is the spread of infectious diseases at the global scale mediated by long-range human travel? We show that network topology, geography, traffic structure and individual mobility patterns are all essential for accurate predic-tions of disease spreading. Specifically, we study contagion dynamics through the air transportation network by means of a stochastic agent-tracking model that accounts for the spatial distribution of airports, detailed air traffic and the correlated nature of mobility patterns and waiting-time distributions of individual agents. We formulate a metric of influential spreading-the geographic spreading centrality-which provides an accurate measure of the early-time spreading power of individual nodes.
The second question is: what is the effect of human behavioral changes in their mobility patterns on the dynamics of contagion through transportation networks? We address this question by developing a model of awareness coupled to disease spreading through mobility networks, where we implement two kinds of behavioral changes: selfish and policy-driven. In analogy with the concept of price of anarchy in transportation networks subject to congestion, we show that maximizing individual utility leads to a loss of welfare for the social group, measured here by the size of the outbreak.
The third question is: what are the mechanisms behind the formation of cell assemblies in neural activity networks? From a neuroscience perspective: How can one explain functional compartmentalization in a globally-connected brain? Here we show that simple mechanisms of neural interaction allow for the emergence of robust cell assemblies through self-organization. We demonstrate the properties of such neural network processes with a minimal-ingredients model of excitation and inhibition between neurons that leads to self-organization of neural activity into local quantized states, even though the underlying network system is globally connected. Thesis Supervisor: Ruben Juanes
Acknowledgments
I am deeply grateful to the family, friends, colleagues, and mentors who have
con-tributed, in one way or another, to the completion of this Thesis. To name only a few, I offer my thanks
to my advisor, Ruben Juanes, for the insight, wisdom, and friendship he has shared with me over the years;
to my co-advisor, Luis Cueto-Felgueroso, for his support and enthusiastic motivation;
to my thesis committee, Marta C. Gonzilez, and Csar A. Hidalgo, for their guidance and encouragement;
to all members of the Juanes Research Group for their enthusiastic and collaborative approach to science, their kindness and friendship, which I will miss but hope to continue;
to the members of the Parsons Laboratory and the Civil and Environ-mental Engineering community that I am sad to leave;
to my parents, Andreas and Maria, and my sister, Joanna, for their unwa-vering confidence that I would always meet their very high expectations;
Contents
1 Introduction
1.1 Influential Spreading During Contagion Dynamics Through the Air Transportation Network . . . . 1.2 The Price of Anarchy in Mobility Driven Contagion Dynamics . . . . 1.3 Self-Organization and Quantized States in Neural Activity . . . .
2 A metric of influential spreading during a contagion dynamics through the air transportation network
2.1 M otivation . . . . 2.2 Stochastic model of agent mobility . . . . 2.2.1 Air transportation data . . . . 2.2.2 Empirical model . . . . 2.2.3 Monte Carlo simulations of disease spreading . 2.2.4 Reference models . . . .
2.3 Global attack . . . . 2.4 Influential spreaders . . . .
2.4.1 Influential spreaders at late times . . . . 2.4.2 Influential spreaders at early times . . . . 2.4.3 Geographic spreading centrality . . . .
2.5 D iscussion . . . . 3 The price of anarchy in mobility-driven contagion
3.1 M otivation . . . . dynamics 15 19 21 22 25 . . . . 26 . . . . 28 . . . . 28 . . . . 29 . . . . 32 . . . . 32 . . . . 34 . . . . 36 . . . . 37 . . . . 37 . . . . 42 . . . . 47 49 49
3.2 Infection Models . . . . 52
3.2.1 Classical metapopulation models . . . . 54
3.2.2 A conceptual, simplified model . . . . 54
3.3 Behavioral changes: awareness, rerouting, and policy . . . . 56
3.4 Mean-field Theory . . . . 57
3.4.1 Invasion thresholds . . . . 59
3.5 Numerical simulations . . . . 62
3.5.1 Monte Carlo simulations of conceptual model on synthetic net-w orks . . . . 62
3.5.2 Comparison between our conceptual model and a classical metapop-ulation model. . . . . 6 7 3.5.3 Data-driven simulations . . . . 3.6 D iscussion . . . . 4 Self-organization and quantized states in neural activity 4.1 M otivation . . . . 4.2 Cell Assemblies . . . . 4.3 Mathematical Model . . . . 4.4 Connection to the Swift-Hohenberg equation . . . . 4.5 Stability Analysis . . . . 4.5.1 Linear stability analysis of flat solutions in time . . . 4.6 Localization: quantized response and robustness . . . . 4.6.1 Stability analysis of resting state in network topology 4.6.2 Localized patterns by direct simulations . . . . 4.6.3 Numerical continuation . . . . 4.6.4 Robustness of the localized states . . . . 4.7 Global patterns and mean-field approximation . . . . 4.7.1 Direct Simulations . . . . 4.7.2 Mean Field Approximation . . . . 4.8 D iscussion . . . . . . . . . 69 . . . . . 73 77 . . . . . 77 . . . . . 79 . . . . . 81 . . . . . 84 . . . . . 84 . . . . . 86 . . . . . 87 . . . . . 87 . . . . . 89 . . . . . 90 . . . . . 94 . . . . . 97 . . . . . 97 . . . . . 97 99
List of Figures
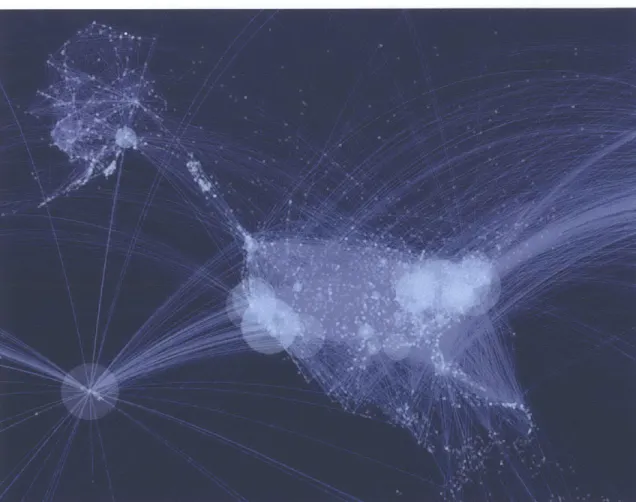
1-1 The map shows flight the U.S. - centric air transportation network. The size of the airport indicates how influential the airport . . . . 20 1-2 The price of anarchy during an epidemic spreading scenario through
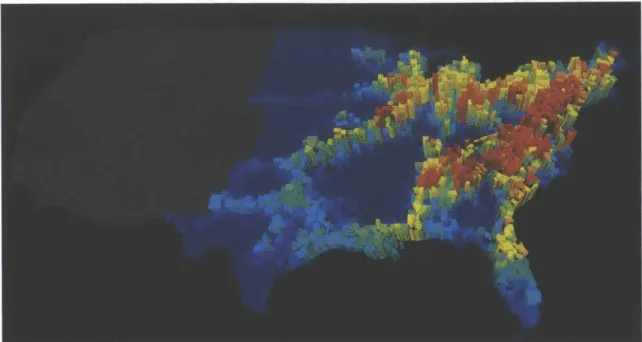
the US commuting network, calculated two weeks after the outbreak starts from each county in the eastern contiguous US . . . . 22
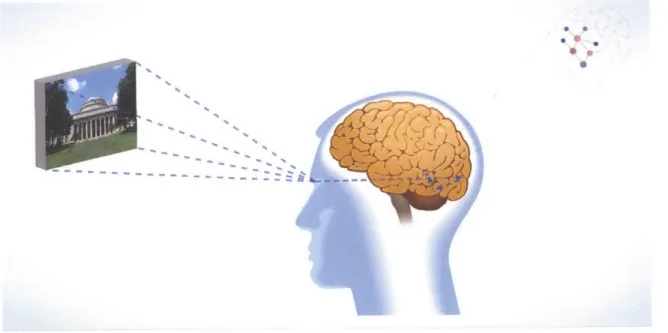
1-3 The sight of a familiar concept triggers a cascade of brain processes
that creates a representation leading to the recognition of the concept through the firing of a finite number of neurons in the temporal lobe of the brain . . . . 23
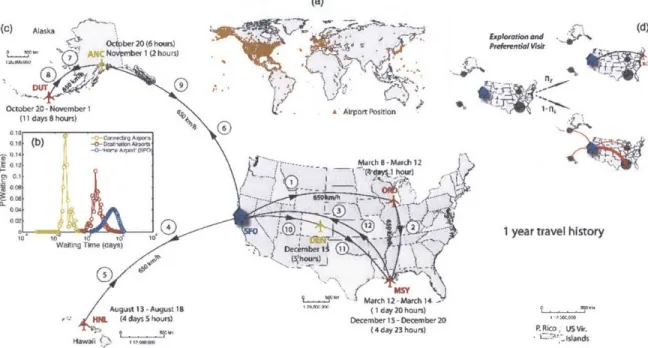
2-1 Pictorial view of the key elements of our empirical model of human mobility through the air transportation network. a) World map with the location of the 1833 airports in the US database from the Federal
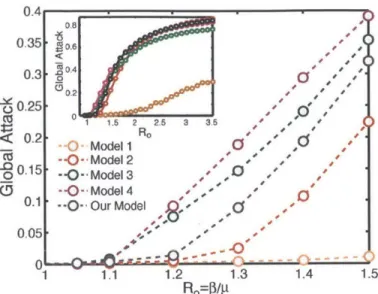
Aviation Administration . . . . 29 2-2 Monte Carlo study of the global attack of an epidemic as a function of
the reproductive number RO, for the different models explained in the text. We used a value of the recovery rate p-'= 4 days . . . . 36 2-3 Late-time spreading ability of different airports, measured by the global
attack of an SIR epidemic that originates at each airport. (a) Global attack as a function of reproductive number, for five different airports
2-4 Ranking of influential spreaders by the normalized early-time mean square displacement of infectious individuals. We initialize the disease
by infecting 10 individuals from each specific airport (see inset), and
use /- = 4 days. Each point is the result of a Monte Carlo study . . 40
2-5 Ranking of influential spreaders by the normalized early-time Total
Square Displacement (a) for different reproductive numbers, 10 days after the disease is initiated. (b) Ranking of influential spreaders by the normalized early-time . . . . 41
2-6 Ranking of influential early-time spreaders by existing metrics. . . . . 42 2-7 Role of spatial organization, traffic quenched disorder, and mobility
patterns, on early-time spreading. (a) Shown is the TSD-ranking for individual realizations of two null networks testing the influence of
(1) geographic locations of the nodes, and (2) heterogeneity in the
traffic of the links . . . . 44
2-8 Ranking of influential spreaders at early times from the geographic
spreading centrality (GSC). The GSC metric predictions are in quan-titative agreement with the results from the Monte Carlo study on the em pirical m odel. . . . . 46
3-1 Pictorial illustration of the network model. (a) The three routing
strategies studied in the model. An individual who is not aware of the disease travels to the destination through the shortest path (black) 53
3-2 Phase diagram of the coupled contagion processes at steady state. The
phase diagram for the prevalence of the two spreading processes in the case of coordinated (a) and selfish (b) awareness . . . . 61 3-3 Monte-Carlo simulations with global policy adoption. We show the
density of infected nodes at the steady state, as a function of the degree of awareness, W, and the product of the infection rate by the traffic param eter OA . . . . 64
3-4 Monte-Carlo simulations with spreading policy/awareness. (a) Density of infected nodes the steady state, p, as a function of the product
OA and the adoption of awareness rate #a" that initiates policy made
rerouting behavior . . . . 65 3-5 Policy driven behavioral changes on an SIR epidemic model. (a) Time
evolution of the density of infected subpopulations, under a policy driven behavior, for the SIS and SIR infection models . . . . 66 3-6 Comparison between the conceptual and metapopulation models:
Monte-Carlo simulations with spreading policy/awareness. (a) Conceptual model. Density of infected nodes at the steady state, p, as a function of the product OA and the adoption of awareness rate 0a, that initiates policy driven rerouting behavior . . . . 70 3-7 Coupled information and epidemics in the US commuting network.
The price of anarchy, two weeks after an epidemic starts from each county in the East Coast of the United States. . . . . 71 3-8 The social dilemma for choosing the path to the destination in the US
commuting network during an event of epidemic spreading. . . . . 73
4-1 Motivation and pictorial illustration of our dynamical model in neural networks. (A) The sight of a familiar concept triggers a cascade of brain processes that creates a representation leading to the recognition of the concept through the firing of a finite number of neurons in the brain (cell assemblies) . . . . 85
4-2 Linear stability analysis of the flat stationary solutions of our model.
(A) maximum value of the growth rate A as a function of the bifurcation
parameter p for the two flat stationary states u+ (yellow) and u- (blue) on a B-A network model with mean degree (k) = 3 and size N = 2000 88
4-3 Graphical interpretation of pseudo-arclength continuation on the bi-furcation diagram . . . . 92
4-4 Localized self-organized quantized patterns. (A) Stability of the trivial
flat stationary state of our model with respect to the values of the bifurcation param eter, ft . . . . 93
4-5 Robustness of quantized patterns with respect to the input signal am-plitude. (A) Energy of the resulting quantized state with respect to the input signal amplitude ft at the nearest and next-nearest neighbors of the best connected node in the system . . . . 95
4-6 Robustness of quantized patterns with respect to the noise over the signal amplitude of the input . . . . 96
4-7 The formation of global activation Turing patterns in a scale-free net-work. The time evolution of the proposed model of Eq. 4.9 with bifur-cation parameter equal to p = -0.25 on a scale-free network of size N
= 1,000 nodes and mean degree (k) = 4 . . . . 98
4-8 Global self-organization patterns for our toy network model. Global patterns are possible when the non-active stationary solution is per-turbed outside the parameter region of localized patterns (p < 0). The
initial exponential growth of the perturbation is followed by a nonlinear process leading to the formation of stationary Turing patterns . . . . 100
4-9 Global self-organization patterns for large networks. (A) The activa-tion profile as a funcactiva-tion of the node index i of global staactiva-tionary Turing patterns from direct simulation for bifurcation parameters . . . 101
Chapter 1
Introduction
We live in the age of an increasingly connected world (Lazer et al., 2009). The Inter-net, the world wide web, and social media are networks that we navigate and explore on a daily basis (Albert et al., 1999; Faloutsos et al., 1999). Mobility, ecological, and epidemiological models rely on networks that consist of entire populations interlinked
by the exchange of individuals (Montoya et al., 2006; Gonzilez et al., 2008;
Brock-mann et al., 2006; Hancock et al., 2009). Life is based on biological networks like the "connectome" of neural interactions in the brain (Bullmore and Sporns, 2009; Sporns, 2011) and the network of molecular interactions in the body (Jeong et al., 2000; Guimera and Amaral, 2005; Barabaisi et al., 2007). Network science, therefore, is where we can expect answers to many problems and challenges of our modern world, from controlling traffic flow and flu pandemics to unlocking the mysteries of the human mind (Barabisi, 2009).
Over the last decade, the study of complex systems has dramatically expanded across diverse scientific fields, ranging from social sciences and physics to biology and medicine (Albert and Barabisi, 2002; Barabisi, 2009; Girvan and Newman, 2002; Eagle et al., 2009). This expansion reflects modern trends and currents that have changed the way scientific questions are formulated and research is carried out. In our days science is increasingly concerned with the structure, behavior, and evolution of complex systems from the micro scale-like cells and brains-to the macro scale such as ecosystems, societies or the global economy. To understand these systems, we
require not only knowledge of the elementary system components but also knowledge of the ways in which these components interact and the emergent properties of they interactions. The recent evolution in big data availability and computing power makes it easier than ever before, to record, analyze and model the behavior of complex systems composed of thousands or millions of interacting element components (Lohr, 2012).
All such complex systems display characteristic diverse and organized patters.
These patterns emerge as a manifestation of collective behavior between the individ-ual elements, achieved through an intricate web of connectivity. Connectivity comes in many forms-for example, molecular interactions, metabolic pathways, synaptic connections, semantic associations, ecological and food webs, social networks, web hyperlinks, human mobility and transportation, economic exchanges between coun-tries or citation pattern (Jeong et al., 2000; Spirin and Mirny, 2003; Sporns, 2011; Steyvers and Tenenbaum, 2005; DallAsta et al., 2006; Montoya et al., 2006; Dune et al., 2002; Gonzilez et al., 2007; Apicella et al., 2012; Rutherford et al., 2013; Aral and Walker, 2012; Schweitzer et al., 2009; Wang et al., 2013). In all of these cases, the quantitative analysis of connectivity and other structural properties requires so-phisticated mathematical and statistical tools (Albert and Barabisi, 2002).
The study of complex systems began with the effort to identify their structure and develop models that can reproduce their statistical properties. The first model was proposed by Erdos and Renyi at the end of the 1950s (Erdos and Renyi, 1960) and was at the basis of most studies until recently. They assumed that nodes in complex systems are wired randomly together, a hypothesis that was adopted by sociology, biology, and computer science at the second half of the 20th century. It had considerable predictive power, explaining for example why everybody is only six handshakes from anybody else , a phenomenon observed as early as 1929 and is well known as 'the six degrees of separation' (Milgram, 1967) . However, this model failed to explain a common property of social networks where cliques form, representing circles of friends or acquaintances in which every member knows every other member (Jin et al., 2001). This latter property is characteristic of ordered
regular lattices.
In 1998, the interest in networks was however renewed when Watts and Strogatz extracted stylized facts about the properties of real-world networks. They show that a large variety of socio-technical and biological networks exhibit the so-called
small-world property of being both highly clustered and having a short path-length and they
proposed a new model of random networks that is a simple interpolation between an ordered finite-dimensional lattice and a random graph (Watts and Strogatz, 1999).
In the above models, the number of nodes a node is connected with (degree or connectivity) is similar for all the nodes. In detail, the degree distribution of a random graph follows a a Bionomial distribution for small system sizes and Poisson distribu-tion in the large system limit (Newman et al., 2001). One of the most interesting developments in our understanding of complex networks was the recent discovery that for most large real-world networks the degree distribution significantly deviates from a Poisson distribution. In particular, for a large number of networks, including the World Wide Web (Albert et al., 1999), the Internet (Faloutsos et al., 1999), or metabolic networks (Jeong et al., 2000), the degree distribution has a power-law tail,
P(k) ~ k-. (1.1)
indicate the lack of scale. Such systems are usually called scale free networks (Barabisi and Albert, 1999). While some networks display an exponential tail, often the func-tional form of P(k) still deviates significantly from the Poisson distribution expected for a random graph.
The origin of the power-law degree distribution observed in networks was first addressed by Barabaisi and Albert (1999) (Barabasi and Albert, 1999), who argued that the scale-free nature of real networks is rooted in two generic mechanisms shared
by many real networks: Growth and Preferential Attachment: (i) Growth. Starting
with a small number of nodes, at every time step, a new node with open edges is introduced in the system . (ii) Preferential Attachment. The probability that the recently introduced node is connected with an already existing node is proportional
to the the degree of the latter. Numerical simulations indicate that this network evolves into a scale-invariant state with the degree of a node following a scale-free distribution with power law exponent close to 3 (Barabisi and Albert, 1999).
While the initial research interest focus on characterizing the structure of real complex systems, shortly came the realization that the complexity in structure af-fects a variety of real-world phenomena. A prototypical example is that of contagion processes. Epidemiologists, computer scientists and social scientists share a common interest in studying contagion phenomena and rely on very similar spreading mod-els for the description of the diffusion of viruses, knowledge and innovations (Lloyd and May, 2001; Goffman and Newill, 1964). Questions concerning how pathogens spread in population networks, how blackouts can spread on a nationwide scale, or how efficiently we can search and retrieve data on large information structures are generally related to the dynamics of spreading and diffusion processes on underlying heterogeneous topologies.
Recent work has shed light in our understanding of how dynamical systems be-have on complex systems. The adoption of ideas through social networks (Toole et al., 2012; Centola, 2010), the spreading of diseases through structured popula-tions via human mobility (Balcan and Vespignani, 2011; Belik et al., 2011; Nicolaides et al., 2012), the diffusion of viruses through computer systems (Pastor-Satorras and Vespignani, 2001, 2002) and the neuronal activity that leads to perception in human brain (Belykh et al., 2005; Bullmore and Sporns, 2009; Sporns, 2011) are only a small number of dynamical models that have been studying extensively on network topolo-gies. These models offer a number of interesting and sometimes unexpected insights, whose theoretical understanding represents a new challenge that has considerably transformed the mathematical and conceptual framework for the study of dynamical processes in complex systems (Vespignani, 2012).
In this thesis, we present dynamic models on heterogeneous network topologies in the context of mobility driven epidemic spreading and neuronal activity in human brain networks. We develop analytical, semi-analytical and numerical solutions to the models in several limiting cases and we use these solutions to get insights into real
world processes. We then support our results using data driven simulations. Finally, we discuss the applicability and the limitations of the models and we draw future research directions.
1.1
Influential Spreading During Contagion
Dy-namics Through the Air Transportation
Net-work
Public health crises of the past decade - such as the 2003 SARS outbreak, which spread to almost forty countries and caused about a thousand deaths (Consortium et al., 2004; Anderson et al., 2004), and the 2009 HIN flu pandemic that killed about
300,000 people worldwide (Fraser et al., 2009; Hancock et al., 2009) - have height-ened awareness that new viruses or bacteria could spread quickly across the globe, aided by long range travel through the global transportation network (Guimera and Amaral, 2005; Colizza et al., 2006). While epidemiologists and scientists who study complex network systems - such as contagion patterns and information spread in social networks - are working to create mathematical models that describe the world-wide spread of disease, to date these models reflect an emphasis on the asymptotic late-time behavior of contagion processes, typically characterized by infection thresh-olds and the number of infected cases (Colizza et al., 2007; Meloni et al., 2009; Balcan and Vespignani, 2011; Belik et al., 2011), but leave open the question of what the early-time behavior of an outbreak is (Balcan et al., 2009).
In the second chapter of this thesis, we study contagion dynamics through the air transportation network by means of a stochastic agent-tracking model that accounts for the spatial distribution of airports, detailed air traffic and the correlated nature of mobility patterns and waiting-time distributions of individual agents. From the sim-ulation results and the empirical air-travel data, we formulate a metric of influential spreading-the geographic spreading centrality-which accounts for spatial organiza-tion and the hierarchical structure of the network traffic, and provides an accurate
measure of the early-time spreading power of individual nodes [Fig 1-3]. We finally study intervention scenario during an outbreak emergency and we discuss potential policy implications.
Figure 1-1: The map shows flight the U.S. - centric air transportation network. The size of the airport indicates how influential the airport is to globally spread a contagious disease shortly after the outbreak starts (Nicolaides et al., 2012). New York's JFK airport taking the top spot, followed closely by Los Angeles' LAX and Honolulu airport.
1.2
The Price of Anarchy in Mobility Driven
Con-tagion Dynamics
In an epidemic or a bioterrorist attack, the response of government officials could range from a drastic restriction of mobility imposed isolation or total lockdown of a city to moderate travel restrictions in some areas or simple suggestions that people remain at home. Deciding to institute any measure would require officials to weigh the costs and benefits of action, but at present theres little data to guide them on the question of how disease spreads through transportation networks (Ferguson et al., 2006; Hollingsworth et al., 2006; Epstein et al., 2007). However, official policy recommendations by themselves, cannot determine the patterns of human mobility through transportation networks during epidemics. Instead, individual incentives catalyze the behavioral changes of individuals.
In the event of a health emergency, the pursuit of maximum social or individual utility may lead to conflicting objectives in the routing strategies of network users. Individuals tend to avoid exposure so as to minimize the risk of contagion, whereas policymakers aim at coordinated behavior that maximizes the social welfare. In the third chapter of this thesis, we study agent-driven contagion dynamics through transportation networks, coupled to the adoption of either selfish- or policy-driven rerouting strategies. In analogy with the concept of price of anarchy in transporta-tion networks subject to congestransporta-tion (Youn et al., 2008), we show that maximizing individual utility leads to a loss of welfare for the social group, measured here by the total population infected after an epidemic outbreak (Nicolaides et al., 2013). We test our hypothesis, and discuss its policy implications, through mean-field theories and Monte Carlo simulations on synthetic and data-driven network models [Fig 1-21.
Figure 1-2: The price of anarchy during an epidemic spreading scenario through the
US commuting network, calculated two weeks after the outbreak starts from each
county in the eastern contiguous US calculated as the difference of the size of the outbreak in the presence of selfish and coordinated awareness.
1.3
Self-Organization and Quantized States in
Neu-ral Activity
The functional activity of neurons in human brain is often organized in finite areas of the cerebral cortex. Recent experiments have shown that distinct concepts and memories are mapped into a small fraction out of the billions of neurons that form the medial temporal lobe of a normal brain (Quiroga et al., 2005). However, what are the mechanisms that allow quantized and localized pattern formation in a globally connected network are still poorly understood (Bear, 1996; Buzsiki, 2010).
Strong nonlinear feedbacks in dynamical systems out of equilibrium lead to the emergence of complex spatiotemporal patterns. Reaction-diffusion systems exhibit a rich variety of self-organized patterns, from stationary dissipative structures and traveling waves, to rotating spirals and chemical turbulence (Smoller, 1983; Cross and Hohenberg, 1993; Vanag and Epstein, 2001; Kim et al., 2001; Kondo and Miura, 2010). In network-organized systems, pattern formation often appears in the form
of synchronization and Turing patterns (Turing, 1952; Nakao and Mikhailov, 2010). However, the mechanisms that allow for the formation of localized patterns of activity in globally interconnected systems is still unknown.
In the fourth chapter of this thesis, we propose a minimal ingredients model of neuron dynamics and synaptic interaction that reproduces both global and local self-organized patterns of activation observed in the brain's functional activity. We relate the characteristics of the pattern formation to both the topological properties of the network and to the nonlinear structure of the underlying process. We finally discuss the implications of our findings in learning, perception and brain computation theories (Nicolaides et al., 2014).
Figure 1-3: The sight of a familiar concept triggers a cascade of brain processes that creates a representation leading to the recognition of the concept through the firing of a finite number of neurons in the temporal lobe of the brain. The big question is: what are the mechanisms that can lead to these kind of localized patterns (cell assemblies) in a globally connected network? In the third chapter of this thesis, we propose a minimal ingredients model of firing in neuronal networks which is able to trigger self-organized "quantized" patterns of activity.
Chapter 2
A metric of influential spreading
during a contagion dynamics
through the air transportation
network
In this chapter, we present a new metric to identify and rank influential spreaders of infectious diseases in human transportation networks. Our metapopulation model of contagion dynamics is based on a time-resolved stochastic description of individual agent mobility through the air transportation system. The model is traffic-driven, and agents traverse the network following empirical stochastic rules that reflect the patterns of individual human mobility (Gonzilez et al., 2008; Song et al., 2010). These rules include exploration and preferential visit (Song et al., 2010), and distributions of waiting times between successive flights that depend on demography. We show that the late-time spreading, as measured by the global attack, depends strongly on traffic and heterogeneity of transition times. We are interested in characterizing, a
priori, the early-time spreading potential of individual nodes, as measured by the
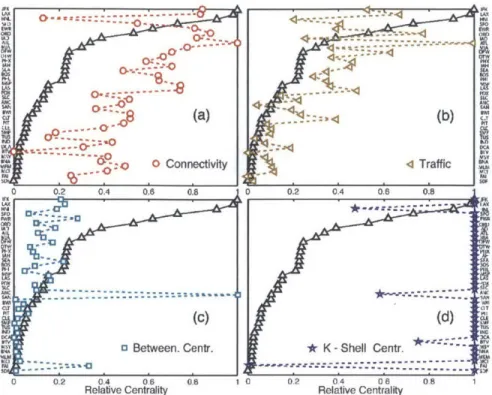
total square displacement of infected agents. We find that existing metrics of influ-ential spreading-including connectivity (Barabaisi and Albert, 1999), betweenness
centrality (Guimeri et al., 2005) and k-shell rank (Kitsak et al., 2010; Kempe et al., 2005)-do not successfully capture the spreading ability of individual nodes, as re-vealed by Monte Carlo simulations. We show that the origin of this disparity lies on the role of geography and traffic on the network (Onnela et al., 2011), and we propose a new metric-the geographic spreading centrality-tailored to early-time spreading in complex networks with spatial imbedding and heterogeneous traffic structure. The results are published in PLoS ONE (Nicolaides et al., 2012).
2.1
Motivation
The spreading of infectious diseases is an important example that illustrates the societal impact of global connectivity in man-made transportation systems (Hufnagel et al., 2004; Balcan et al., 2009). Outbreaks expose the vulnerability of current human mobility systems, and challenge our ability to predict the likelihood of a global pandemic, and to mitigate its consequences (Bajardi et al., 2011).
Network models of epidemic spreading have rationalized our understanding of how diseases propagate through a mobile interactome like the human population. "Fermionic" models regard each node as an individual, or a perfectly homogeneous community. In these models, the epidemic threshold for disease spreading vanishes in (infinite-size) scale-free networks, owing to the broad degree distribution (Pastor-Satorras and Vespignani, 2001; Castellano and Pastor-(Pastor-Satorras, 2010). "Bosonic", or metapopulation, models conceptualize nodes as subpopulations that can be occupied
by a collection of individuals (Colizza et al., 2007; Colizza and Vespignani, 2007).
Metapopulation network models thus recognize that spreading of a disease within a node is not instantaneous. Here we adopt a metapopulation-network approach, precisely because of the interacting timescales for traffic-driven transport between nodes and contagion kinetics within nodes.
It has been shown recently that advection-driven transport, or bias, in complex networks exerts a fundamental control on agent spreading (Nicolaides et al., 2010), leading to anomalous growth of the mean square displacement, in contrast with purely
diffusive processes. The crucial role of traffic-driven transport has also been pointed out in the context of epidemic spreading (Meloni et al., 2009), where it has been shown to directly affect epidemic thresholds.
Given that epidemic spreading is mediated by human travel, and that individual human mobility is far from being random (Brockmann et al., 2006; Gonzalez et al.,
2008; Song et al., 2010), it is natural to ask how the non-Markovian nature of
indi-vidual mobility affects contagion dynamics. A model of recurrent mobility patterns characterized by a return rate to the individual's origin has recently been incorporated into an otherwise diffusive random-walk metapopulation network model (Balcan and Vespignani, 2011; Belik et al., 2011). A mean-field approximation, as well as Monte Carlo agent-based simulations of the process, reveal a transition separating global invasion from extinction, and show that this transition is heavily influenced by the exponent of the network's degree distribution (Balcan and Vespignani, 2011).
The impact of behavioral changes on the invasion threshold and global attack have recently been analyzed in the context of an SIR infection model (Meloni et al., 2011).
In that study it is shown how individual re-routing strategies, where individuals modify their travel paths to avoid infected nodes, influence the invasion threshold and global levels of infection. It is found that selfish individual behavior can have a detrimental effect on society as a whole by inducing a larger fraction of infected nodes, suggesting that the concept of price of anarchy in transportation networks (Youn et al., 2008) operates also during disease spreading at the system level.
Taken together, these previous results reflect an emphasis on the asymptotic late-time behavior of contagion processes, typically characterized by infection thresholds and the fraction of infected nodes for both "fermionic" (Meloni et al., 2009; G6mez et al., 2010) and "bosonic" networks (Colizza et al., 2007; Colizza and Vespignani,
2007; Balcan and Vespignani, 2011; Meloni et al., 2011), but leave open the question
of what the early-time behavior is (Balcan et al., 2009). Here, we address this question
by developing a framework for contagion dynamics on a metapopulation network that
incorporates geographic and traffic information, as well as the time-resolved collective transport behavior of individual stochastic agents that carry the disease. Resolving
the temporal dynamics is critical to capture the nontrivial interplay between the transport and reaction timescales.
2.2
Stochastic model of agent mobility
2.2.1
Air transportation data
We develop a stochastic model of human mobility through a US-centric air trans-portation network. We use air-travel data provided by the Federal Aviation Admin-istration (www.faa.gov) that includes all flights from all domestic and international airlines with at least one origin or destination inside the US (including Alaska and Hawaii), for the period between January 2007 and July 2010. Note that we do not have traffic information about flights whose origin and destination is outside the US. The air transportation network is a space-embedded network with 1833 airports, or nodes, and approximately 50,000 connections, or directed links (Fig. 2-1a). It is a
highly heterogeneous network with respect to the degree k (or connectivity) of each
node, the population associated with each node, as well as the traffic volume through the links of the network (Guimeri et al., 2005; Meloni et al., 2009). The traffic data is organized in two datasets: "Market" and "Segment". The Market dataset counts trips as origin-to-final-destination, independently of the number of interme-diate connecting fights. The Segment dataset counts passengers between pairs of airports, without consideration of the origin and final destination of the whole trip. For example, a passenger that travels from Boston (BOS) to Anchorage (ANC), with connecting flight at Seattle (SEA), would be counted only once in the Market dataset as a passenger from BOS to ANC. In the Segment dataset, however, the passenger would be counted both in the segment BOS-SEA, and in the segment SEA-ANC. From these datasets we extract two weighted matrices that characterize the network traffic: a traffic flux matrix Wf = [w{,] where wf is the yearly passenger traffic from
origin i to destination
j;
and a traffic transport matrix Wt[<]
where w' is the yearly passenger traffic in the segment from airport i to airport j.In addition to the aggregate traffic data, we use information of individual itineraries, provided by a major US airline for domestic trips (Barnhart et al., 2010). This dataset extends over a period of four months in 2004 and includes 3.2 million tickets. We use it to extract the waiting time distribution at final destinations and at connecting airports (Fig. 2-1b).
(a)
(C) Alaska -. Or tZ (d)
Exploration and
October 20 (6 hours) Ir rrfnni ii
( Novnmber1(2hours)
no
October 20 -November 1 Airport Position I
(11 days 8 hours) %
0.10 (b) ?w -0 CdgAkpof Ilk
arch -March 12
C1 ... year trve stryw
Avgust13 - August 18 (1 day 20 hours) T
A HPN S ours)December15 (4 dys -December 2O
(4 day 23 hours) PRico USVir
10aau 10 Id > _0~ a W--~sa
Figure 2-1: Pictorial view of the key elements of our empirical model of
human mobility through the air transportation network. (a) World map
with the location of the 1833 airports in the US database from the Federal
Avi-ation AdministrAvi-ation (www.faa.gov). (b) Waiting time distributions at connecting
and destination airports
(from (Barnhart
et al., 2010)), and at the "home" airport.(c) Illustration of a 1-year travel history of an individual with "home" at San
Fran-cisco International Airport
(SF0).
(d) Graphical representation of the probabilities for exploration and preferential visit of the same individual, after the 1-year "training period." During exploration the agent visits a new airport while during preferential visit the agent visits a previously-visited place with probability proportional to the frequency of previous visits to that location.2.2.2 Empirical model
We use the data to build an empirical model of human mobility through the air transportation network. To each airport i, we assign a population P by an empirical relation
(Colizza
et al., 2006), P( ~Grp which reflects a correlation betweenpopu-lation and yearly total outgoing traffic at that airport, T = Ej wf. Therefore, each individual agent in the model has a "home airport" (Balcan and Vespignani, 2011; Meloni et al., 2011).
Individual agents traverse the network following empirical stochastic rules. Ini-tially, before individuals build up a travel history, each individual positioned at their "home airport" chooses a destination airport with probability proportional to the traffic flux (Meloni et al., 2009, 2011), HI ~ w. Since the flux matrix accounts for trips in which the individual remains under the same flight number, we allow for an agent choosing some other destination with a small probability, rlik~ min w23.
The agent then establishes an itinerary, or space-time trajectory, to reach the destination. We make the ansatz that the route chosen minimizes a cost function, which generally increases with the cumulative time-in-transit and the monetary cost of the ticket. Given that the trip elapsed time correlates well with the number of connections and the physical travelled distance, and that ticket price decreases with route traffic, we use the following empirical cost function associated with origin i and destination
j:
c
d6
Cij = k (2.1)
all segments
where dkl is the physical distance of the segment k -- 1 (accounting for the sphericity
of the Earth), and the exponents 6 and E lie on the value ranges 0.1 < 6 < 0.3 and
0.1 < E
<
0.5. Which trip route is selected depends on the particular values of 6 andF. The ranges of values for these two parameters are chosen on the basis of producing itineraries that closely match those from real itinerary data (Barnhart et al., 2010). To incorporate in our model the uniqueness of each passenger's needs, we choose a unique combination of these two exponents for each individual. This reflects the current endemic heterogeneity in route selection from the wide range of connections, airline and price choices.
When an agent is off ground, we assume he moves between airports with a con-stant velocity of 650 km/h. When not flying, an agent can be at one of three distinct places: at their home node, at a connecting airport, or at a destination. The
wait-ing times of an individual at each of these locations is clearly very different. We obtain waiting time distributions for connecting airports and final destinations from the individual mobility dataset (Barnhart et al., 2010), which indeed reflect a very different mean waiting time: in the order of a few hours at connecting airports, and a few days at destinations (Fig. 2-1b). Since the dataset lacks individual travel his-tory, we cannot extract waiting times at the home airport, and we assume they are normally distributed (Colizza et al., 2007; Balcan and Vespignani, 2011) with mean -r ~ Pi
/
T ~ T 1/2 and standard deviation orT -rFh, which recognizes that the average person in densely populated areas travels more often. This is based on the empirical relation between total traffic and population of an area (Colizza et al.,2006). For simplicity, we truncate the home waiting time distribution from below at Th = 1 day.
An important aspect of our empirical model is the stochastic pattern of individual mobility that we implement. Initially, during a "training period" of -1 year, we let all agents choose destinations according to a traffic-weighted probability, as explained earlier (Fig. 2-1c). However, it is by now well established that individual mobility patterns are far from random (Gonzalez et al., 2008) and that their statistics can be reproduced with two rules, exploration and preferential visit (Song et al., 2010), which we introduce after the training period, once individuals have built some travel history (Fig. 2-1d). During exploration, an agent visits a new airport with probability HE =
pS
',
where S is the number of airports an agent has visited in the past. We use y = 0.21 ± 0.02 and p (p > 0) from a Gaussian distribution with mean P = 0.6and standard deviation up = 0.09, values that fit human mobility patterns from real mobile phone data (Song et al., 2010). In the absence of comprehensive data for individual long-range travel history, we make the assumption that the parameters used to reproduce local human mobility can be applied for long range travel. The new airport is chosen according to traffic from node i. During preferential visit, the agent selects a previously-visited airport with complementary probability HR = 1 - HE.
For an agent with home at airport i, the probability Hij of visiting an airport
j
is proportional to the frequencyfj
of previous visits to that location, Hij ~f
3 . Becausethe travel history built by individuals is mediated by traffic, the mobility model with exploration and preferential visit honors the initial traffic flux matrix.
2.2.3
Monte Carlo simulations of disease spreading
For a single 'mobility' realization, we run our empirical model of human mobility through the air transportation network with 5 x 10⁵ agents that are initially dis-tributed in different "home" subpopulations. During an initial period of one year (training period), the agents are forced to choose destinations according to the traf-fic flux matrix. During this training period each individual develops a history of mobility patterns. Collectively, the mobility patterns honor the aggregate traffic structure from the dataset. During the second year, we incorporate the exploration and preferential-visit rules to assign destinations to individual agents. We use a time step of 0.5 hours, which we have confirmed is sufficient to resolve the temporal dy-namics of the traffic-driven contagion process. For a given 'mobility' realization, we simulate the 'reaction' process as follows: we apply the SIR compartmental model at a randomly chosen time during the first half of the second year by infecting 10 individuals. In the study of late-time global attack, those 10 individuals are selected randomly across the entire network. For the study of early-time spreading, they are selected from the same subpopulation. For the Monte Carlo study, we average the results (global attack and TSD) over 20 mobility and 200 reaction realizations.
2.2.4
Reference models
Our empirical model of human mobility through the air transportation network incor-porates a number of dependencies that reflect the complex spatiotemporal structure of collective human dynamics. To understand which of these dependencies are essen-tial, and which affect the modeling results to a lesser degree, we consider four different models of increasing complexity.
In Model 1, we consider the US air transportation network but retain only infor-mation about the topology of the network. We model mobility as a simplified diffusion
process, in which all individuals perform a synchronous random walk, moving from one node to another, all at the same rate (Colizza and Vespignani, 2007; Colizza et al., 2007). We choose this rate to be the average rate at which individuals travel in our empirical model. Under these assumptions, all nodes with the same degree k have the same behavior. We assign to each node a population corresponding to the stationary state, predicted by the mean-field theory (Colizza and Vespignani, 2007): for a node of degree k, Nk Nk/(k), where (k) denotes the mean of the degree distribution Pk(k), and 1 = ik NkPk(k) is the average nodal population.
In Model 2, we extend Model 1 by incorporating heterogeneity in the transition rates, as evidenced by the traffic data. To each node i we assign a transition rate Or ~ T 1/2, but individuals still select a destination randomly, with probability 1/ki.
In Model 3, we extend Model 2 by enforcing that destination selection by individ-uals is done according to traffic: the probability of an individual at node i selecting destination
j
is proportional to wfIn Model 4, we extend Model 3 by considering a simplified model of recurrent mobility patterns (Balcan and Vespignani, 2011; Meloni et al., 2011). Each individual is initially assigned to a "home" node. Individuals perform a random walk through the network of quenched transition rates and heterogeneous traffic, but return to their original subpopulation with a single recurrent rate -1 (Balcan and Vespignani,
2011). We select T = 7 days, corresponding to the mean waiting time at destination
airports obtained from actual data (Barnhart et al., 2010).
Several important differences exist between the reference models described above and our empirical model of human mobility. For instance, the reference models all discard geographic information. They also all assume that agent displacements are instantaneous and synchronous, taking place at discrete time integers (e.g. one day), and neglect the large heterogeneity in waiting times. We will see that resolving these spatio-temporal processes, while not critical for late-time measures of disease spreading, is essential in the early-time contagion dynamics.
2.3
Global attack
To study the dynamics of disease spreading through the air transportation network, we use the Susceptible-Infected-Recovered (SIR) contagion model. This model di-vides each subpopulation into a number of healthy (or susceptible, S), infected (I) and recovered (R) individuals, and it is characterized by a contagion reaction,
S + I - 21, (2.2)
and a recovery reaction,
I14 R, (2.3)
where / and p are the infection and recovery reaction rates, respectively, defined as the number of newly infected (resp. recovered) individuals per unit time for each initial infectious individual in a fully-susceptible subpopulation. Let (Si(t), Ii(t), Ri(t)) be the number of individuals in each class in node i at time t, which satisfy
Si(t)+ Ii(t)+ Ri(t) = Ni (2.4)
at all times. Under the assumption of homogeneous mixing within a city, the proba-bilities for a susceptible individual to become infected is Hs+1 = 1 - (1 - /At/Ni)',/
and for an infected individual to recover is HIR = pAt, which reflect the dependence on the time step At. According to these rules, the expected increment in the infected and recovered populations at time t
+
At areAli = /AtIi(t)Sj(t)/Nj (2.5)
and
AR = pAtIj(t), (2.6)
respectively, assuming that during the reaction step At the subpopulation does not experience inflow or outflow of individuals. In our model, however, we track the state
of each individual in the network. The reproductive number RO = 3/P determines the ratio of newly infected to newly recovered individuals in a homogeneous, well-mixed and fully-susceptible population. From this observation follows the classic result on the epidemic threshold in a single population, Ro > 1. Much work has been
devoted to the study of epidemic thresholds in metapopulation networks (Colizza and Vespignani, 2007; Colizza et al., 2007; Balcan and Vespignani, 2011), which generally shows that the reproductive number must be greater than 1 for global spreading of
an outbreak.
We apply the SIR contagion model to the four reference models described above and to our empirical mobility model. We employ the global attack, defined as the asymptotic (late-time) fraction of the population affected by the outbreak, as our measure of the incidence of the epidemic. We initialize the disease with a small number of infected individuals randomly chosen from the whole population. We obtain representative statistics by performing a Monte Carlo study and averaging over many realizations.
We find that the global attack is quite sensitive to the degree of fidelity of the metapopulation mobility model, especially in the range of low reproductive numbers (Fig. 2-2). Naturally, the global attack increases with Ro for all models. There is a dramatic difference in the global attack between Models 1 and 2, highlighting the critical influence of quenched disorder in the transition rates or out of individual sub-populations. The global attack increases also from Model 2 to Model 3, reflecting the super-diffusive anomalous nature of spreading when agent displacements are driven
by traffic, as opposed to a diffusive random walk (Nicolaides et al., 2010; Meloni
et al., 2009). In comparison with these two effects-quenched disorder in transition rates and traffic-driven spreading-recurrent individual mobility patterns (Balcan and Vespignani, 2011; Meloni et al., 2011) have a relatively mild influence on the global attack, as evidenced by the differences between Models 3 and 4. We observe that the additional complexity included in our empirical model-geographic information, high-fidelity individual mobility, and time-resolved agent displacements-induces a slight delay in the epidemic threshold with respect to Models 3 and 4, indicating the
0.4 0.8 0.35 0. 03 *0.4 J. 0.3-0.2 U0.25 01 1.5 2 2.5 a 35 0.2 -_- Model 1 R. 4, -- O- Model2 00,15,-OMdI '. 0 --O--Model3 0 . -- --Model 4 0.1 C-0-.Our Model 0.05 0 --1 1.1 1.2 1.3 1.4 1.5 R0=P/P
Figure 2-2: Monte Carlo study of the global attack of an epidemic as a
function of the reproductive number R0, for the different models explained
in the text. We used a value of the recovery rate p-1 = 4 days. We initialized the
epidemic with 10 infected individuals chosen randomly across the network. We used a population of 5 x 10⁵ individuals, and average our results over 200 realizations. (Inset) The global attack for larger values of Ro exhibits smaller differences among models, except for those between annealed and quenched transition rates at the nodes, as evidenced by the simulation results of Model 1 vs. the other models.
nontrivial dependence of contagion dynamics on human mobility.
2.4
Influential spreaders
Finding measures of power and centrality of individuals has been a primary interest of network science (Freeman, 1979; Bonacich, 1987). The very mechanism of preferential attachment shapes the growth and topology of real-world networks (Barabisi and Albert, 1999), indicating that the degree of a node is a natural measure of its influence on the network dynamics. Another traditional measure of a node's influence is the betweenness centrality, defined as the number of shortest paths that cross through this node (Freeman, 1979). Betweenness centrality does not always correlate strongly with the degree, the air transportation network being precisely an example of poor correlation between the two (Guimera. et al., 2005). It has been shown, however, that certain dynamic processes such as SIS or SIR epidemic spreading in complex networks
appear to be controlled by a subset of nodes that do not necessarily have the highest degree or the largest betweenness (Kitsak et al., 2010).
Here we revisit what is meant by spreading, and make a crucial distinction between the asymptotic late-time behavior-which has been studied more extensively-and the early-time dynamics, for which much less is known. We show that the two behav-iors are controlled by different mechanisms and, as a result, require different measures of spreading.
2.4.1
Influential spreaders at late times
We perform numerical simulations of epidemic spreading in our model by initializing the SIR compartmental model with infectious individuals at one single subpopulation. We compare the asymptotic, late-time spreading ability of different subpopulations
by means of the global attack of the SIR epidemic (Fig. 2-3a). We study low values
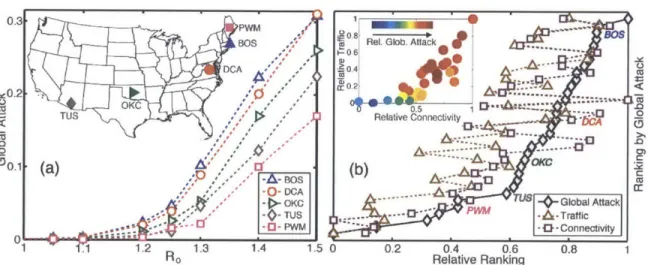
of the reproductive number RO, between 1 and 1.5, because the relative differences among different sources of infection are largest in this limit. Recent outbreaks of influenza A are estimated to lie within this range (Fraser et al., 2009). We rank the 40 major airports in the United States in terms of their asymptotic global attack, after aggregating the ranking over the range of reproductive numbers studied (Fig. 3b). The ability of a node to spread an epidemic depends on fast dispersal of agents to many other nodes, thereby increasing the probability of infectious individuals contacting a large population before they recover. Thus, intuitively, the asymptotic spreading ability of a node increases with its traffic and connectivity. In fact, we find that both degree and traffic provide fair rankings of influential late-time spreaders because in the air transportation network both quantities are strongly correlated (Fig. 2-3b, inset).
2.4.2
Influential spreaders at early times
Late-time measures of spreading, such as the asymptotic global attack, cannot capture the details of early-time contagion dynamics. The vigor of initial spreading, however, is likely the crucial aspect in the assessment and implementation of remedial action
0.3 1
BO 0,8,- Rel. Glob. Attack BOS
- 0 0
BOc O 5 -1 L A- ...
DCA 0.4 - -O
OKC 0) 5
TUS Relative Connectivity
-(a) *
[-i-
-K0-4Global Attack . --. -. -Traffic0 .-- Connectivity
1.2 13 1.4 150 02 0.4 0.6 0.8
Ro Relative Ranking
Figure 2-3: Late-time spreading ability of different airports, measured by
the global attack of an SIR epidemic that originates at each airport.
(a) Global attack as a function of reproductive number, for five different airports
(see inset). We initialize the disease by infecting 10 randomly chosen individuals
inside the subpopulation of consideration. We use p-I= 4 days. Each point is the result of a Monte Carlo study averaging over 200 reaction and 20 mobility realiza-tions and using 5 x i0a individuals. (b) Ranking of the 40 major airports in US in terms of their spreading ability measured by the normalized global attack. We com-pare the normalized global-attack ranking curve
(black
diamonds) to the ones that result from considering the airport's normalized degree(magenta squares) and the
air-port's normalized traffic (brown triangles). Also shown is the ranking of the airports shown in (a). Both degree and traffic provide effective rankings of influential late-time spreaders, which in this case can be understood from the good cross-correlation between the two (inset).for highly contagious diseases (Bajardi et al., 2011), when the reaction and transport timescales are comparable.
The natural measure of physical spreading is the total square displacement (TSD) of the infected agents,
N 1
TSD = (xJ - (x))2 (2.7)
j=1
where N, is the total number of infected individuals at time t, xj is the position of the infected individual
j,
and (x) denotes the position of the center of mass of infected individuals. The TSD increases with time as the infected agents, initially all in the same node, spread through the air transportation network by traffic and contact individuals at the connecting and destination nodes.We compare the TSD for 40 major airports in the US, 10 days after the infection starts at each of those airports, and a reproductive number Ro = 1.5. The random walk described by the infected agents is asynchronous (heterogeneous travel times and waiting times), traffic-driven (quenched disorder in the network fluxes), non-Markovian (recurrent individual mobility patterns) and non-conservative (appearance and disappearance of infected agents due to infection and recovery). This complexity requires that the transport and contagion processes be time-resolved, an essential feature of our model.
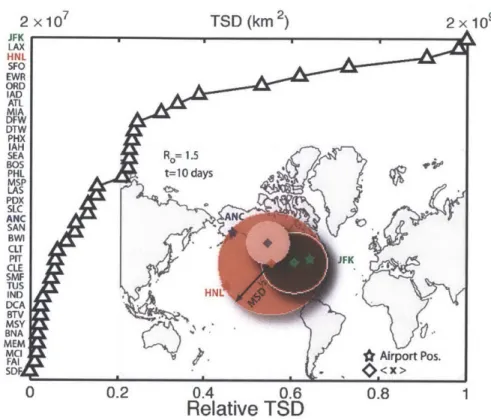
We rank all 40 airports according to their TSD at early times. The curve of ordinal ranking vs. normalized TSD is markedly concave, indicating that only a handful of airports are very good spreaders (Fig. 2-4). The list of early-time super-spreaders is led by J. F. Kennedy (JFK) , Los Angeles International (LAX), Honolulu (HNL), San Francisco (SFO) , Newark Liberty (EWR), Chicago O'Hare (ORD) and Washington Dulles (IAD).
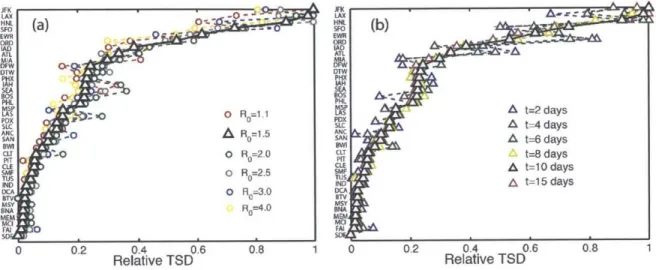
We perform a sensitivity analysis with respect to the reproductive number, R0, and the number of days after which the TSD is measured (Fig. 2-5). Clearly, a higher reproductive number leads to a more aggressive spread of the disease, and therefore larger values of the total square displacement at the same time. From its definition, it is also clear that the TSD increases with time, at least until saturation.