HAL Id: hal-00296827
https://hal.archives-ouvertes.fr/hal-00296827
Submitted on 16 Dec 2005
HAL is a multi-disciplinary open access
archive for the deposit and dissemination of
sci-entific research documents, whether they are
pub-lished or not. The documents may come from
teaching and research institutions in France or
abroad, or from public or private research centers.
L’archive ouverte pluridisciplinaire HAL, est
destinée au dépôt et à la diffusion de documents
scientifiques de niveau recherche, publiés ou non,
émanant des établissements d’enseignement et de
recherche français ou étrangers, des laboratoires
publics ou privés.
Airborne laser scanning and usefulness for hydrological
models
M. Hollaus, W. Wagner, K. Kraus
To cite this version:
M. Hollaus, W. Wagner, K. Kraus. Airborne laser scanning and usefulness for hydrological models.
Advances in Geosciences, European Geosciences Union, 2005, 5, pp.57-63. �hal-00296827�
SRef-ID: 1680-7359/adgeo/2005-5-57 European Geosciences Union
© 2005 Author(s). This work is licensed under a Creative Commons License.
Advances in
Geosciences
Airborne laser scanning and usefulness for hydrological models
M. Hollaus1, W. Wagner1, and K. Kraus2
1Christian Doppler Laboratory for “Spatial Data from Laser Scanning and Remote Sensing”, Vienna Univ. of Technology,
Gusshausstr. 27–29, 1040 Vienna, Austria
2Institute of Photogrammetry and Remote Sensing, Vienna Univ. of Technology, Gusshausstr. 27–29, 1040 Vienna, Austria
Received: 7 January 2005 – Revised: 1 August 2005 – Accepted: 1 September 2005 – Published: 16 December 2005
Abstract. Digital terrain models form the basis for dis-tributed hydrologic models as well as for two-dimensional hydraulic river flood models. The technique used for gener-ating high accuracy digital terrain models has shifted from stereoscopic aerial-photography to airborne laser scanning during the last years. Since the disastrous floods 2002 in Austria, large airborne laser-scanning flight campaigns have been carried out for several river basins. Additionally to the topographic information, laser scanner data offer also the possibility to estimate object heights (vegetation, buildings). Detailed land cover maps can be derived in conjunction with the complementary information provided by high-resolution colour-infrared orthophotos. As already shown in several studies, the potential of airborne laser scanning to provide data for hydrologic/hydraulic applications is high. These studies were mostly constraint to small test sites. To over-come this spatial limitation, the current paper summarises the experiences to process airborne laser scanner data for large mountainous regions, thereby demonstrating the applicabil-ity of this technique in real-world hydrological applications.
1 Introduction
Currently, modelling tools for simulating spatially dis-tributed hydrological processes are in use that allow more detailed analysis in decision-making than lumped models. The quality of simulation and spatial process representation is crucially dependent on the input data that describe the variability of the natural conditions in an appropriate form. Therefore, a great demand for such information exists to min-imise the uncertainties of the simulation results. A similar trend can be observed in the hydraulic modelling of flood-plain flows. As reported in Marks and Bates (2000) two-dimensional (2-D) hydraulic surface flow models are mostly constrained by inadequate parameterisation of topography Correspondence to: M. Hollaus
and roughness coefficients, primarily due to insufficient or inaccurate data.
For all above-mentioned model types digital terrain mod-els (DTMs) and their derived parameters such as slope, aspect, and drainage network form the basic model-input. Therefore, the accuracy of the DTM has a crucial influence on the model output. Advances in remote sensing techniques made it possible to generate high resolution DTMs for whole watersheds at reasonable costs. In the past, DTMs have been generated from stereoscopic analysis of aerial photographs or satellite imagery. In the last few years the technology of airborne laser scanning (ALS) has emerged, which al-lows to produce high-quality DTMs with accuracies less than
±25 cm, depending on the land cover, slope, flight param-eters and environmental conditions. Several authors have summarised possible uses of products derived from ALS data for hydraulic applications. Charlton et al. (2003) have anal-ysed the potential of ALS for mapping gravel-bed river en-vironments for gathering high-resolution topographic data. Kraus (2003a) has studied the use of laser scanner DTMs for modelling flood risk areas. Pereira and Wicherson (1999) have summarised that laser scanning is a suitable technique to collect relief information for river management.
Airborne laser scanners also provide data for describing the landscape roughness of the earth’s surface. As described by Schmugge et al. (2002) landscape roughness affects the transport of hydro-meteorological fluxes between the land surface and atmosphere as well as below the surface. There-fore, precise topographic information can be used to under-stand and calculate the effects of landscape roughness on evaporation, soil moisture, runoff, and soil erosion at field and landscape scale. Govers et al. (2000) have summarised that soil roughness does not only affect the runoff amount due to depression storage, but also affects the volume and rate of infiltration.
In the case of 2-D hydraulic flood models information describing the roughness of streams are needed. Cobby et al. (2001) have described an approach for estimat-ing low vegetation heights usestimat-ing a logarithmic regression
58 M. Hollaus et al.: Airborne laser scanning and usefulness for hydrological models relationship that predicts the vegetation height from the
stan-dard deviations of detrended ALS heights in a small sur-rounding area. Mason et al. (2003) have reviewed ap-proaches in literature how vegetation height data measured by ALS can be transformed to roughness coefficients. Fi-nally, Cobby et al. (2003) have analysed the different fric-tional properties of floodplain vegetation features such as hedges and trees.
These studies have shown that the potential of ALS to estimate vegetation properties and roughness coefficients of streams is high, but still, several deficits in the physical in-terpretation and processing of ALS data remain. For exam-ple, Mason et al. (2003) have mentioned that the estimation of vegetation heights may cause problems, especially in ar-eas of overlap between adjacent ALS swaths. Nevertheless, substantial progress has been made with georeferencing of ALS data, particularly with the minimisation of discrepan-cies between overlapping laser scanner strips. These discrep-ancies – in height as well as in planimetry – are unsatisfac-tory phenomena for end-users of the ground data. There-fore, Kager (2004) has developed an adjustment strategy for correcting the exterior orientation elements as recorded by differential-GPS (dGPS) and Inertial Measurement Unit (IMU), as well as interior orientation elements concerning the Scanner-dGPS-IMU system. The method applies correc-tion polynomials in the time domain to all degrees of freedom as determined by the dGPS-IMU components and to the rel-ative orientation parameters between those scanner-system components. All these parameters are determined simulta-neously with hybrid block adjustment by least squares. The result of this pre-processing step is a high quality georefer-enced 3-D point cloud, which has to be filtered into terrain and non-terrain points. A good overview of existing filter-ing strategies is given in Sithole and Vosselman (2003). In this study we use a hierarchic robust filtering technique de-scribed in Kraus and Pfeifer (1998) and Briese et al. (2002). In order to improve the quality of ALS derived DTMs, Briese (2004) has investigated an algorithm for modelling three-dimensional breaklines from ALS data.
Therefore, the algorithms for processing large ALS data are available and provide together with colour-infrared (CIR) orthophotos a valuable data source for the parameterisation of hydraulic/hydrologic models. The complementary infor-mation content of ALS data and CIR orthophotos, as de-scribed in Sect. 2, is well suited for object-oriented land cover classifications (Sect. 3). In Sect. 4 we discuss expe-riences, limitations, and future research needs with respect to use ALS data over large regions. Furthermore, we show the potential of ALS data and CIR orthophotos for provid-ing hydrologic/hydraulic relevant input data and show an ex-emplary result of an object-oriented land cover classification including different roughness classes, followed by the con-clusion in Sect. 6. It is our hope that this paper raises the interest of hydrologists to use the full information content of this emerging remote sensing technique.
2 Information content of laser scanner data and or-thophotos
Airborne laser scanning and photogrammetry are remote sensing methods that are in use for several environmental ap-plications. The following short overview of the two tech-niques is based on Baltsavias (1999), Kraus (2003b), and Maas and Vosselman (2004). Additionally, the different in-formation content for deriving hydrologic/hydraulic relevant land cover information is outlined in detail below.
Airborne laser scanning, often referred to as LIDAR or laser altimetry, is an active remote sensing technique, which was originally designed to measure the topography of the Earth’s surface. A laser emits short infrared pulses towards the Earth’s surface and a photodiode measures the backscat-tered echoes. The count of echoes is depending on the ob-jects within the travel path of the laser pulse. Therefore, state-of-the-art laser scanner systems measure the round-trip time of multiple echoes from one laser pulse, e.g. first-and last-pulse, or up to five pulses. Laser scanner sys-tems recording the full waveform of the backscattered sig-nal have become commercially available recently (Wagner et al., 2004a). Some laser scanner systems measure not only the range but also the intensity information. Unfortunately, an unfavourable signal-to-noise ratio and insufficient calibra-tion restricted the use of the intensity data in the past.
Airborne laser scanning systems are characterised by pointwise sampling mechanisms, whereas photogrammetry delivers full area coverages. As a passive system, photogram-metry is strongly depending on weather conditions. The fundamental advantages of photogrammetry are the spec-tral/textural information content of the images, the large area coverages, the high spatial resolution, the very high posi-tion accuracy, and the possibility of direct identificaposi-tions and measurements of objects. Furthermore, the gathered imagery can be used for generation of orthoimages, DTMs, and dig-ital surface models (DSMs). On of the disadvantages is the poor visibility into forested areas. Additional drawbacks are the fact that for stereoscopic analysis (DTM and DSM gen-eration) the point on the surface must be visible from two different locations, and the very time-consuming interpreta-tion work.
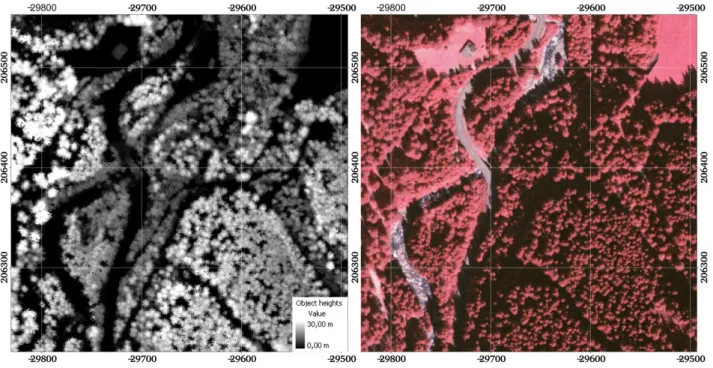
In contrast to photogrammetric systems, ALS ones are characterised by a simple measurement geometry meaning that the 3-D-position of a point on the surface is measured from one location. This allows the generation of precise DTMs also for urban areas with narrow alleys and wooded areas, where the penetration rate through the tree canopy mainly depends on the density of trees and the season. How-ever, the high point density achievable with ALS systems permits the generation of high accuracy DTMs and DSMs. In forested areas the difference between the DSM and the DTM represents the vegetation height (Fig. 1, left), which enables the derivation of other important parameters like biomass. Furthermore, the mapping of surfaces with very little/no tex-ture is possible with ALS. Finally, a high degree of automa-tisation for analysing the ALS data can be achieved.
M. Hollaus et al.: Airborne laser scanning and usefulness for hydrological models 59
5
As the primarily result of laser scanning is a 3D-point cloud, additionally information for the
classification and identification of objects is necessary. Therefore, several authors (Ackermann 1999,
Baltsavias 1999, Kraus 2003b) have proposed the use of the synergetic information content of
photogrammetrically derived imagery and ALS data. Especially the height information of ALS data
(Fig. 1) leads to enormous improvements of land cover classifications in shaded areas. Furthermore,
this information can be used for the determination of roughness coefficients.
In order to obtain the largest benefit of combined analysis, the data should be gathered simultaneously
or within short time intervals. Due to cost and the fact that many datasets are already available from
several projects, the data processing algorithms have to consider the different qualities and properties
of the available data.
Figure 1: Comparison of ALS data and CIR orthophotos; (left) the object heights are calculated from
ALS data, spatial resolution 1.0 m; (right) CIR orthophoto with a spatial resolution of 0.25 m;
coordinates are in Gauß-Krüger (reference meridian M28).
3 Object-oriented land cover classification
Deriving land cover information from remotely sensed data is one of the most important tasks in earth
observation. Since the first Landsat satellite, launched in 1972, remote sensing has made enormous
progress in terms of data availability, and improved spatial and temporal resolution. In the field of
ALS substantial progresses has been made during the last decade. Cobby et al. (2003) have reported
the usefulness of ALS data for 2D river flood models providing spatially distributed floodplain
topography for model bathymetry and vegetation heights for the determination of roughness
coefficients. Normally the roughness is described by Manning’s roughness coefficients that can be
Fig. 1. Comparison of ALS data and CIR orthophotos; (left) the object heights are calculated from ALS data, spatial resolution 1.0 m; (right)
CIR orthophoto with a spatial resolution of 0.25 m; coordinates are in Gauß-Kr¨uger (reference meridian M28).
As the primarily result of laser scanning is a 3-D-point cloud, additionally information for the classification and identification of objects is necessary. Therefore, several au-thors (Ackermann, 1999; Baltsavias, 1999; Kraus, 2003b) have proposed the use of the synergetic information content of photogrammetrically derived imagery and ALS data. Es-pecially the height information of ALS data (Fig. 1) leads to enormous improvements of land cover classifications in shaded areas. Furthermore, this information can be used for the determination of roughness coefficients.
In order to obtain the largest benefit of combined analysis, the data should be gathered simultaneously or within short time intervals. Due to cost and the fact that many datasets are already available from several projects, the data process-ing algorithms have to consider the different qualities and properties of the available data.
3 Object-oriented land cover classification
Deriving land cover information from remotely sensed data is one of the most important tasks in earth observation. Since the first Landsat satellite, launched in 1972, remote sensing has made enormous progress in terms of data availability, and improved spatial and temporal resolution. In the field of ALS substantial progresses has been made during the last decade. Cobby et al. (2003) have reported the usefulness of ALS data for 2-D river flood models providing spatially distributed floodplain topography for model bathymetry and vegetation heights for the determination of roughness coef-ficients. Normally the roughness is described by Manning’s roughness coefficients that can be expressed as a function
of land cover (Van der Sande et al., 2003; De Roo et al., 2001). Unfortunately, detailed, actual, and hydraulic rele-vant land cover information is normally not available. Since DTMs are generated from ALS data more frequently, there is now the possibility to use this data source together with orthophotos for land cover classifications. However, for ex-ploring the full information content of these data traditionally pixel-based classification algorithms are not suitable. There-fore, object-oriented approaches have been proposed from several authors during the last years (Blaschke and Strobl, 2001; Darwish et al., 2003; Benz et al., 2004). The prac-tical realisation of the object-oriented approach postulates the existence of objects. In this context an object is char-acterised by an amount of spatial connected pixels that rep-resents a meaningful, homogeneous landscape patch. The process for building these objects is normally called segmen-tation and was the research area of many groups in the past. Unfortunately, most of the algorithms were developed for re-search experiments only. The commercial available software package eCognition (eCognition, 2005) has realised a multi-resolution segmentation approach together with an object-based fuzzy logic classification algorithm. Detailed descrip-tions of the multi-resolution segmentation approach can be found in Baatz and Sch¨ape (2000).
In the current study an object-based land cover classifica-tion is performed using the software eCogniclassifica-tion, whereas the selection of the land cover classes was driven by hydraulic relevant roughness coefficients. As data sources ALS data and CIR orthophotos are available, which are described in detail in the following Section.
60 M. Hollaus et al.: Airborne laser scanning and usefulness for hydrological models
8
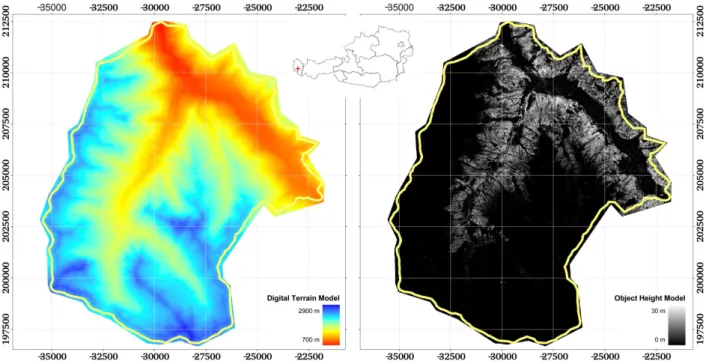
Figure 2: Location of the study area; (left) digital terrain model calculated from 76 laser scanner strips;
(right) object height model derived from ALS data, the greyscale corresponds to the object heights;
spatial resolution of the data 1 m, coordinates are in Gauß-Krüger (reference meridian M28).
The spatial resolution of the calculated DTM is 1 m. The quality of the DTM is depending on the ALS
point density, the slope, and the land cover and is in the range of few centimetres for high point
densities and low slopes and increase to few decimetres for steep slopes with low point density. More
detailed information about ALS-DTM qualities can be found in Kraus et al. (2004). Additionally to the
object height model, the forest ground cover, calculated from the object height model, and the
normalised difference vegetation index (NDVI), calculated from the CIR orthophotos, are used for the
land cover classification, as shown in Fig. 3 (right). The classification has been carried out with the
software eCognitioin (eCognition 2005), where the knowledge-based classification rules are mainly
driven by the complementary information content of the two data sources described in Sect. 2. For the
current study area the land cover classes buildings, sealed surfaces (roads, parking places), bare soils,
gravel / riprap, pastures / meadows (short-, high-grass), scrubs (sparse, dense), forests (sparse, dense),
and young forests (sparse, dense) are used. The differentiation of the land cover classes meadows with
high-grass and dense scrubs is not possible in areas, which are covered by shadows in the CIR
orthophotos, due to the missing spectral information and the inaccuracies in the object height model.
Nevertheless, the quality of the land cover classification is high, as can be seen in Fig. 3 (right).
Unfortunately, the spectral information of the black areas in the CIR orthophoto (Fig. 3, left),
representing shaded areas (e.g. around buildings), cannot be used for the land cover classification.
With the help of ALS heights (Fig. 3, middle), high thematic accuracies can be reached also for these
Fig. 2. Location of the study area; (left) digital terrain model calculated from 76 laser scanner strips; (right) object height model derived
from ALS data, the greyscale corresponds to the object heights; spatial resolution of the data 1 m, coordinates are in Gauß-Kr¨uger (reference meridian M28).
4 Experiences from a larger-scale catchment
The applicability of novel earth observation technologies is put to a test by applying them over large-scale catchments. To demonstrate what is already feasible now in an opera-tional fashion for hydrologic applications we discuss the re-sults for a 128 km2large catchment in difficult topographic condition. This is not only done to highlight what can be done now, but also show required technological improve-ments and research needs.
So far, studies on the potential of ALS for providing in-put data for hydrologic/hydraulic applications has been con-firmed to small test sides. Kondoh and Higuchi (2001), Wealands et al. (2004), Schmugge et al. (2002), De Roo et al. (2001), and others have outlined the usefulness of remotely sensed data for distributed hydrological models. Those studies suggest ALS data in combination with high spatial resolution multi-spectral imagery for estimating aero-dynamic landscape roughness, vegetation cover, and leaf area indices. Furthermore, ALS could be used for the deter-mination of roughness coefficients for river flood models in two ways: The roughness coefficients can either be derived from the vegetation heights, type, and density as reported by Cobby et al. (2003), and Mason et al. (2003) or be con-nected to hydraulic relevant land cover classes (Br¨ugelmann and Bollweg, 2004). However, it is not clear how close these suggested applications are to becoming operational.
As a real world example we analyse ALS data from a test region in Vorarlberg/Austria, which were acquired in the
framework of a commercial mapping project. The study re-gion, located in the southern part of the federal state of Vo-rarlberg, covers the “Montafon” district as shown in Fig. 2. Several small mountain streams run through the study area whereas the two main streams are the Suggadinbach (south to north) and the Ill (south-east to north-west). The com-plex mountainous landscape of the study area shows many different facets and is characterised by hilly to alpine terrain, with altitudes rising from 800 m to 2900 m. The land cover is characterised by coniferous and mixed forests, shrubs, mead-ows, and sparsely settled areas in the valley floors.
The ALS data were gathered by two flight-campaigns per-formed by the company TopScan, Germany. The first flight, consisting of 24 laser scanner strips covering the valley, took place on 10 December 2002. The second flight was per-formed on 19 July 2003, and consists of 52 laser scanner strips covering the mountainous regions of the study area. During the winter flight the pulse repetition rate was 25 kHz, for the summer flight it was 50 kHz. Consequently, the aver-age point density on ground was higher for the summer cam-paign (2.7 points per m2)than for the winter campaign (0.9 points per m2). The total amount of laser scanner points for the two flight-campaigns is 650 millions including first- and last-pulses.
The laser-scanning DTM (Fig. 2) and DSM have been gen-erated using the simultaneously hybrid block adjustment for the georeferencing of the laser scanner strips (Kager, 2004) and the hierarchic robust filtering technique for classifying the ALS points into terrain and non-terrain points. The used
M. Hollaus et al.: Airborne laser scanning and usefulness for hydrological models 61
9
areas. With minor manual post-processing of the land cover map, which is the common practice in
commercial projects, a kappa coefficient higher than 0.95 can be reached, which is a reasonable good
result. Even considering the cost implications, this high thematic accuracy is only achievable with
these datasets.
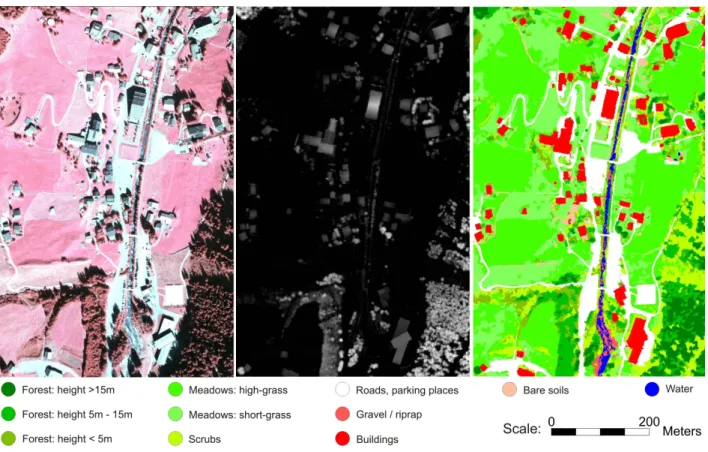
Figure 3: Land cover map with hydrologic / hydraulic relevant classes; shown is a subset of the study
area; (left) CIR orthophotos; (middle) object height model derived from ALS data; (right) land cover
map with a spatial resolution of 0.25 m, derived from ALS data and CIR orthophotos.
The derived land cover classes shown in Fig. 3 (right) can be used for the determination of roughness
coefficients of hydraulic river flood models. The empirical roughness coefficients for each land cover
class can be found in the literature. A more physically based approach is the calculation of the
roughness coefficient from the ALS data directly, which requires the correct measurement of
vegetation heights also for short vegetation types such as grasses or scrubs. As the laser pulse duration
of current ALS systems is in the order of 10 ns it is only possible to distinguish vegetation classes,
which are taller than 1.5 meters (Wagner et al. 2003). Furthermore, it is not always clear which
vegetation height is represented by the measured laser pulse due to different penetration depths
(Wagner et al. 2004b). These facts make it impossible to measure short vegetation heights directly
with current systems. The rapid development of ALS technology is expected to improve the situation
in near future.
Fig. 3. Land cover map with hydrologic/hydraulic relevant classes; shown is a subset of the study area; (left) CIR orthophotos; (middle)
object height model derived from ALS data; (right) land cover map with a spatial resolution of 0.25 m, derived from ALS data and CIR orthophotos.
algorithms are implemented into the commercial software-package Scop++ (Scop++ 2005). Detailed information for deriving DSMs and DTMs can be found in Pfeifer (2003) and Briese et al. (2002).
Additionally CIR digital orthophotos with a ground reso-lution of 0.25 m were available. Both orthophotos and ALS data were provided by the provincial government Vorarlberg. The relatively high penetration rate of ALS into forests particularly during the winter season enables the derivation of precise DTMs also in wooded areas (Kraus and Pfeifer, 1998). Relatively large errors in the order of several me-ters may occur in rare instances, when dense evergreen for-est covers large patches of steep inclinations. Furthermore, the DTM shows inaccuracies near surface breaklines, which leads to incorrect object heights. In order to improve the quality of ALS derived DTMs, Briese (2004) has investi-gated an algorithm for modelling three-dimensional break-lines from ALS data that will be used for future DTM gen-erations. Apart from these situations the object height model can be calculated by subtracting the DTM from the DSM, and represents the vegetation (forest) heights (Fig. 2, right).
The spatial resolution of the calculated DTM is 1 m. The quality of the DTM is depending on the ALS point density, the slope, and the land cover and is in the range of few cen-timetres for high point densities and low slopes and increase
to few decimetres for steep slopes with low point density. More detailed information about ALS-DTM qualities can be found in Kraus et al. (2004). Additionally to the object height model, the forest ground cover, calculated from the object height model, and the normalised difference vegetation in-dex (NDVI), calculated from the CIR orthophotos, are used for the land cover classification, as shown in Fig. 3 (right). The classification has been carried out with the software eCognitioin (eCognition, 2005), where the knowledge-based classification rules are mainly driven by the complementary information content of the two data sources described in Sect. 2. For the current study area the land cover classes buildings, sealed surfaces (roads, parking places), bare soils, gravel/riprap, pastures/meadows (short-, high-grass), scrubs (sparse, dense), forests (sparse, dense), and young forests (sparse, dense) are used. The differentiation of the land cover classes meadows with high-grass and dense scrubs is not pos-sible in areas, which are covered by shadows in the CIR or-thophotos, due to the missing spectral information and the inaccuracies in the object height model. Nevertheless, the quality of the land cover classification is high, as can be seen in Fig. 3 (right). Unfortunately, the spectral information of the black areas in the CIR orthophoto (Fig. 3, left), represent-ing shaded areas (e.g. around buildrepresent-ings), cannot be used for the land cover classification. With the help of ALS heights
62 M. Hollaus et al.: Airborne laser scanning and usefulness for hydrological models (Fig. 3, middle), high thematic accuracies can be reached
also for these areas. With minor manual post-processing of the land cover map, which is the common practice in com-mercial projects, a kappa coefficient higher than 0.95 can be reached, which is a reasonable good result. Even consider-ing the cost implications, this high thematic accuracy is only achievable with these datasets.
The derived land cover classes shown in Fig. 3 (right) can be used for the determination of roughness coefficients of hy-draulic river flood models. The empirical roughness coeffi-cients for each land cover class can be found in the literature. A more physically based approach is the calculation of the roughness coefficient from the ALS data directly, which re-quires the correct measurement of vegetation heights also for short vegetation types such as grasses or scrubs. As the laser pulse duration of current ALS systems is in the order of 10 ns it is only possible to distinguish vegetation classes, which are taller than 1.5 m (Wagner et al., 2003). Furthermore, it is not always clear which vegetation height is represented by the measured laser pulse due to different penetration depths (Wagner et al., 2004b). These facts make it impossible to measure short vegetation heights directly with current sys-tems. The rapid development of ALS technology is expected to improve the situation in near future.
5 Conclusions
Since the disastrous floods in Austria in the year 2002, large ALS campaigns have been carried out along several river courses (e.g. the rivers “Kamp”, “Drau”, “Alm”, and parts of the “Danube”). Furthermore, the Austrian federal state of Vorarlberg is mapping and Tirol is planing to map the whole areas of their provinces with ALS within the next years. Sev-eral other fedSev-eral states of Austria have similar intentions. Therefore, ALS data will become available for many com-plete catchment areas in the near future. The same trend can be observed in many other countries. Additionally, country-wide orthophotos are often available and will be updated in an interval of 5–10 years. This high spatial resolution data source is in use for updating topographic maps, for agricul-tural purposes, and for several other environmental applica-tions. Until now ALS flight campaigns are expensive. In consideration of the fact that the level of automation for the data processing is very high and that the data can be used for multiple purposes ALS data provide an attractive infor-mation source. For small study areas, the potential of ALS data to derive hydrologic/hydraulic relevant information has already been shown in several studies. In this paper we have discussed the experiences of processing ALS data, which were acquired in the framework of a commercial mapping project, for a large mountainous region. We could show that the simultaneously hybrid block adjustment for georeferenc-ing of the laser scanner strips and the hierarchic robust filter-ing technique are adequate methods to derive DTMs, DSMs, and digital object height models. However, some inaccura-cies of the vegetation height model arose in areas covered
by homogeneous meadows with high-grass or scrubs due to the technical limitations of the current laser scanner systems. New ALS systems, which provide calibrated intensities of the laser echoes or which record the full echo-waveform, may provide crucial information to overcome these problems (Wagner et al., 2004b) and a more physically approach for deriving e.g., roughness coefficients can be applied.
Finally, this study has shown that the complementary in-formation content of ALS data and CIR orthophotos is an excellent data source for object-oriented land cover classifi-cations needed for hydrologic/hydraulic appliclassifi-cations. These data can be used to support the preparation of the neces-sary information needed for integrated river basins to com-ply with the EU Water Framework Directive. The high qual-ity of topographic and thematic input information for hydro-logic/hydraulic models leads to a reduction of uncertainties of the model outputs.
Acknowledgements. We would like to thank the
Landesvermes-sungsamt Feldkirch for granting the use of the ALS data and the CIR orthophotos for the purpose of this study. Furthermore, we would like to thank C. Eberh¨ofer and H. Kager from the Institute of Photogrammetry and Remote Sensing, Vienna University of Technology, for the processing of the laser scanner data.
Edited by: P. Krause, K. Bongartz, and W.-A. Fl¨ugel Reviewed by: anonymous referees
References
Ackermann, F.: Airborne laser scanning - present status and fu-ture expectations, ISPRS Journal of Photogrammetry and Re-mote Sensing, 54, 64–67, 1999.
Baatz, M. and Sch¨ape, A.: Multiresolution Segmentation: An opti-mization approach for high quality multi-scale image segmenta-tion. Angewandte Geographische Informationsverarbeitung XII, Beitr¨age zum AGIT-Symposium Salzburg 2000, Salzburg, Karl-sruhe, Herbert Wichmann Verlag, 2000.
Baltsavias, E. P.: A comparison between photogrammetry and laser scanning, ISPRS Journal of Photogrammetry and Remote Sens-ing, 54, 83–94, 1999.
Benz, U. C., Hofmann, P., Willhauck, G., Lingenfelder, I., and Hey-nen, M.: Multi-resolution, object-oriented fuzzy analysis of re-mote sensing data for GIS-ready information, ISPRS Journal of Photogrammetry and Remote Sensing, 58, 239–258, 2004. Blaschke, T. and Strobl, J.: What’s wrong with pixels? Some
re-cent developments interfacing remote sensing and GIS, GIS – Zeitschrift f¨ur Geoinformationssysteme, 6, 12–17, 2001. Briese, C., Pfeifer, N., and Dorninger, P.: Applications of the
Robust Interpolation for DTM determination, in: International Archives of Photogrammetry and Remote Sensing, Photogram-metric Computer Vision (PCV’02), 9–13 September 2002, Graz, Austria, urlhttp://www.isprs.org/publications/archives.html, 2002.
Briese, C.: Three-dimensional Modelling of Breaklines from Airborne Laser Scanner Data, presentation in: International Archives of Photogrammetry and Remote Sensing, XXth ISPRS Congress, Istanbul, Turkey, 12–23 July 2004, CD-ROM, 2004. Br¨ugelmann, R. and Bollweg, A. E.: Laser Altimetry for River
Remote Sensing, XXth ISPRS Congress, Istanbul, Turkey, 12–23 July 2004, CD-ROM, 2004.
Charlton, M. E., Large, A. R. G., and Fuller, I. C.: Application of airborne LIDAR in river environments: the river COQUET, Northumberland, UK, Earth Surf. Process. Landforms, 28, 299– 306, 2003.
Cobby, D. M., Mason, D. C., and Davenport, I. J.: Image process-ing of airborne scannprocess-ing laser altimetry data for improved river flood modelling, ISPRS Journal of Photogrammetry and Remote Sensing, 67, 121–138, 2001.
Cobby, D. M., Mason, D. C., Horritt, M. S., and Bates, P. D.: Two-dimensional hydraulic flood modelling using a finite-element mesh decomposed according to vegetation and topographic fea-tures derived from airborne scanning laser altimetry, Hydrol. Pro-cess., 17, 1979–2000, 2003.
Darwish, A., Leukert, K., and Reinhardt, W.: Urban Land-Cover Classification: An Object Based Perspective, in: Proceedings 2nd GRSS/ISPRS Joint Workshop on Data Fusion and Remote sensing over Urban Areas, Berlin, Germany, 22–23 May 2003, CD-Rom, 278–282, 2003.
De Roo, A., Idijk, M., Schmuck, G., Koster, E., and Lucieer, A.: As-sessing the Effects of Land Use Changes on Floods in the Meuse and Oder Catchment, Phys. Chem. Earth (B), 26, 7–8, 593–599, 2001.
eCognition: January: http://www.definiens-imaging.com/, 2005. Govers, G., Takken, I., and Helming, K.: Soil roughness and
over-land flow, Agronomie, 20, 131–146, 2000.
Kager, H.: Discrepancies between overlapping laser scanner strips – simultaneous fitting of aerial laser scanner strips, in: Interna-tional Archives of Photogrammetry and Remote Sensing, XXth ISPRS Congress, Istanbul, Turkey, 12–23 July 2004, CD-ROM, 2004.
Kondoh, A. and Higuchi, A.: Relationship between satellite-derived spectral brightness and evapotranspiration from a grassland, Hy-drol. Process., 15, 1761–1770, 2001.
Kraus, K. and Pfeifer, N.: Determination of terrain models in wooded areas with airborne laser scanner data, ISPRS, Journal of Photogrammetry and Remote Sensing, 53, 193–203, 1998. Kraus, K.: LaserScanDTMs for Modeling Flood Risk Areas, GIS
(Geo-Informations-Systeme) (invited), 12, 26–31, 2003a. Kraus, K.: Laser-Scanning – ein Paradigmawechsel in der
Pho-togrammetrie, Bulletin SEV/VSE (invited), 9, 19–22, 2003b. Kraus, K., Briese, C., Attwenger, M., and Pfeifer, N.: Quality
Mea-sures for Digital Terrain Models, in: International Archives of Photogrammetry and Remote Sensing, XXth ISPRS Congress, Istanbul, Turkey, 12–23 July 2004, CD-ROM, 2004.
Maas, H. G. and Vosselman, G.: Flugzeug-Laserscanning. Pho-togrammetrie, Fernerkundung, Geoinformation (PFG), Heft 4, 257–258, 2004.
Marks, K. and Bates, P.: Integration of high-resolution topographic data with floodplain flow models, Hydrol. Process., 14, 2109– 2122, 2000.
Mason, D. C., Cobby, D. M., Horritt, M. S., and Bates, P. D.: Flood-plain friction parameterisation in two-dimensional river flood models using vegetation heights derived from airborne scanning laser altimetry, Hydrol. Process., 17, 1711–1732, 2003. Pereira, L. M. G. and Wicherson, R. J.: Suitability of laser data for
deriving geographical information: A case study in the context of management of fluvial zones, ISPRS Journal of Photogrammetry and Remote Sensing, 54, 105–114, 1999.
Pfeifer, N.: Oberfl¨achenmodelle aus Laserdaten, ¨Osterreichische Zeitschrift f¨ur Vermessung and Geoinformation, 4, 243–252, 2003.
Schmugge, T. J., Kustas, W. P., Ritchie, J. C., Jackson, T. J., and Rango, A.: Remote sensing in hydrology, Advances in Water Resources, 25, 1367–1385, 2002.
Scop++: : http://www.ipf.tuwien.ac.at/products, January, 2005. Scop++: http://www.inpho.de, January, 2005.
Sithole, G. and Vosselman, G.: ISPRS Comparison of Filters, Pro-ceedings of the ISPRS working group III/3 workshop, 3-D recon-struction from airborne laserscanner and InSAR data, Dresden, Germany, 8–10 October 2003, edited by: Maas, H.-G., Vossel-man, G., and Streilein, A., Volume XXXIV, PART 3/W13; CD-Rom, 8 pages, 2003.
Van der Sande, C. J., De Jong, S. M., and De Roo, A. P. J.: A segmentation and classification approach of IKONOS-2 imagery for land cover mapping to assist flood risk and flood damage assessment, International Journal of Applied Earth Observation and Geoinformation, 4, 217–229, 2003.
Wagner, W., Ullrich, A., Briese, C.: Der Laserstrahl und seine In-teraktion mit der Erdoberfl¨ache, ¨Osterreichische Zeitschrift f¨ur Vermessung and Geoinformation, VGI 4/2003, 223–235, 2003. Wagner, W., Ullrich, A., Melzer, T., Briese, C., and Kraus, K.:
From single-pulse to full-waveform airborne laser scanners: Po-tential and practical challenges, in: International Archives of Photogrammetry and Remote Sensing, XXth ISPRS Congress, Istanbul, Turkey, 12–23 July 2004, CD-ROM, 2004a.
Wagner, W., Eberh¨ofer, C., Hollaus, M., and Summer, G.: Robust Filtering of Airborne Laser-Scanner Data for Vegetation Anal-ysis, Proceedings of the ISPRS working group VIII/2: Laser-Scanners for Forest and Landscape Assessment, Freiburg, Ger-many; 3–6 October 2004, International Archives of Photogram-metry, Remote Sensing and Spatial Information Sciences, Vol-ume XXXVI, Part 8/W2, 2004b.
Wealands, S. R., Grayson, R. B., and Walker, J. P.: Quantitative comparison of spatial fields for hydrological model assessment – some promising approaches, Advances in Water Resources, 28, 15–32, 2004.