THE DEVELOPMENT OF TIUNDERSTORIT COPLEX -[ES AND THEiIR ASSOCIAT11D VERTICAL TR1ANSPORTS
by GARY B.S., Saint LEE MELVIN Ijouis University (1967)
SU3BMIITTED IN PARTIAL FULFILIETT OF TBE REQUIHEMENTS FOR THE
.DEGREE OF MTASTER OF SCIENCE
at the
MASSACHUSETTS INSTITUTE OF TECIHRTOLOGY Augus t, 1968
Signature
Certifield
Accepted b
of Author...
kepa ient of M,eteoro1ogy, 19 August 1968
Thesis Supervisor
y *** . .. '...
ChaiDeartmental Committoe on Graduate
http://libraries.mit.edu/docs
DISCLAIMER OF QUALITY
Due to the condition of the original material, there are unavoidable
flaws in this reproduction. We have made every effort possible to
provide you with the best copy available. If you are dissatisfied with
this product and find it unusable, please contact Document Services as
soon as possible.
Thank you.
Due to the poor quality of the original document, there is
some spotting or background shading in this document.
THE DEVELOPMENT OF THUNDERSTORM COMPLEXES
AND THEIR ASSOCIATED VERTICAL TRANSPORTS
by
GARY LEE MELVIN
Sugiiitted-to the Department of Meteorology
on 19 August 1968
in partial fulfillment of the requirements for the degree of
Master of Science
ABSTRACT
Radar observations and a simple cll model have been employed to examine the relationship between the precipi-'tation in convective cells and the associated lighter
pre-cipitation within seven thunderstorm complexes. It has
been hypothesized that the lighter precipitation in the com-plex is a result of divergence of condensate produced with-in convective elements rather than a result of liftwith-ing on a larger scale. The observed characteristics of the areas have been described. The amounts of precipitation deposited by the convective cells and the surrounding complex and the average vertical velocities necessary to produce these amounts have been computed. The results were consistent with the
hypothesis.
The latent heat released within the convective cells and the vertical transports of mass and momentum were com-puted for the seven thunderstorm complexes. The release of latent heat and downward momentum transport appear sufficiently large to warrant further investigation as to
their effect upon larger circulations.
Thesis Supervisor: Dr. Pauline M. Austin
ACKNOWLEDGMENTS
I would like to thank Dr. Pauline M. Austin for her valuable advice and never-ending patience, Professor James M. Austin for. his comments and constructive criticisms of
the paper, and my wife, Irene, for her help in preparation of the figureq and tables and edifying encouragenent.
iv.
TABLE OF CONTENTS
I. INTRODUCTION 1
II. THE THINDERSTORM MODEL 4
III. DATA AND TETHODS 0F AEALYSIS
9
A. ,Data 9
B."' >;naakysis 10
IV. STORvi CASE DESCRIPTIONS ' 15
A. Cases I and II, June 9, 1965 15 B. Cases III, IV,'V, End VI,
June 23 and 24, 1965 17
C. Case VII, August 28, 1965 20
V. DISCUSSION OF RESULTS 22
A. Development of the Thunderstorm Complex 22 B. Computation of Vertical Transports 25
VI. CONCLUSIONS 27
FIGURES 29
TABLES 52
Fig. 2 Surface £catures at 0900ST on June 9, 1965.
Fig.
3
Surface features at 1800EST on June 9, 1965. Fig. 4 urface, fCatures -at 1800EST on June 23, 1965. Fig. 5 Surface features at 0900EST on June 24, 1965. Fig. 6 Surface features at 1400ES"T on Auguist 28, 1965.Fig. 7 Sounding for Albany, N.Y., at 0700EST, June 9, 1965. Fig. 8 Sounding for Albany, N.Y., at 1900EST, June 23,
1965.
,Fig. 9 Sounding for Portland, Ye, at 0700EST, June 24, 1965.
Fig. 10 Sounding from average conditions at-Portland, Me,, Albany, N. Y., and Nantucket, Mass., August 28,
1965.
Fig. 11 Actual and aoroximate mixing ratio -profiles for
0700 EST, June 9, 1965, Albany, N.Y.
Fig. 12 Actual and approximate mixing ratio profiles for
0700 EST, June 24, 1965, Portland, Me.
Fig. 13 Actual and approximate mixing ratio profiles for average conditions, 1300EST, Aug,?ust 28, 1965, ALB, ACK, PWM.
Fig. 14 Actual and approximate mixing ratio profiles for 1900 EST, June 23, 1965.
Fig. 15 iMotion and development of the complex in Case I from 0915 EST to 1013 EST on June 9, 1965.
Fig. 16 -Ootion of the ceIls in C:.se I on June 9, 1965. Fig. 17 Motion and development of the complex in Case II
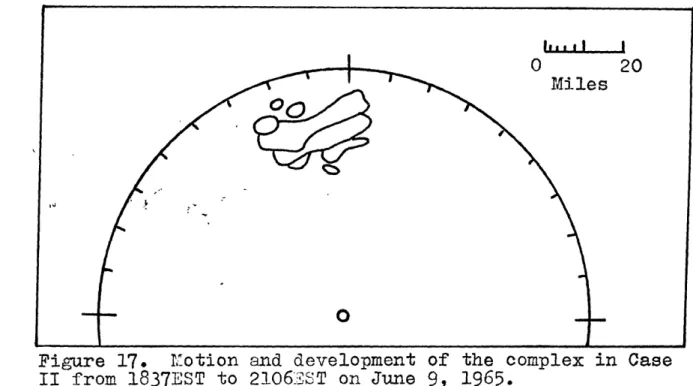
from 1837 EST to 2106 EST on June 9, 1965.
Vi. Fig. 19 Fig. 20 Fig. 21 Fig. 22 14
PPI of storm complex in Casc II at 1953EST on June 9, 1965.
RHI display of vertical sections through the complex in Case II which is ohown in Figure 19. 1Notion and development of the complexes in Cases
III, IV, and V, on June 23, 1965.
Eo,tion of -the cells in Cases III, IV, and V on Jtne23, 1965.
PPI at 1816 EST, June 23, 1965, of the squall line in which storm Cases III, IV, and V occurred.
Fig. 24 RHI display of a vertical section through the 0 squall line in Figure 23 at 1937 EST and AX 301 Fig. 25 Motion and development of the squall line-in Case
VI from 0958 'ST until 1100EST on June 24, 1965.
Pig. 26 Lotion of the cells in Case VI, June 24, 1965.
pig. 27. PPI at 1101 EST, June 24, 1965, of the squall line in Case VI.
Fig. 28 RHI diso.lay of a vertical section through the
0
squall line in Casc VI at 1132 EST and AZ 240 . Fig. 29 M.-otion and development of the complex in Case VII
from 1454 EST to 1652 EST, August 28, 1965. Fig. 30 Cell movement in Case VII, August 28, 1965.
Fig. 31 PPI-at 1609 EST, August 28, 1965, of the complex in Case VII.
Fig. 32 RHI display of a vertical ccoss section througg the complex in Case VII at 1612 EST and AZ 235
Fig. 33 Wind profile at 0700 EST, June 9, 1965.
Fig. 34 Wind profile at 1900 EST, June 9, 1965. Fig. 35 Wind profile at 1900 EST, June 23, 1965. Fig. 36 Wind profile at 0700 EST, June 24, 1965.
at 1300 EST, August 28, 1965.
Fig. 23
LIST OF TABLES Table Table Table. Table Table Table Table Table Table Table Table Table Table Table Table Table Table Table 1. 2. 3. 4.
5.
6. 7. 8. 9. 10. 11. 12. 13. 14. 15. 16. 17. 18. Table 19. Table 20. Wind IData Wind Data Wind Data ind Data inc. Data Intensity Intensity Intensity Intensity 0700E'T, June 9, 1965. 1900EST, June 9, 1965. 1900EST, June 23, 1965. 0700EST, June 24, 1965. 130012ST, August 28, 1965. Calibration June 9, 1965. Calibration June 23, 1965. Calibration June 24, 1965. Calibration August 28, 1965wCharacteristics of Cells Case I June 9,21965.
Charactoristics of Cells Case II June 9, 1965. Characteristics of Complexes June 23, 1965.
Chardoteristics of Cells Case III June 23, 1965.
Characteristics of Cells Ca.se IV June 23, 1965.
Characteristics of Cells Case V June 23, 1965. Characteristics of Cells Case VI June 24, 1965.
Characteristics of Cells Case VII August 28, 1965.
Precipitation and Vertical Transports for an Average Cell Assuming Equal Amounts Deposited as Precipitation and Left as Cloud and
Neglect-ing the Complex.
Precipitation and Vertical Transports for Each
Com-lex.
Average Vertical Velocities (mps) Necessary to Produce Given A~mounts of Condensate.
I. INTRODUCTION
The thunderstorm, with its associated heavy rainfall, strong surface winds, large hailstones, and tornadoes, has fascinated meteorologists, not only as an extreme weather h4zard, but as a rebuff to explanation. Rapid time changes and remarkably sharp small-scale spatial variability have
prepluded ad"quate -observational evidence from which a general theory of thunderstorm evolution might have been established. Although thunderstorm dynamics have yet to be totally explain-ed, a more than rudimentary knowledge of such small-scale
atmospheric convection does exist. Observation has establish-ed that thunderstorms are typically a complex of several
units each consisting of an undraft with its associated
convergence-divergence pattern, hydrometeors, and downdraft. These units have lifetimes less than that of the storm
(Byers and Braham, 1949). In adclition, these storms are observed to occur as a scattered, isolated phenortenon or in a group, lying in a line.
This knowledge has been gained, in part, through the application of radar to meteorological research. With its ability to quantitatively map the throc dimensional liquid water content of the atmosphere, radar furnishes information
about the structure and intensity of thunderstorm activity. The ability to sample over a large volume in a short time period renders radar an essential observational instrtgent for observing a storm throughout its entire lifetime. How-ever, its resolution is marginal for depicting the inter* nal structure of thunderstorms. It is necessary to define the comnonents of these convective storms on the basis of what the radar sees in order to discuss them meaningfully, even though the definitions may be somewhat arbitrary. A cell is defined as a very small echo close to the limit of tie radar's resolution. Generally, the cell echo appearsat
a high signal intensity level and is surrounded by a small area (on the order of 102 to 103 mi. 2) of less intense
edfi.
A cluster of these cells, occurring either simultaneously or in a sequence, is defined as a complex. Any group of these complexes whidh'apr:ear on the radar as a line is de-fined as a squall line.Previoup radar investigations of New England thunder-stoims (Boudherand Wexler, 1961, Swisher, 1959, Cochran, 1961, Stem, 1964, and Omotoso, 1967) have recognized that they do appear as complexes composed of small intense echoes surrounded by larger areas of lesser intensity. The studies described the characteristics such as size, duration, and motion of the various precipitation areas. No attempt was made to determine whether the lighter precipitation, which was continuously observed to accompany the intense cores, was condensed within the cells or produced by some other mechanism such as a small-scale convergence-divergence sys-tem.
An understanding of the relationship betweei precipi-tation areas of various sizes as observed by the radar, is important not on'iy in studies of mesoscale circulations and precipitation physics, but also is critical in determining the associations between global, synoptic, and sub-synoptic circulations. Two features of the small-scale motions,
which may be significant to the larger ones are the release of latent heat and the vertical transport of such guantities as momentum, sensible heat, and moisture. Austin (1968) has suggested that these relationships can be studied from quantitative radar observations and a simplified cell model wherein the vertical mass transport of air is related to the total amount of precipitat:ion produced by the convective motions. It is, therefore, necessary to determine how much
of the precipitation within thesis actually produced within the cells or is produced by some other mechanism such as a
mesoscale convergence-divergence system.
The purpose of this study is to investigate the
develop-ment of the thunderstorm complex in an attempt to clarify the relationship between convective cells and associated lighter precipitation. The hypothesis that the lighter
pre-ipi.tation is produced within the convective elements and diverged to . broader area will be examined. In addition, latent he t4reltase and vertical transport of momentum will be computed in order to obtain an estimate of their magnitudes.
II. THTE TIHJERSTORM MODEL
It is customary to model the behavior of the air and water substance throughout the evolution of the thunder-storm using the results of explorations in an attempot to aqcertain what actually takes place. Excellent review articles (Severe Local Storms, Meteorological Monographs, 1963) are available, and it is rot necessary to consider present thunderstorm models in detail. However, certain thunderstorm characteristics are common to cost models and are generally felt -to be realistic, while others are assumed with varying degrees of confidence.
Outward physical cha1racteristics of thunderstorm com-plexes are obviously the least disputed. Cells range from less than a mile to a maxinum of four or five miles in dia-meter. Complexes have a horizontal dimension from ten to fifty miles. Cells range in height from 25,000 feet to
greater than 50,000 feet and posses- lifetimes which average 20 minutes. Smallechoes, here defined as cells, move with the mean wind in the middle troposphere (Byers and Braham, 1949, and Ligda, 1953). The motion of the complex, which consists of propagation due to new cell growth as well as movement with the wind currents, may be with or to either
side of the mean tropospheric wind, but most often is to
the right and slower (Byers, 1942, and Newton and Katz, 1958).
Modelling the internal structure of a convective cell requires that certain assumptions be made that are based upon less than sufficient direct observational evidence. An updraft must exist to produce precipitation. The
charac-teristics of an updraft irclude the magnitude of the vertical velocity and its variation with height, draft dimension and lifetime, the amount and effect of entrainment into the draft, and the ratio of total water condensed in thc updraft to that deposited as precipitation. It requires an extensive obser-'
vational network, such as that used by the Thunderstorm
Project (Byers and Braham, 1949), to observe these character-istics.
As was demonstrated by Kessler (1967) and formulated into a model by Austin (1968), the total amount of lifting pro-duced by an updraft within a convective cell must be related
to the total observcd precipitation from that cell. Since radar yiela thrintensity, dimensions, and duration of a precipitation area, the total amount of -recipitation can be determined. Those aspects of an updraft which are of particular importance in a model designed to determine ver-tical transports from observed precipitation are the varia-tion of vertical velocity with height, the amount and effect of entrainment into the updraft, and the ratio of totalwater -condensed to that actually deposited as precipitation.
Fairly realistic approxim-ations to updraft profiles are either linear or parabolic (Atlas, 1966, and Kessler, 1967). As air rises in the updraft, lateral mixing will occur
to maintain mass continuity. The process and its effect have been discussed in detail. Stommel (1947) introduced the-concept of entrainment to account for cloud temperatures observed to be less than calculated in a parcel ascent. The drawing of unsaturated air through the sides of a cloud
results in: partial evaporation of the liquid water content. This and the mixing of cooler air from outside the cloud
will cause a rising parcel to cool at a rate greater than the moist adiabatic. Austin (1948) demonstrated that in-cloud
lapse rates and cloud height are highly sensitive to entrainment rate and the environmental dryness. Houghton and Cramer
(1951) showed that if there is buoyancy, entrainment is
ne-cessary to satisfy mass continuity. W1ith an updraft of con-stant cross section, entrainment in the convergent region below the level of maximum vertical velocity and loss through I.
divergence above that level are determined by the shape of the vertical velocity profile.
The cumulus convection which precedes the development of thunderstorm complexes occurs in unsaturated air which is drawn into the updrafts by the necessary entrainment pro-cess.. This lateral mixing of drier air from the environ-ment into the ascending air of a cumulus cloud reduces the de,-',ree of instability within it. If the initial buoyancy
is great enough, -the cumulus cloud may develop into a thunder-storm.
Often a thunderstorm initially appe.rs on the radar as a very small echo of high intensity. This echo soon becomes surrounded by a larger ar-a of lighter precipitation. As subsequent cells appear, the area of lighter precipitation continues to grow and reaches a maximum horizontal dimension many timos that of a single cell. Some models of
con-vective cells have failed to recognize this area of lighter precipitation and entrain unsaturated environmental air into
the updrafts. Considering the necessary pre-thunderstorm convection and the ultimate size of thunderstorm complexes, it seems reasonable to consider the cells as growing and operating within a saturated environment after some initial growth period. As stated in the previous paragraph, it is recognized that the original cumulus convection takes place in an unsaturated environment. Probably, the cell initially
detected by the radar is -also operating in a less than satura-ted environment.
As convection and condensation proceed precipitation develops, but not all of the condensate is actually deposited as rain. Some may be left as could, evaporated from cloud sides, or evaporated in a downdraft. Braham (1952) has pro-vided estimates of the percentages of condensate lost to these various sinks. The importance of these estimates and, the manner in which they are applied to the model are
dis-7.
cussed in subsequent chapters.
Those characteristics of an updraft important in a model designed to relate vertical moss transport to obsorved amounts of precipitation have been discussed. This model, which is outlined in the following chapter, is used to obtain estimates o'f latent heat release and the transport of momentum. Since the observedprecipitation is the basis of the computations, it its impcr"antto know whether this precipitation was pro-duced by stratiform or convective lifting.
For a given amount of condensate a fixed amount of latent heat is released, but the manner in which the air is lifted
to cause the condensation determines where this heat will be deposited. In stratiform lifting, the heat is deposited
in the layer where condensation occurs. However, the great vertical extent and large vertical velocities of the
thunder-storm deposit the latent heat condensed in the updrafts near the top of the cells.
The mode of lifting is especially important in vertical transports. The air lifted within a narrow convective cell is lifted rapidly and drawn from all levels below the level of maximum vertical velocity. Thus, air entrained from the lowest layers has the opportunity to be lifted to the top of the thunderstorm cell. In stratiform lifting, the
Vertical velocities are not rrcat enough to carry air through a very deep layer. If the air lifted within a convective
cell conserves its characteristics during the ascent,
the thunderstorm becomes a means of transporting quantities such as momentum through a deep layer.
It is necessary to know whether the light precipitation within the complex is produced within the convective cells or by stratiform lifting throughout the precipitation area in order to aoply the model jnd compute the vertical transports and asses. the effects of latent heating. Therefore, it is hypothesized that the lighter precipitation is a result of the divergence to the surrounding area of condensote produced
average vertical velocities necessary to produce these ob-served emounts of precipitation, and by examining the phy-sical characteristics of the precipitation areas. The data and methods of analysis appear in the following chapter.
9.-III. DATA AITD METHODS OF ANALYSIS A. Data
The basic data utilized in this investigation consist of radar observations and conventional synoptic reports. The radar data wer-,e supplied by the Weather Radar Project located at the Massach'usetts Institute of Technology and were in ths 'orm-of 35 mm photographs of averaged, range-normalized signals, quantized into levels of 5 db. This corresponds to a factor of two in equivalent rainfall rate. This rate is obtained with the use of the empirical rela-tionship: Z = 200R1 .6. Z is the radar reflectivity factor expressed in mm6 m-3 and R is rainfall rate in mm hr~I. Austin and Geotis (1960) estimate that the accuracy of the
radar measurements is within 2-3 db or less than a factor of 2 in eauivalent rainfall rate. The data were from the SOR-615-B which is a 10.7 cm radar having a beam width of 3 degrees between half power points. Because of an increase in
sensi-tivity of the radar effected in the fall of 1964, data were chosen from 1965. The plan position observations were taken at-an elevation angle of one degree and a range of 120 statute miles.
A careful examination of all data for the summer of 1965 was undertaken, and seven thunderstorm complexes were selected as a basis for computations. In all cases but one these storms were chosen because radar data, including both plan position and range-height indications, were available for the entire storm period. The seventh case was chosen because it involved the initiation and growth of a squall line within radar range.
Conventional synoptic data yielded the atmospheric conditions within which the~storms were occurring. Rain-gauge records were examined, but the isolated nature of the majority of thestorms made the reports of little use
except to indicate the presence or absence of.widespread
light precipitation not detected by the radar. Examples
of the data are given'in Figures 7 through 10, and 16
through 37.
B4 Analysis
The analysis detailed below was performed on six of the
sevey cases' phospn.Q-. It was only slightly modified for the
case where the squall line formed within radar range, because
records were not available for its entire lifetime.
Information which is directly available from radar data
consists of cell and complex echo duration, dimension,
move-ment, precipitation rate, and total water deposit. The
num-ber of cells and their trajectories w -re determined by placing
the PPI films upon a viewer which displayed each frage in"
sequence, allowing accurate tracking. ,An average of .05 hours
was required for esch frame, therefore,
a complete sequence-of
intensity levels could be taken within 2-3 minutes. Thus,
the
rapid changes which occur within a
complex could be viewed
with a fair amount of accuracy.
Complex duration includes the time between the first
appearance of a radar echo, associated with the first cell
in the complex, and the disappearance of the complex echo.
Cells first appear on the PPI as very small echoes near the
upper limit of the radar's resolution. These spots generally
increase in size while remaining at about the same
inten-sity. Then, presumably with the termination of the updraft,
the areas slowly continue increasing in size but decrease
in intensity until reaching the same intensity level or
pre-cipitation rate as the complex. The lifetime of a cell is
considered to include the time between the first appearance
of the small spot and its loss of identity within the
com-plex.
11.
averaging the duration, dimension, and precipitation rate of all cells observed within the complex. The precipitation rate for a given cell was taken to be the average of those
intensities which were indicative of it while it was in existence. The total water deposited by an average cell was then determined.
The total water-deposited by the precipitation from the"comple'xex cluding the cells was computed by a lengthy proceso of determining the area corresponding to each inten-sity level for each sequence of PPI photographs. Since the time required to photograph -the sequence was known the water deposited during that 2-3 minute interval could be computed. The sum of the values obtained from each series of PPI photo-graphs equalled the amount deposited by the complex outside of the cells.
A comparison was then made between the amounts of pre-cipitation deposited by the cells wit4in a complex and that around the cells in order to determine whether the magnitudes were such that the' amounts outside the cells could have been
reasonably produced by condensation within the cells. The relationship between these procipitation amounts was then compared from storm to storm in order to determine its varia-bility.
The model described below, after Austin (1968), was then applied to these observed amounts of precipitation to deter-mine the mass transport necessary to produce them. In the model it is assumed that a linear updraft starts from an
initial disturbance nrea-r the bottomi of an unstable layer (Figure 1). As the initial air rises, equal amounts of air are entrained from each layer below z1 , the level of
maxi-mum vertical velocity. LikCewise, equal amounts are lost
to each layer above z1 as the air velocity approaches zero at z2. It is further a:csumed, that the updraft has a uriform, and constant cross section, and that air density remains
constant with height. For computations, air density was taken to be.1 kg m-3. Entrained air mixes thoroughly within the updraft, and the moisture condensed for every cubic
meter of air which rises through z1 is -given by Austin as:
1 z ( -) 1) - q'(z)]dz + 1 0 1 ( z) 2
(q'(z
1) - q'(z)]dz (1) 2 1ziwhere g(z) is the mixing ratio at any level z and the primed quantities refer to coiditions within the updraft. For a given storm, q(z) can be obtained from radiosonde data.
Austin does not include a consideration of the sur-rounding precipitation of the complex in the cell -model, but simply assumed that environmental air is entrained into
the updraft. Since the complex is consistently associated with the cells in radar observations, it must be considered
in a realistic cell model. It is proposed that the preci-pitation within the complex is a result of condensate
pro-duced within cell'updrafts. The temperature within the com-plex is assumed to be the same as that within the environment, but the complex is saturated by condensate from the cells. The lapse rate within the cells would lie between the en-vironmental lapse rate and the moist adiabatic, but would differ only slightly from the environmental rate. If the tem-perature in the cells is only a few tenths of a degree war-mer than the air in the complexes the necessary buoyancy will be provided. Thus, the temperatures within the complex and the cell can be approximated by the environmental lapse rate. Therefore, q'(z) and q(z) would be very nearly the same.
The environmental saturated mixing ratio was used for q'(z) and q(z) and wvs approximated by an exponential function for integration of ecuation (1). (Figures 11 through 14).
Of the condensate produced in the updraft, some will.
13.
some will fall as precipitation, and some will evaporate in the downdraft. The evaporation within the downdraft can be neglected since the downward mass transport within the downdraft equals the upward mass transport within the updraft necessary to condeie out the moisture which is subsequently
e'vaporated. Braham (1952) estimated that for average air mass thunderstorms in the eastern United States the conden-safe evaportted' from cloud sides and left as cloud is twice that which falls as precipitation. Kessler (1967) in his kinematic nodels of cells embedded in saturated air, found that the amount left as cloud was roughly one-third as large as that left as precipitation. In this study various per-centages of condensate were assumed to be left as cloud or evaporated aloft in order to examine the differences in mass transoorts necessary to produce such amounts.
Equation (1) gives the amount of moisture condensed per cubic meter of air passing through zl, when the updraft speed varies linearly with height. This, plus the observed total water deosit, yields the vertic.-l1 mass transport of air necessary to produce the observed precipitation. At
any level, the downward trarsport of air outside of the cells must equal the amount transported upward within the updraft.
This downward transport is assumed to take place as a uniform downward shift outside of the complex, oince downward motion within, the complex would result in evaporation of the
pre-cipitation within the complex.
Computations with the acsiuption of a constant updraft and no entrainment re.sult in double the amount of condensate produced for each cubic meter rising through zi. A parabolic updraft profile reguires less mass transport to produce a given amount of precipitation than does a linear profile but more
transport than the constant updraft. Thus, it would seem that the assumption regarding the vertical velocity profile introduces an uncertainty of less than a factor of 2 into II
the computed mass transport (Austin, 1968).
Average vertical velocities were computed by dividing the necessary vertical mass transport to produce the observed precipitation by the duration of an average cell. This
results in an admittedly questionable value since a constant vQrtical velocity does not act for the entire duration of
a cell, and the updraft duration is lot necessarily equal to the echo 1l4etime. - However, the given mass transport must
take place durineg' the lifetime of the cell to produce the observed water; therefore, the values presented must be somewhat of a minimum estirmate of the actual maximum verti-cal velocity. These -stimates were compared to observed vertical velocities within convective clouds in order to see whether realistic values were obtained, even though it is
assumed that all the observed precipitation was condensed within the cells.
Finally, the amount of released latent heat correspond-ing to the obscrved precipitation and the transport of momen-tum across the level of maximum vertical velocity were com-puted. It was acsumed that eaqual portions of air were
en-trained at all levels below z1 . The wind profiles in Figures
33 through 37 were used to compute the horizontal momentum at
each level, and it was assumed that the entrained air con-served t'is momertum during its ascent. The values obtained
in these computations were examined to determine the signi-ficance of their magnitudes.
15.
IV. STORM CASE DESCRIPTIONS A. Case I and II, June, 1965
Synoptic Situation
,The major-feature of the June 9, 1965, upper air pattern was a moderately cold trough extending southward from the Hudson Bay area to the northern Great Lakes Region. A 500-mb Iow presJure rceniter was located over James Bay, and the
flow aloft over the New England area was from the southwest.
A surface low and frontal system were associated with' the upper level trcaugh. The low was located in northern Ontario. A cold front exterding southward from this low moved through the Midwest durirg the afternoon and evening
of June 8 and occluded in Canada during the early hours of June 9. At 0100 EST on June 9, the front was stationary in
the extreme eastern Great Lakes Region, while the northern section moved much more slowly than during the previous day.
Two thunderstorm complexes, which formed in the warm moist air in advance of the front, wore examined. The first
occurred between 0915 and 1013 EST and was associated with a widely spaced line of thundershowers. This line passed
through New England and was followed by isolated
thunder-storms which occurred throughout the day. ,Yontpelier and Bur-lington, Vermont, Albany, New York, Boston, Macsachusetts, and Concord, New Hampshire, reported thunderstorms prior to the occurrence of the second complex examined 1837 to 2106 EST.
The 0700 EST sounding for Albany, New York, (Figure 7), seemed most reprosentive of the air mass in which the
storms occurred. The moisture and temperature structure
indicated a good possibility of convective activity. Sur-face conditions at storm times are given in Figures 2 and 3.
General Description of the Storms
south-echo was associated with the initial cell. The complex form-ed about this 'cell and increasform-ed in size until the third and last-cell in the complex developed. Then the complex de-creased in size and -did not appear after 1013 EST. The line moved from -4O .at aproximately 20 mph. The complex moved
from 2850 at 19 mph (Figure 15).
The complex consisted of 3 cells having an average life-time of 28 minutes'and cross sectional area of 2 km2 (0.8 mi2) This area was determined by averaging the areas of the cell during each frame of PPI photographs as it appeared according to the definition in Chapter I. The characteristics of- the 'cells are given in Table 10. The new cells formed to the
lower right; however, one was quite removed from the others (Figure 16). Cell heights were estimated from radiosonde
data to be midway between the lovel where the buoyancy ceased, determined from a'parcel ascent, and where the kinetic energy was depleted, deter4ined on an energy diagram. The estimated height of 12 km (40,000 feet) was in agreement with RHI's taken through the line two hours later. The bases of the cells were considered to be at the lifting condensation level which was approximately 1 km above the surface.
The saturation mixing ratio profile (Figure 11) was determined from the sounding in Figure 7. The mean precipi-tation rate in the cells was 16 mm hr~ . An average cell deposited 1.5 x 10¹⁰gm of water, and the complex, excluding the cells, deposited 2 x 10 1gm of water. The precipitation rate within the complex ranged from 1 to 10 mm hr~1. A
total transport through the level of maximum updraft of 1.8 x 101 0m3 of air per cell was necessary to produce the total observed precipitation assuming no added condensate for cloud and evaporation from cloud sides. Tables 18 and
17,.
19 summarize these values.
The second complex had a lifetime from 1837 EST to
2106 EST. Two cells formed initially and an area of lighter
precipitation gradually evolved about the two until they
combined to form the complex.
It
contained a total of 14
cells-with an average lifetime of 24 minutes.
The cells
averaged 8
Ain cross section
(3 mi.
2).
The cell
charac-teristics
.pear'in Table 11.
All new cells developed near
the right rear of existing cells and moved in the general
direction of the 700-mb winds. Cells forming in the right
half of the complex'had a more northerly trajectory, while
those forming in the left half tended to move more southerly.
Radiosonde (Figure 7) and RHI (Figure 20) indicated cell tops
at 12 km (40,000 feet) and bases at 1
km.
The movement of the complex is shown in Figure 17 to
be from 3200 at about 9 mph.
It is quite evident from
examin-ing Figures 17 and 18 and Table 2 that the movement was a
result of upper level winds and propagation from new cell
growth.
The same saturation mixing ratio (Figure 11) was used
as in Case I for computations. An average cell had a
pre-cipitation rate of 68
m
hr~
and deposited a total of 2.2.
x 10
gim of water. The precipitation rate in the complex,
outside of the cells, ranged from 1 to 23 mm hr
.The
com-plex outside of the cells deposited a total of 3.6 x 10¹²
gm of water. Thus, total water deposit required a vertical
transport of air through z equal to
1.x 10
11m
3of air per
cell. (Tables 18 and 19)
B.
Cases III, IV, V, and VI, June 23 and 24, 1965
Synoptic Situation
.
At 1300
EST. June
23, 1965, a
surface wave, apparently
associated with come disturbance aloft, appeared in the
warm sector preceding a cold front. The front extended
southward from a low in southeastern Quebec. This wave moved through New England in the early evening triggering a vigorous squall line. The 1900 EST sounding for Albany, New York,
(Figure 8) revealed- an unstable atmosphere with warm, very moist air at lower levele. The winds were southerly up to
85,0 mb and southwicsterly changing to westerly above (Table 3). The.surface analysis prior to storm time appears in Figtre 4.
The cold front moved eastward throughout the night and reached Boston about 1100 EST. Radiosonde data at 0700 EST
from Portland, MIain'e, indicated conditions in advance of the front. The atmosphere was highly conditionally unstable and very moist up to 300 mb (Figure 9). 7inds wore south-westerly at all levels. Skies were generally overcast from
late afternoon on June 23 until noon on June 24. There was widespread precipitation from 1900 EST until midnight.
Af-ter midnight the precipitation wa,- much more scatAf-tered and generally ended by 1200 EST. The position of surfacQ
fea-tures are shown in' Figure 5.
General Description of the Storms
Three complexes were chosen from the well developed squall line which appeared on the radar on the evening of June 23. The line was around 200 miles long and moved approximately 25 mph from 3200 (Figure 23). The complexes chosen had lifetimes of 65, 25, and 75 minutes and all formed about
the initial cell after that cell wac detected by radar. The characteristics of the cells within these complexes are given in Tables 13, 14, and 15, while those of the
c'om-plexes are given in Table 12. Figures 21 and 22 show storm and cell movements. The cells and complexes appeared to be moving with the winds at and above 700 mb (Table 3). The new cells seemed to build near the front of existing cells, but there was no preference as to the side on which they
19.
formed. Cell heights were estimated at 13 Im (45,000 feet)
with bases at 1 km (Figure 24).
The mean precipitation rate
of
cells in Case III was
31 mm hr
.Therefore, an average cell deposited 3.6
x
1010
gm of water during its 18 minute lifetime. The precipitation
rate within the complex outside of the cells ranged from
1
to
20 mm hr~
, and
the complex deposited3.9 x 10
in
addition- to thdtfdeposited by the cells. Therefore, each cell
transported
2 x
1010 M
3of air to account for the total
precipitation. The saturation mixing ratio shown in Figure
14 was used for these computations.
The average cell in Case IV had a lifetime of 15 minutes
-and a-
precipitation rate of 8.5 mm br
1.
Thus, it deposited
5
x 10
9gm
of water. Precipitation rates in the surrounding
complex ranged from 1 to 4 mm hr~
and amounted to 5.4
X1010
gm of additional water. 4.2 x 10
9m
3of air were transported
vertically in each cell to produce the observed total pre~
cipitation.
Crase V had three cells with an average lifetime of 25
minutes and mean precipitation rate of 20 mm hr
.Each
cell deposited 3
.10
10 gm of water. The precipitation rates
within the complex ranged from 1 to
8.5
mm hr~
and deposited
a total of 3.3 x 10¹¹
gm
in addition to that deposited by
the cells. The required vertical transport for each cell
to produce the total observed precipitation was 2.6 x
10
0 M
3.
,A squall line began to form at 0958 EST on June 24,
1965,
and the growth was followed until 1100 EST. The first
cells appeared to the southwest of the radar site and
sub-sequent growth was to the northeast. Figures 25 and 26
illustrate the development. In the beginning stages of the
line development, the complexes would form about the dells
someti~me
after their initial detection. After several cells
had formed the complexes joined and the line
became
a
combina-tion,
of many cells and complexes (Figure 27).
The
character-istics of the cells which formed up to 1100 EST are given in Table 16. The cells for which a total lifetime is not given were in existence when observations were halted at 1100 EST. The cells moved slightly to the right of the 700-mb winds (Table 4). The average cell lifetime wa2 27 minutes and cross sectional area was 2 kh12 (0.8 mi.2) Figure 28 shows cell heights near 9 km (30,000 feet). Cell bases were estimated to be at 1 km. There appecred to be 'no pre-ferred regions of new cell growth.
The mean precipitation rate of an average cell was 21 mm hr~ and such a bell dcposited 1.9 x 10¹⁰
gm
of water.The precipitation within the complex outside of the cells ranged from 1 to 15 mm hr~. The amount of water in the comDlex at the time when observations were halted was deter-mined by the expression Z = 0.083MI1.82 (Barge, 1968). Thus,
the precipitation up to 1100 EST in the complex outside of the cells plus the amount of precipitation remaining aloft within the complex at 1100 EST equalled 1.35 x 10¹² gm. The
total mass transport per cell to account for all observed precipitation was 5.7 x 10¹⁰ m3.
C. Case VII, August 28, 1965 Synoptic Situation
Scattered air mass thunderstorms occurred within radar range of Boston on August 28, 1965. A surface low pressure center was located just northeast of the Great Lakes region having a complex frontal system associated with it. Extend-ing eastward from the low into central Maine was a stationary front. Trailing southward from the low were two cold fronts (Figure 6). A secondary cold front managed to catch the pri-mary in the late afternoon and system moved through Boston
during the evening of August 28.
The storms occurred in a warm sector southeast of the low. The flow aloft changed from southerly to southwesterly
21.
in the late afternoon as a tight 500-mb trough moved through
the area. A Jet was located over the region 9f actiyity.
Radiosonde data 'at 1300 EST for Portland, Maine,
Nan-tucket, Massachusetts, and Albany, New York, were remarkably
similar. The atmosphere was conditionally unstable (Figure
10) and there existed a strong wind shear (Figure 37 and
Table
5).
General Description of the Storm
The storm complex chosen had a lifetime from 1454 to
1652 EST. There were a total of 13 cells which formed in
sequence within the complex. Cell characteristics are
given
in Table 16 and illustrated in Figure 26. The average
dura-tion of a cell was 20 minutes, and their average cross
see-tional area was
5 km2.
The movement of the complex is shown'
in Figure 25 to be from 2400 at approximately 33 mph. Cells
extended through a layer from 1 to 11 km (35,000 feet), New
cells appeared forward of existing cells (Figure 30), either
to the right or left, or replacing the cells in the same
path. Cells forming on the right of existing cells moved
more easterly and cells forming on the left moved more
northerly. Two cells appeared initially on the radar and
complexes of lighter precipitation quickly formed about them.
These two complexes
joined to form the large one observed.
The
complex reached
a maximum size of 330 km
2and
dissi-pated with the last cell in the complex.
The average cell had a precipitation rate of 60 mm hr~
and deposited 1.9.x 1010 gm of water. The precipitaton
rate within.the complex ranged from 1.5 to 42 mm hr~,
and
deposited 2.9 x 10¹²
gm
of water in addition to that left
by the cells. 5.7 x 10¹⁰
m
3of air were transported
verti-cally across z
1 in each cell to produce the total observed
.
DISCUSSION OF RESULTS
A. Development of the Thunderstorm Complex
The physical. characteristics of the seven
thunder-storm complexes examined support the hypothpsis that the
complexes,develop as a result of condensate, produced within
the cells, being diverged to the surrounding atmosphere
rather thai bg slow,
lifting and condensation throughout
the area of prec'ipitation. The most obvious fact observed
in all cases was that the precipitation within the complex
always developed abput the cells. The movement of the
com-plexes was a combination of propagation from new cell growth
and movement with the mean tropospheric winds. The complexes
developed after the detection of the cell echoes and tenminated
with the expiration of the final cell or cells. Thus, the
lifetire of a complexis.equal to the period during which
cell echoes are apparent. In addition, complexes seem to
in-crease in size to some maximum horizontal dimension at which
they remain for the majority of their lifetime. RHI's
indi-cate that the complexes have the same vertical development
as the cells about which they occur. This strengthens the
possibility of divergence from the cells producing the
pre-cipitation within the complex instead of some lifting mechanism
on a scale larger than that within the cells.(Figures 20, 24,
and 32).
Another interesting fact observed from RHI's
taken nearly upwind (Figures 24 and
32)
is that the
preci-pitation aloft within the complex extends far downwind from
the location of the cells. This fact lends considerable
credence to the proposed h3pothesis. In addition, Figures
19 and 31, show that the majority of the complex is located
downwind of the cells within. In both cascs a wind shear
existed (Figures 34 and
37).
Thus, the precipitation
diverg-ed aloft was being carridiverg-ed downwind. This shear may have
23 .
mass aloft and redistributing warm moist air downwind of
the
storm.
The results of computations outlined in Chapter III
appear in Tables 18-through 20. Table 18 presents the water
deposit, latent-heatfrelease, and transports of mas
and
momentum across the-
level of maximum vertical velocity for
an average cell from each complex. In computing these values,
it was assu Wd-that equal amounts of condensate were
deposi-ted as precipitation and left as
cloud, but the surroundid
'precipitation in the complex was neglected. Table 19 sumw.
marizos the same qusntities assuming that the cells produce
all observed precipitation but no cloud or cloud
evapora-tion. In addition, it relates the amounts of water
deposi-ted by the complexes,.cells, and the complexes excluding the
cells. Table 20 gives the average vertical velocity, across
the level of maximum vertical velocity, necessary to produce
the water deposited by the cells, the complexes, and various
assumed additional percentages of observed total precipita
tion assumed to have been left as cloud or evaporated from
cloud sides.
The most significant fact to be ascertained from Tables
18 and 19 is that in all cases but one the water
deposited-by the complex excluding the cells is within a factor of 2
or 3 of the sum of the water deposited by the cells within
the comolex. In no case is there an order of magnitude
dif-ference. Even though the number of cells within a single
complex ranged from 3 to 14, the water deposited by the
com-plexes excluding the cells was nearly equal to the amount
deposited by all the cells. This surely indicates a close
relationship between the Qells and the precipitation in the
complex. Even in Case VI, where the cells were made to
account for
all
precipitation observed in the development of
a squall line, the water deposited by the line excluding cells
and that deposited by the cells differed by a factor of three.
It seems highly unlikely that the same relationship would be
found if some other mechanism was resoonsible for the water
deposited by the complex.
A comparison of the computed average vertical velocities
and measured vertical velocities within thunderstorms also
supports the hypothesis. The computed vertical transports
and average vertical velocities depend upon the amount of
condensate,: 1ii ch is assumed 'to have been deposited as cloud
and evaporated from cloud sides. Braham (1952) has provided
estimates of the water budget of a thunderstorm based upon
data obtained in the Thunderstorm Project. It is not clear,
exactly, how these estimates would apply to this study
be-cause of differences in which precipitation was attributed
directly to the cells. It seems that Braham divided total
pbservcd precipitation by the number of cells, thus having
the cells produce all precipitation. In any event, his
are the only estimates available which are based upon
obser-vation. Braham estimated that twice as much condensate would
be left as cloud than would be deposited as precipitation.
Th4s may be somewhat of an overestimate in cases such as II,
IV,
and VII where there appeared a good number of cells.
Braham's estimate was considered to be an upper limit on the
amount of condensate left as cloud.
If it is assumed that equal amounts of condersate are
deposited as precipitation and left ,s
cloud (Austin, 1968),
the necessary average vertical velocities are less than 20
mps in all cases. Four of the seven cases are then below
10 mps. If Braham's requirements
are
met, all cases are
be-low 30 mps with five of the seven cases bebe-low 20 mp6 and
three below 15 mps.
The Thunderstorm Project observed updraft speeds of
5
to 10 mps with maximums of 25 mps in 25,000 foot
penetre-tions of thunderstorms in Ohio and Florida. Glider flights
in Germany yielded values of 20 to 30 mps consistently
250
(Ludlam, 1963), while radar tracking of objects through the
strongest portions of thunderstorm updrafts have estimated
velocities at
17.5 t6 27.5
mps (Battan, 1963).
Thus, it seems
that values such as those appearing in Table 20 are
compati-ble with observation. Indeed, if Braham's values are an
overestimate then the required velocities would appear quite
realistic.
Procdeses contributing to the development of
thunder-storm complexes may well be rriooi.e
complicated than the
pro.--
posed "cell-source" origin of the precipitation outside of
the cells.
Mesosc.le convergence-diverstence systems, sea
breezes, topography, and any other mechanism which creates
upward motion may contribute to the formation of the
preci-pitation manifest in the complex. But, observations of the
-physical chargLcteristics of the complxes
and
the values' in
Tibles 18, 19, and 20 indicate that the condensate produced
within convective cells can well be and probably are the
source of the precipitation in the complexes.
B. Computation of Vertical Transports
Tables 18 and 19 present the values computed for the
release of latent heat and vertical transport of momentum.
Table 18 presents these values for an average cell from
each complex assuming that equal amounts of condensate were
deposited as precipitation and left as cloud. The values
in
Table 19 were obtained assuming that the cells within the
complexes produced only the observed precipitation from the
entire complex. Thus, the values in Table 19 are a minimum
estimate and would increase depending upon the additional
amounts of condensate assumed to have been produced for
cloud and cloud evaporation.
In large convective cells such as those observed in this
study, latent heat is released from the cloud base to the
cloud top and deposited by the updraft in the upper region,
of the storms. The substantial rate of condensation within the thunderstorm updrefts and the great vertical develop-ment suggest that the thunderstorm might play a significant role in the vertical transport of heat. The latent heat re-leased in the seven ttorm cases studied ranged from 6.7 x
10
kj to 1.7 x 10¹³ kj. A total of 3.5 x 10¹³ kj was released in all. The maximum heating.rate, 2 x 10⁹ kj sec~ , was accomplishc'din Cease II. Tracton (1968) found a value of 6.2 x 10 kj sec~ in an extratropical cyclone. Considering the relative amounts of precipitation produced between the isolated thunderstorm complex and a widespread extratropical cyclone, a difference of tw:o orders of magnitude in effective heating rates would suggest the thunderstorm may be an
effec-tive mechanism for localized heating from condensation.
' From Table 19, it is seen that the thunderstorm appears to be a major mdode of momentum transport. The values for transport of momentum across the levels of maximum vertical
10 -1 12
velocity, z1 , rarged from 9.2 x 10 kg m sec to 9.4 x 10
kg m sec 1 . For the 1.4 x 10¹³ Em of precipitation which were obse-rved to fall from the seven storms, there was a
total downward transport of 2 x 10¹³ kg m sec~ . It was
assumed that the seven case storms occurred in atmospheres * that were typical of thunder:torm activity in England6ew
and the results of this study were applied to the 1 x 10¹⁶ gm of purely cornvective precipitation which are estimated to fall in an area of 4 x 10⁴ I2 about the rad:.r site in one year (Austin, 1968). This yielded 1.4 x 10¹⁶ kg m sec~
transported downward in one year. Computations of Starr and White (1951) indicate that the necessary downward transport
of e:stward momentum between 310 and 650 north latitude is 1.6 x 10⁵ gr cm sec 1 per cm2 per year. This is a
require-16 -14 2
ment of 6 4 x 10 kg m Cec~ for the 4 x 10
I
2 areaper year. The cetimated downward transOort due to convective storms is nearly one-fourth of the required amount.
27.
VI.
CONCLUSIONSAn understanding of the relationship between precipi-tation areas within thunderstorm complexes is important
in studies of mesoscale circulations, precipitation physics, and in determining the associations between synoptic and sub-synoptic circulations. Radar observations and a simple cell model have,. 'en used ~to examine the relationship between precipitation within thunderstorm cells and the associated lighter precipitation surrounding them. It was hypothesized that the lighter precipitation is a result of the diver-gence of condensate produced within the cells in contrast. to some mechanism, such as a mesoscale convergence-divergence system, creating precipitation outside of the cells.
The characteristics of the cells and complexes as ob-served by radar have been described. The lighter precipi-tation within the complexes develops about the cells, has a lifetime equal to the period when cells are apparent, moves with the cells, has the same vertical development as the cells, and can often be observed aloft and downwind of the cells.
The amount of water deposited as precipitation by the complex excluding the cells was found to differ in most cases by a factor of 2 or 3 and at most 4 from the water deposited by the cells within the complex. This close relationship was observed in all complexes regardless of the number of
cells embedded within them. The same relationship was
found to exist in a squall line whose development was observ-ed.
The average vertical velocities necessary within the convective cells to produce the observed total amount of precipitation agree with observed updraft velocities. Even when the observed water deposit was tripled, to account for additional water sinks, the values were realistic.
The observed characteristics, the amounts of water
de-posited, and the computed average vertical velocities
demon-strate that the convective cells can be the source of all
the observed precipitation from a thunderstorm complex.
The latent heat released within the convective cells
and the transports.of mass and momentum were computed for the
seven thunderstorm complexes employing a cell model wherein
th,
vertiqi-mpso -transport of air was related to the total
observed precipitation. The latent heat release and
down-,ward momentum transport appear to be sufficiently large to
warrant further investigation as to their effect upon larger
circulations.
z2
zo
Linear Updraft Profile
zi
zo
Parabolic Updraft Profile
Figure 1. Updraft Velocity Profiles Maximum vertical velocity at level zr..
O
RANGE 120mi
RADAR
e 0
o o o o o o
•
o oo
RADAR
O
RADAR
0
F
150 200 Pressure (mb) 300 400 500 600 700 800 900
temperature lapse rate dew point lapse rate -- -moist adiabatic lapse
- -- cloud top rate(parcel ascent)
cloud base -- -a -a a a It a a I A
-60 -40 -20
Figure 7. Sounding for Albany, N.Y.,
r 10 200 300 400 500 600 700 800 900 +20 VC at 0700EST, June 9, 1965. toO cloud base a & t I
-40
-20 0 +20 00Figure 8. Sounding for Albany, N.Y., at 1900EST, June 23, 1965.
150 200 Pressure (mb). 300 400 500 600 700 800 900
K
-
temperatu
--- dow point -- moist adirte
(parc
cloud top cloud base -40 -20 ro lapse rate lapse rate abatic laose el ascent) +20 0CFigure 9. Sounding for Portland, Me. 0700EST, June 24, 1965. 150 200 Pressure (mb) 300 400 500 600 700 800 900 cloud top -40 -20 0 +20 00 Figure 10. Sounding from average conditions at Portland, Me., Albany, N.Y., and Nantucket, Mass., 1300EST, August 28,
1965-37.
13
12 11q(z)
10
(g/kg) 9
87
A
6:-5
4
3
2
1-0Figure 11. Actual and for 0700 EST June 9,
14 13 12 11 q(z) 10 (g/kg) 9 8 7
6
5
4
3
2 1 q(z) = 13e-z/3x103 actual*approximate
4 6 U 10 12 (km)approximate mixing ratio profiles
1965, Albany, N.Y. -Z/4x10 3 g(z) = 15e--( .2x10- 3) z
actual*
approximate
(Im)
Figure 12. Acfor 0700 EST,
tual and approximate mixing ratio profiles
June 24, 1965, Portland, Me. *Actual refers to saturated conditions within complex.13 12 11 q(z) 10 (g/kg) 9 8
7
~'6. 54
3 2 1 q(z) = 13e-z/5x103-(.15x1O-3)z actual* approximate 0 2 4 6 8 10 (.an)'Figure 13. Actual and approximate mixing ratio profiles average conditions, 1300EST, August 28, 1965, ALB, ACK,
for PVM. Figure 14. Actual 1900EST, June 23, *Actual refers to q(z) = 14e-z/4x13 actual*
approximate
0
2
4
6
8
10
.1x10 3)z 12 (kma)and approximate mixing ratio profiles for
1965, Albany, N.Y.
saturated corditions within complex.
q(z) (g/kg) 14 13 12 11 10 9
8
7
6
5
4
3 2 139.
Figure 15. Motion and development of the complex in Case I from 0915EST to 1013EST on June 9, 1965.
Figure 17. Lotion and development of the complex in Case II from 1837EST to 2106EST on June 9, 1965.