HAL Id: hal-00304729
https://hal.archives-ouvertes.fr/hal-00304729
Submitted on 1 Jan 2002HAL is a multi-disciplinary open access archive for the deposit and dissemination of sci-entific research documents, whether they are pub-lished or not. The documents may come from teaching and research institutions in France or abroad, or from public or private research centers.
L’archive ouverte pluridisciplinaire HAL, est destinée au dépôt et à la diffusion de documents scientifiques de niveau recherche, publiés ou non, émanant des établissements d’enseignement et de recherche français ou étrangers, des laboratoires publics ou privés.
C. Neal, P. Shand
To cite this version:
C. Neal, P. Shand. Spring and surface water quality of the Cyprus ophiolites. Hydrology and Earth System Sciences Discussions, European Geosciences Union, 2002, 6 (5), pp.797-817. �hal-00304729�
Spring and surface water quality of the Cyprus ophiolites
Colin Neal
1and Paul Shand
21Centre for Ecology and Hydrology, Maclean Building, Crowmarsh Gifford, Wallingford, OXON, OX10 8BB, UK 2British Geological Survey, Maclean Building, Crowmarsh Gifford, Wallingford, OXON, OX10 8BB, UK
Email for corresponding author: cn@ceh.ac.uk
Abstract
A survey of surface, spring and borehole waters associated with the ophiolite rocks of Cyprus shows five broad water types (1) Mg-HCO3, (2) Na-SO4-Cl-HCO3, (3) Na-Ca-Cl-SO4-OH-CO3, (4) Na-Cl-SO4 and (5) Ca-SO4. The waters represent a progression in chemical reactivity from surface waters that evolve within a groundwater setting due to hydrolysis of the basic/ultrabasic rock as modified by CO2-weathering. An increase in salinity is also observed which is due to mixing with a saline end-member (modified sea-water) and dissolution of gypsum/ anhydrite. In some cases, the waters have pH values greater than 11. Such high values are associated with low temperature serpentinisation reactions. The system is a net sink for CO2. This feature is related not only to the hydrolysis of the primary minerals in the rock, but also to CaCO3 or Ca-Mg- CO3 solubility controls. Under hyperalkaline conditions, virtually all the carbon dioxide is lost from the water due to the sufficiently high calcium levels and carbonate buffering is then insignificant. Calcium sulphate solubility controls may also be operative when calcium and sulphate concentrations are particularly high.
Keywords: Cyprus, Troodos, ophiolite, serpentinisation, spring, stream, water quality, bromide, iodine, boron, trace elements, hyperalkaline.
Introduction
The overexploitation of groundwaters in Cyprus has led to a deterioration of quality in the major aquifers and the increase in demand has meant that exploitation of aquifers with marginal water quality is an important economic factor (Wagner et al., 1990). The water quality of spring and surface waters is examined for one of the major ophiolite areas for research, the Troodos Massif of central Cyprus. The aquifers of the Troodos region generally provide low potential yields and groundwater of variable quality, but represent the only source of water supply for many villages. The Cyprus ophiolite represents a back-arc basin that was probably lifted above sea level by the under thrusting of oceanic crust, a process intensified by a mass of serpentinite under what is now the centre of the Troodos Massif (Gass, 1982). This area contrasts with localities where oceanic crust was emplaced by major thrusting of ophiolite blocks onto a continental edge as a series of nappes (Gass, 1982; Lippard et al., 1986) or in an island arc setting (Gass, 1982).
Many of the largest rivers in Cyprus originate in the Troodos Massif. Spring discharge is generally highest in the plutonic rocks of the Troodos and the pillow lavas often contain saline water due to restricted circulation. The study
extends understanding of how surface and groundwaters evolve in ophiolite areas in the context of the different geological units present and the Cyprus data adds to the very limited amount of data on hyperalkaline waters in the Mediterranean region (Derkovic, 1973; Papastamataki, 1977; Pantazis, 1978) and elsewhere (Barnes et al., 1978). A comparison is made between water quality data from Cyprus and Oman, with contrasting geological settings, under thrusting and nappe emplacement, respectively. Both these systems are part of the “Tethyan” ophiolite sequence which stretches from the Alps through Cyprus, Bosnia, Croatia, Greece, Turkey, Iran, Oman, Pakistan and Afghanistan and through the Himalayas to Burma (Lippard et al., 1986).
Ophiolites
Ophiolites, “fragments of oceanic crust on land”, provide major research areas for the study of the mechanisms of global plate tectonics and the formation of the ocean floor within a geologic perspective (Gass, 1982; Wilson, 1989). The term ophiolite comes from the Greek ophis meaning snake- or serpent-like and it has a related meaning to major
water-rock alteration feature of ophiolites, the rock type ‘serpentinite’, and the key minerals associated with it, ‘serpentine’; the serpentine minerals, antigorite and chrysotile. Ophiolite exposures on land provide a picture of 5 km or more of slices through the oceanic crust to the mantle and such exposures have been the focus of major research activity for the past forty or more years, helping to elucidate the mechanisms of ocean floor formation, deformation and hydrothermal activity.
Broadly, the ophiolite sequence from surface to depth comprises:
z Deep-sea iron and manganese rich sediments.
z Basaltic magma extruded onto the sea floor commonly forming characteristic structures known as ‘pillow lavas’ (~1 km thick).
z Vertical dyke swarms (sheeted dyke complex), the conduits for basaltic magma transfer from depth to the sea floor at oceanic ridges (~2 km thick).
z A layered sequence of gabbros and, at greater depth, peridotites (each about 1 km thick). These represent the products of geochemical fractionation of mantle-derived melts in a magma chamber, which provided the basalts of the sheeted dyke complex and the pillow lavas of the sea floor.
z The upper mantle of tectonised ultrabasic rocks such as hartzburgite, dunite and peridotite.
Within the igneous rocks of the ophiolite, there is a progressive change in mineralogical and chemical composition. Near the surface, the basaltic lavas are classed as ‘basic’. They have a composition typically around 49% SiO2, 16% Al2O3, 11% Fe2O3+FeO, 7% MgO and 10% CaO and the mineralogy is dominated by plagioclase feldspar, pyroxene and olivine. At depth, the upper mantle rocks are classed as ultrabasic. The upper mantle is much more magnesium rich and aluminium depleted (about 43% SiO2, 5% Al2O3, 13% Fe2O3+FeO, 23% MgO and 11% CaO) and the mineralogy is dominated by pyroxene and olivine with little or no feldspar.
Ophiolites have often been modified due to reactions involving hydrothermal activity during circulation of sea-water through the newly formed hot oceanic crust and during subsequent tectonic displacement. This hydrothermal activity typically leads to the mobilization of transition metals and sulphur. During ascent to the ocean floor, the transition metal- and sulphur-laden waters deposit massive sulphide ores within the upper parts of the ophiolite, while at the ocean floor, precipitation of the iron and manganese rich sediments occurs in features such as ‘black smokers’ (Wilson, 1989). In addition, parts of the ultrabasic rocks
become hydrated and this leads to the formation of lower density serpentinised areas that enhances uplift.
Secondary mineralisation can affect the whole of the ophiolite sequence. This mineralisation occurs during ocean floor evolution, during obduction and at the surface of the Earth. Thus, for example, the serpentinisation process, which can completely alter the ultrabasic rocks, takes place over a range of temperatures from several hundred degrees to those encountered at the Earth’s surface (Barnes and O’Neil, 1971; Barnes et al., 1967, 1972, 1978; Wenner and Taylor, 1971, 1973). Indeed, the low temperature serpentinisation reactions can produce spring waters of a remarkable hyperalkaline character. These hyperalkaline waters are calcium hydroxide bearing with a typical pH range of 10 to 12 (Barnes et al., 1978; Neal and Stanger, 1984, 1985; Stanger, 1986). Indeed, precipitates of magnesium and calcium hydroxides can be found within hyperalkaline spring chambers (Neal and Stanger, 1984). In addition, they can also be highly reducing. For example, the waters can be sulphide bearing and they can discharge hydrogen gas (Neal and Stanger, 1985).
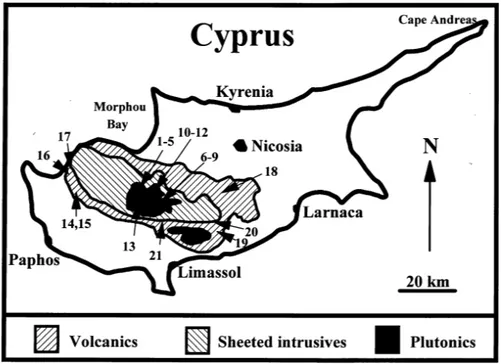
Location
Cyprus lies in the north-eastern corner of the Mediterranean Sea, about 75 km south of Turkey and about 100 km west of Syria; Egypt is about 400 km to the south. The island of Cyprus is about 100 km north–south by 230 km east–west (Fig. 1). Topographically and geologically, Cyprus can be divided into three regions (Gass and Masson-Smith, 1963): 1. The Kyrenia Range. This is a long narrow range to the north and north-east of the island with width typically 5 km and altitude up to about 910 m above sea level. It parallels and hugs the northern coast in an east-west direction from Morphu Bay to Cape Andréas. It comprises thrust slices of Permian to Cretaceous limestone flanked by flysch deposits of Oligocene to Middle Miocene age.
2. The Troodos Massif. This area comprises a large proportion of the mid- to south- eastern side of the island, a flattened oval, elongate in an east-west plane. The range is between 25 and 35 km wide with, at Mount Olympus, a maximum height of about 1940 m above sea level. It comprises a full ophiolite sequence forming a ‘dome like’ structure, the deeper ultrabasic core cropping out in the centre of the massif. The ophiolite suite is highly altered (details of the geology are provided by Wilson and Ingram, 1984). Partly surrounding the ophiolite massif are foothills of Cretaceous to Miocene age chalks.
3. The Mesaoria Plain. This plain extends east-west between the Kyrenia and Troodos ranges and is composed of Pliocene, Pleistocene and recent sediments. The elevation is typically less than 300 m a.s.l.
The climate is typical Mediterranean with summers that are hot and dry (July/August, 20 to 36oC) and a cool rainy season
that extends from October to March (6 to 18oC). The climate
varies across the island in relation to the relief. Thus, for example, the annual rainfall is about 500 mm for the Kyrenia Range, between 1000 mm (at higher altitudes) and 500 mm (at lower altitudes) for the Troodos and 350 mm for the Mesaoria Plain. There is also a strong temperature gradient with altitude and, during the winter, there may be snow cover on the higher parts of the Troodos. Population density is relatively low outside the main towns of the coastal plain and the capital (Nicosia), at around 40 people per square kilometre. Approximately 17% of the land is under cultivation (potatoes, grapes, citrus fruits, olives, etc.) and light industry is becoming of increasing importance in the lowland areas. The mining of copper, asbestos, iron pyrite and chromite in the Troodos is of declining importance. For the mountainous areas, the soils tend to be peaty but shallow and stony soils on the slopes and forested areas are common (pine, cypress and cedar).
Sampling, chemical analysis and
thermodynamic treatment
Streams, springs and borehole waters were sampled from 21 sites within the Troodos ophiolite area in mid-May 1985. These sites represent the major waters of the area as assessed previously by the Geological Survey of Cyprus (Pantazis, 1978). The sites were chosen and samplings undertaken with the help of Evangelos Makredes of the Geological Survey of Cyprus and advice from some of his colleagues. The sample locations are shown in Fig. 1 and site comments are provided in Table 1. In the field, samples were filtered through 0.45 µM membrane filters and then stored for chemical analysis in glass and polypropylene bottles depending upon the type of analysis. pH was determined electrochemically in the field, using a combination electrode, at the time of sample collection, with minimum contact of the water sample with the atmosphere (to avoid equilibration with atmospheric carbon dioxide). On immediate return from the field, alkalinity was determined by acidimetric titration to a pH of about 4.0 and was calculated using the method of Neal (1988); reduced sulphur was also determined using an ion selective electrode. In the case of alkalinity and reduced sulphur, the samples collected were stored in filled bottles and the analyses were undertaken rapidly: in the former case, this ensured minimal equilibration with atmospheric carbon dioxide; in the latter case, it minimised both hydrogen sulphide degassing and atmospheric oxygen contamination. Fig. 1. Map of Cyprus outlining the ophiolite area and the sites sampled.
Table 1. Site comments
Site Comment
1 Kalopanayiotis (Stomachiko) Spring1 from metal pipes
2 Thioucho A Spring 2
3 Thioucho B Spring 3 metal pipes 4 Psamiako (metal pipes) Spring 4 metal pipes
5 Kalopanayiotis Water from small seepage in gabbro
6 Chrysoursi spring Spring in serpentinite: highly smashed serpentine next to gabbro 7 Ali Tsiaousis Stream near asbestos mine: completely serpentinised rock. 8 Asbestos mine Spring water, Amiadon Dam, completely serpentinised rock. 9 Asbestos mine Stream water
10 Kannouris Water leaving chromite mine dunite and hartzburgite. 11 Kannouris Stream draining hartzburgite
12 Kannouris Stream draining serpentinite/hartzburgite 13 Hardji spring Spring
14 Sarama cold spring Spring in serpentinised olivine gabbro: Mamonia complex 15 Sarama hot spring Spring in Mamonia complex
16 Argaka Artesian borehole in diabase 17 Axia Varvara spring Spring in diabase along fault
18 Ziziros Mixture of springs of low and high chloride content: salt deposits and gas. Pillow lavas
19 Parsata Spring in pillow lavas
20 Layia Artesian borehole in pillow lavas
21 Ayaimamas borehole Artesian borehole in highly weathered ultrabasic lavas
Samples were returned to the UK for further chemical analysis (Neal et al., 1992 for information on analytical methodologies). This analysis comprised colorimetric methods for the major anions, bromide and total iodine (mainly iodide plus iodate). Analysis of the major cations, the trace metals and boron was undertaken by inductively coupled plasma optical emission spectroscopy. In the case of the metals, samples were stored in polypropylene bottles cleaned by pre-washing in 5% v/v analar grade hydrochloric acid followed by high purity water and the samples were preserved in 1% v/v high purity, aristar grade, nitric acid. For the anion determinations, samples were stored in high purity water-cleaned glass bottles prior to analysis.
For the analysis of the data, carbon dioxide partial pressures and mineral saturation levels were determined using the following methods and rationale.
Dissolved carbon dioxide. The level of carbon dioxide in surface and groundwater is linked to several key factors: 1. The supplies of atmospheric- and biologically-derived
sources of carbon dioxide to the groundwater area and the stream channel.
2. Weathering processes within the soil and groundwater, which affect the pH levels and the distribution of hydroxyl ions and dissolved inorganic carbon species (CO20, HCO
3–1 and CO3–2).
3. The input of carbon dioxide enriched water from groundwater and soil water sources to the stream. 4. Photosynthesis during the day from plants: this reduces
dissolved carbon dioxide levels within streams. 5. Respiration by plants during the night and microbial
breakdown of organic matter during the day and night; this increases carbon dioxide levels in streams. 6. Gaseous transfer of carbon dioxide between the water
body and the atmosphere; this can increase or decrease the dissolved carbon dioxide levels dependent upon the degree of carbon dioxide saturation in the water. 7. External inputs of CO2 from depth related to
metamorphic reactions or mantle degassing (Shand et al., 1995).
The level of carbon dioxide saturation thus provides a clue to the importance of each of these processes. The degree of carbon dioxide saturation (EpCO2) has been measured according to a thermodynamically based method developed
by Neal et al. (1998a) using pH, calcium and alkalinity data to allow for bicarbonate, carbonate, calcium-carbonate and calcium-bicarbonate species as well as hydroxyl. EpCO2 is defined as the dissolved carbon dioxide concentration in a water sample divided by the dissolved carbon dioxide concentration in pure water in equilibrium with the atmosphere at the same temperature and pressure (Neal et
al., 1998a). Thus, values of EpCO2 of 0.1, 1 and 10 represent
a tenth saturation, equilibrium (i.e. saturation), and ten times saturation with respect to atmospheric concentrations, respectively.
Mineral saturation levels. The potential for solubility controls to be operative is assessed here by examining the degree of saturation as calculated in terms of a saturation index. For example, one potential control on calcium levels in the ophiolites is calcium carbonate solubility. For equilibrium with respect to this phase, the activity product for calcium and carbonate ions ({Ca2+}*{CO
32-}) is a
constant at any given temperature and pressure: the ‘{}’ brackets represent activity rather than concentration. This activity product is defined by an equilibrium constant KCaCO3 that varies as a function of temperature, pressure and ionic strength. Several different forms of calcium carbonate occur in nature and each has a separate thermodynamic solubility constant (KCaCO3), the values of which are well established in the literature. The saturation index is provided in logarithmic form, and, in the case of calcium carbonate, SICaCO3, is defined by
SICaCO3 = log10({Ca2+}*{CO
32-}) – log10(KCaCO3).
For this expression, a SICaCO3 value of zero corresponds to saturation, while values of +1 and –1 correspond to ten times and one-tenth saturation respectively. For other mineral components, the same approach is used although the activity product will differ in form according to the specific reaction. For example, for magnesium hydroxide, which usually precipitates as microcrystalline brucite in hyperalkaline waters, the activity coefficient is defined from the equation
Mg(OH)2< > Mg2+ +2(OH-)
by {Mg2+}*{OH–}2 where
SImicro crystalline brucite = log10({Mg2+}*{OH–}2) –
log10(Kmicro crystalline brucite). For this study, the PHREEQC thermodynamic model was used to calculate the saturation indices (Parkhurst, 1995).
Occasionally, the saturation indices could not be assessed directly because some of the determinands used for the calculation had values less than the lowest quotable value. In such cases, saturation indices have been calculated using values set at half of the lowest quotable value to compare with the information where the lowest quotable value is not an issue. The data are presented in tabular form in a later section. For the cases where lowest quotable values are an issue, the information is provided in the tables in italics and is explained in the table headings. The lowest quotable value is twice the detection limit. Since the only determinands of concern in this regard are aluminium and magnesium, which, in essence, have terms in the numerator of the saturation equations, then the estimates represent an upper bound to the degree of saturation.
Results
The findings are described by a progressive analysis of the data involving four aspects. Firstly, the general water quality variations are discussed within a typology setting of waters with distinct hydrogeochemical character. Secondly, the variation in carbon dioxide saturation is examined to assess the extent of carbon dioxide equilibrium with the atmosphere and inorganic carbon attenuation within the rock. Thirdly, the inter-relationships between the various determinands are presented to provide key information on how the water quality varies from surface-runoff to spring-water supplies and to determine within-rock hydrogeochemical signatures. Fourthly, the degree to which the waters are saturated with respect to particular mineral phases is assessed to examine the potential for solution or precipitation of key mineral components within the system. These aspects are considered separately below.
GENERAL WATER QUALITY VARIATIONS
The waters collected from the ophiolite areas (Table 1) comprise a wide range of water qualities (Table 2). All the waters are moderate- to hyper- alkaline (pH from 7.9 to 11.6), of moderate to high alkalinity (813 to 9433 µEq l–1)
and the temperatures are around 22oC. The waters exhibit a
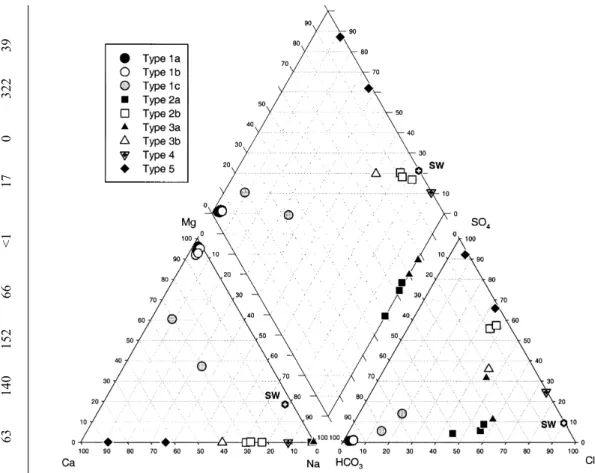
wide range in major cation, major anion and trace element concentrations. Broadly, they fit into five Types with some sub-groupings and are displayed on a PIPER diagram (Fig. 2). The water types are as follows.
Magnesium bicarbonate: Type 1
Dilute waters with respect to sodium, chloride, calcium and sulphate represent this type. The main cation is magnesium and the main anion bicarbonate: their concentrations are at
Table 2.
The water quality of Cyprus waters associated with the ophiolitic areas. T
race elements less than 1µg/l: Cd, Co, Cu, La, Mn, M
o, Ni, Pb, Sc, V
, Y
, Zn, Zr
.
Concentrations are on an elemental basis except SO
4
(mg-SO
4
/l), alkalinity (µEq/l) and pH (dimensionless). At the bottom of the table, an analysis from our laboratories
is also presented for a hyperalkaline spring water in Bosnia, “Bos”, (cf Derkovic, 1973) for comparison. Site
Na K C a M g C l SO 4 S 2-Si Alk pH EpCO 2 Al Ba B B r C r I Li Sr F e mg/l mg/l mg/l mg/l mg/l mg/l mg/l mg/l µEq/l Atmos µg/l µg/l µg/l µg/l µg/l µg/l µg/l µg/l µg/l T YPE 1 A : M g-HCO 3 10 3.29 0.19 3.45 55.3 7 2.17 0 14.0 6050 8.5 4.05 < 5 1 41 24 3 3 0 11 <0.5 11 4.06 0.18 4.42 72.6 8 2.46 0 19.5 5378 7.9 13.06 < 5 2 31 22 < 1 2 0 15 <0.5 12 4.73 0.24 3.30 112.0 9 3.06 0 7.5 9433 8.6 4.38 < 5 2 19 29 < 1 5 0 12 <0.5 T YPE 1 B : M g-HCO 3 WITH C R 6 4.68 0.30 1.99 70.7 9 3.64 0 1.15 5698 9.1 0.89 7 1 53 30 19 3 0 5 <0.5 7 4.40 0.24 1.47 65.1 8 2.71 0 0.30 5263 9.8 0.10 6 3 106 32 25 5 0 5 2 8 3.96 0.21 5.10 59.7 8 2.08 0 12.5 51 11 8.4 4.34 5 1 74 27 13 4 0 13 2 9 5.16 0.23 3.99 67.9 9 2.89 0 5.3 5656 8.4 3.88 < 5 4 160 28 14 6 0 11 <0.5 T YPE 1 C : M g-HCO 3 WITH N A -C L 5 52.0 1.47 41.1 31.3 45 45.9 0 14.0 4578 8.7 1.67 15 1 85 105 < 1 12 16 36 5 13 12.0 0.89 37.5 45.0 28 14.8 0 5.5 4506 9.5 0.21 < 5 <0.5 15 70 37 5 0 108 <0.5 T YPE 2 A : N a-C l-HCO 3 1 173 5.34 0.92 0.2 170 23.5 1 12.0 3259 9.7 0.09 17 <0.5 529 440 < 1 107 11 3 2 4 2 178 5.41 0.95 0.1 170 22.0 2 12.5 5383 9.7 0.16 15 <0.5 538 460 < 1 105 11 4 2 <0.5 21 146 0.24 1.88 0.1 140 29.8 1 10.5 2475 9.5 0.13 < 5 <0.5 580 380 < 1 63 0 7 <0.5 T YPE 2 B : N a-SO 4 -C L 15 137 0.39 49.6 0.0 11 6 249 0 14.0 813 9.9 0.01 < 5 <0.5 1032 410 < 1 31 0 27 <0.5 14 142 7.19 47.9 0.2 11 6 249 0 14.0 835 9.6 0.03 53 2 1023 400 < 1 25 0 28 8 17 173 0.78 43.9 0.1 130 273 1 11.0 537 9.6 0.02 17 <0.5 1731 430 < 1 19 0 41 4 T YPE 3 A : N a-C l-SO 4 -OH-CO 3 3 385 14.9 0.81 0.1 420 393 11 24.0 5856 11.6 0.00 279 <0.5 1108 1050 < 1 275 1083 1 <0.5 4 385 15.3 0.79 0.6 420 109 11 24.5 6063 11.4 0.00 275 <0.5 1092 1050 < 1 270 36 1 1 T YPE 3 B : Na -C a-C l-S O4 -OH 19 163 1.23 93.1 0.0 190 207 2 3.4 2333 11.2 0.00 155 <0.5 1450 720 < 1 240 0 110 56
T YPE 4 : Na -C l-S O4 18 5800 24.9 646 1.2 7800 3490 0 9.0 1141 9.0 0.21 < 5 <0.5 6030 18000 < 1 2100 14830 258 <0.5 T YPE 5: C a-Na-SO 4 16 156 0.82 1037 1.0 130 2501 0 12.0 712 9.0 0.13 < 5 <0.5 1647 420 < 1 19 0 41 13 20 302 0.67 461 0.1 400 1100 0 9.5 590 9.6 0.02 42 <0.5 395 1300 < 1 79 0 136 18 H YPERALKALINE SPRING W A TER FROM B OSNIA Bos 33 1.16 98.0 1.1 18 0.7 NA 2.4 5620 11.8 <0.1 63 140 152 66 < 1 17 0 322 39
their highest for the Type 1 waters relative to the other waters monitored across the sampling sites (Table 3). Although bicarbonate is not measured directly, the high alkalinity listed in Table 2 is primarily as bicarbonate since the pH is too low for carbonate to dominate. The Type 1 waters can be subdivided into three groups:
z Mg-HCO3: 1a. For this sub-group, over 90% of the
cation charge is from magnesium and a similar proportion of the anion charge is associated with bicarbonate alkalinity. pH is in the range 7.9 to 8.6. Silicon concentrations vary between 7 and 20 mg-Si l-1.
z Mg-HCO3-Cr: 1b. This group is very similar to 1a
although the waters are also chromium bearing (13–25 µg l–1). pH shows a higher range from 1a (8.4 to 9.8).
Silicon concentrations are typically lower than for 1a (range 0.3 to 12.5 mg-Si l–1) and silicon concentrations
decrease as pH increases.
z Mg-HCO3 with Na-Ca-Cl-SO4: 1c. The remaining group
in this category still has magnesium and bicarbonate as the dominant ions in solution although magnesium concentrations are lower than for 1a and 1b. However, there are increased concentrations of other major cations (Na, K and Ca) and anions (Cl and SO4) as well as the Fig. 2. PIPER plot showing the relative proportions of major cations and anions.
Table 3. A summary of the charge proportions for the main anions and cations in relation to the five main water types sampled for the ophiolites of Cyprus. Ratios of Na:Cl and Ca:SO4 are also provided, these ratios are on µEq l–1: µEq l–1 basis.
1a 1b 1c 2a 2b 3a 3b 4 5 Na % 2.5 3.4 21.3 97.7 72.9 97.4 60.0 88.4 21.0 K % 0.1 0.1 0.5 1.3 0.8 2.3 0.3 0.2 0.0 Ca % 2.7 2.7 30.1 0.9 26.2 0.2 39.4 11.3 78.9 Mg % 94.7 93.8 48.1 0.2 0.1 0.1 0.4 0.0 0.1 Cl % 3.1 4.2 16.6 51.6 35.9 51.4 44.7 74.9 16.4 SO4 % 0.7 1.0 10.2 6.0 56.4 22.7 35.9 24.7 82.1 HCO3/CO3 % 96.1 94.4 72.9 41.9 7.2 12.4 7.7 0.4 1.4 OH % 0.03 0.4 0.3 0.5 0.5 13.5 11.8 0.0 0.0 Cations Na/Cl 0.78 0.83 1.35 1.60 1.92 1.41 1.32 1.15 1.33 Anions Ca/SO4 3.49 2.66 3.11 0.12 0.44 0.01 1.08 0.44 1.00
trace element strontium. The enrichment in these components is typically by a factor of about four.
Na-enriched waters with either Cl-HCO3 or SO4-Cl as
balancing anions: Type 2
For this group, sodium concentrations range from 137 to 178 mg l–1, over 30 times higher than in the 1a and 1b waters
and over three times higher than in 1c. For Type 2 waters, boron, bromide and total iodine are up to about an order of magnitude higher than in Type 1 waters. Magnesium concentrations, in contrast, are low and often close to the detection limit. This group can be divided into two clear units:
z Na-Cl-HCO3: 2a. For this group, over 95% of the
cationic charge is associated with sodium and an approximately equal proportion of bicarbonate and chloride represents the balancing anions.
z Na-SO4-Cl: 2b. For this group, sodium contributes over
70% of the cationic charge with calcium, at a concentration of about 47 mg l–1, making up most of
the remainder. For this group, sulphate provides the dominant anionic charge with a concentration of about 250 mg-SO4 l–1 followed by chloride. For this group,
calcium and sulphate concentrations are about 40 and 10 times higher, respectively, than for 2a.
Hyperalkaline waters: Type 3
These waters have very high pH (11.2 to 11.6), at least one unit higher than all the others sampled, and they have very
low magnesium concentrations (near and in some cases below the detection limit). They are enriched in bromide and total iodine even relative to 2b. The boron levels are also high at around 1000 µg l–1 — about the same as 2b.
They fall into two subgroups:
z Na-Cl-SO4-OH-CO3: 3a. These waters not only have a
higher pH than the other waters, but they are also further enriched in sodium and chloride by a factor of about two over Type 2 and up to almost an order of magnitude enrichment compared to Type 1. Sodium represents over 95% of the cationic charge, while the major balancing cation is chloride (about 50% of the charge) followed by sulphate or alkalinity. The waters are also rich in lithium (36 to 1083 µg l-1) and reduced sulphur (11
mg-S l–1). Silica concentrations are relatively high compared
with all the other types of water, at about 24 mg-Si l–1.
z Na-Ca-Cl-SO4-OH: 3b. There is only one water sample
for this group. It is similar to the Type 3a waters except that (a) the sodium and chloride concentrations are about a half and (b) the calcium and strontium concentrations are considerably higher (93 compared to <1 mg l–1 for
calcium; 110 compared to 1 µg l–1 for strontium).
Compared with all but two of the other types of water, the silica concentration is relatively low at 3.5 mg-Si l–1
and this concentration is only a seventh that of 3a. Na-Cl-SO4: Type 4
Type 4 water has particularly high concentrations of sodium, chloride and sulphate: it is represented at one site only.
Sodium makes up almost 90% of the cationic charge while chloride and sulphate make up about three quarters and one quarter, respectively, of the anionic charge. The brine is about 40% of the strength of sea-water with respect to chloride (Table 4). Relative to the other water types, it is also enriched in potassium, boron, bromide, total iodine lithium and strontium, typically by an order of magnitude or more. The pH is 9.
In terms of element enrichment and depletion, Table 4 compares the spring water and sea-water data normalised to chloride, under the assumption that chloride is relatively conservative within the water at the salinity of the spring water. This approach indicates that calcium, sulphate and boron are moderately enriched by a factor of 3 to 4, and total iodine is considerably enriched (81 times) relative to sea-water. Smaller changes are observed for sodium and bromide: sodium is moderately enriched and bromide is moderately depleted, both by about a third, relative to sea-water. Potassium, magnesium, lithium and strontium are considerably depleted (by a factor of five to orders of magnitude depending upon the particular element). The reasons for the enrichment and depletion of elements are discussed later.
Ca-Na-SO4: Type 5
Type 5 waters come from boreholes and they have high concentrations (relative to all except the Type 4 water) of calcium (the major cation with about 80% of the cationic charge) and sodium (which makes up most of the remainder) while sulphate provides most of the anionic charge (about 80%, with chloride making up most of the remainder). The waters have a pH between 9.0 and 9.5.
EPCO2
The levels of dissolved carbon dioxide vary from about thirteen times to less than a hundredth saturation with respect
to the atmosphere (Table 2). The waters subdivide into two groups.
1. The Type 1 waters. This group shows carbon dioxide saturation in the range 13 to a tenth saturation. Oversaturation to moderate undersaturation occurs for many surface waters that are relatively unpolluted (biological processes linked to photosynthesis and respiration modifying the degree of saturation). The Type 1 grouping reflects surface waters and spring waters with near surface sources.
2. The Type 2 to 5 waters. These waters show moderate to high degrees of carbon dioxide undersaturation (20% to less than 1% saturation). Such low saturations can occur within surface waters but only when photosynthesis is particularly high (Neal et al., 1998b). Since the waters are primarily groundwater in origin, photosynthetic activity cannot explain the very low levels encountered. Furthermore, due to biological breakdown of organic carbon in the soil and the aquifer or to degassing of carbon dioxide from greater depths (Appelo and Postma, 1993; Drever, 1997), many groundwaters are oversaturated with respect to carbon dioxide, often by one or two orders of magnitude. The very low levels encountered means that carbon dioxide from surface sources must be consumed within the rock.
DETERMINAND INTER-RELATIONSHIPS
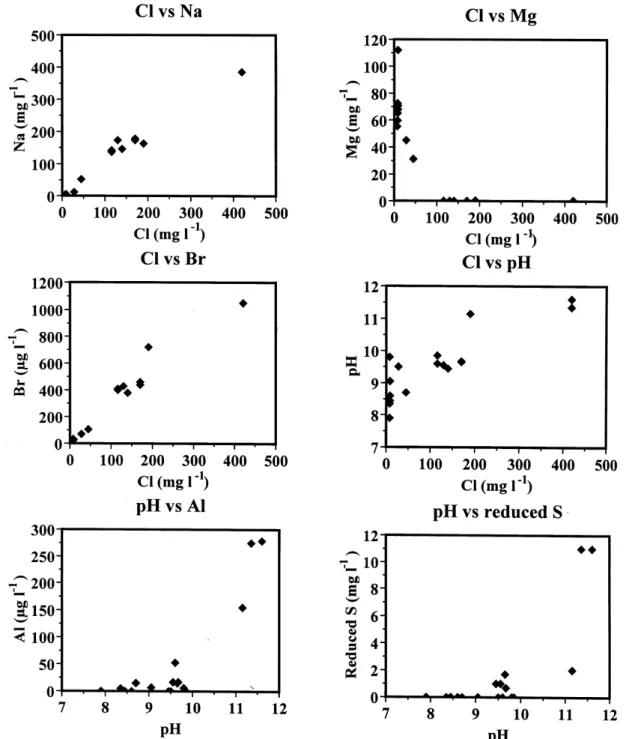
Statistical analysis was undertaken using correlation matrix and factor analysis and this was backed up with visual inspection of graphed data where the determinands were plotted against each other (Fig. 3) and against Cl (Fig. 4). This analysis was undertaken:
1. To describe and explore the relationships between the various determinands.
Table 4. The concentration of major and trace elements in site 18 spring water with respect to sea-water (Rsp/SW) and the ratio of major and trace elements to chloride in site 18 spring water relative to the corresponding ratio in sea-water (Rel:Cl-sp/Rel:Cl-SW).
Element Rsp/SW Rel:Cl-sp/Rel:Cl-SW Element Rsp/SW Rel:Cl-sp/Rel:Cl-SW
Na 0.54 1.34 B 1.34 3.32 K 0.06 0.15 Br 0.27 0.67 Ca 1.57 3.89 I 32.81 81.40 Mg 0.00 0.00 Li 0.09 0.22 SO4 1.29 3.19 Sr 0.03 0.08 Cl 0.40 1.00
2. To see if the groupings identified qualitatively earlier in the paper could also be characterised within a more rigorous statistical framework.
Correlation statistics
The analysis was subdivided into two parts. Firstly, the dataset was examined as a whole to describe the general behaviour. Secondly, only type 1, 2 and 3 waters were
Fig. 3. Inter-determinand plots for Type 1, 2 and 3 water groupings
examined as the type 4 and 5 waters represent a very limited number of samples with abnormally high concentrations of ions such as sodium, calcium, chloride and sulphate: inclusion of these values would otherwise bias the statistical analysis. The salient points are as follows.
For the full dataset, four groupings were observed with high correlations (N=21).
1. The sea-salts (excluding Mg). High correlations were observed for Na, K, Cl, SO4, B, Br, I, Li and Sr: the
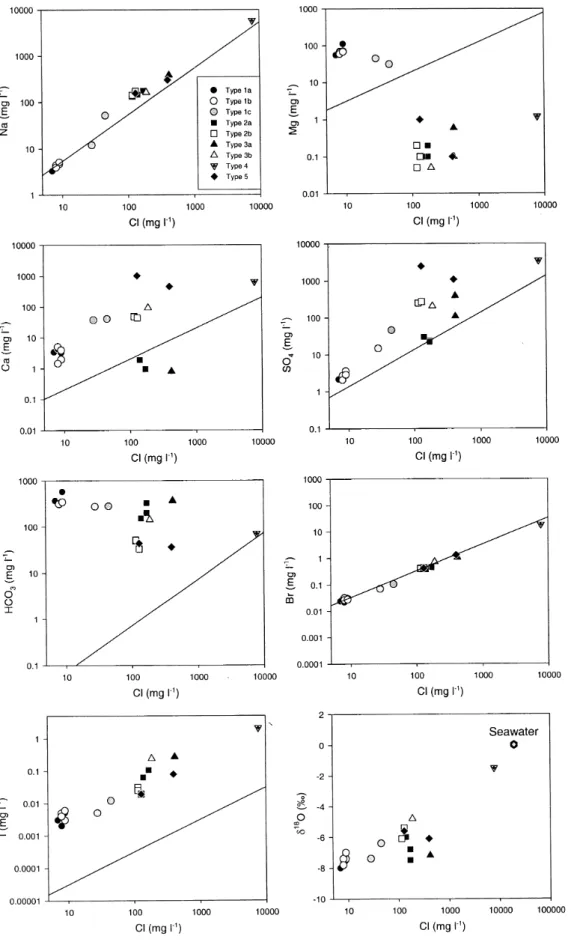
Fig. 4. Selected concentrations of major and minor elements and δ18O plotted against chloride for each of the water types described in the text. The solid line represents a sea-water dilution line.
correlation coefficient is in the range 0.77 to 0.95. This group also showed negative relationships with bicarbonate (r -0.65).
2. Calcium and sulphate. These determinands show a high rcorrelation coefficient of 0.90.
3. Mg, alkalinity, EpCO2, HCO3 and Ba. For this group,
correlations are in the range 0.70 to 0.91.
4. pH, CO3, OH, Al and reduced-S. For this group, the
correlations are in the range 0.73 to 0.84.
For the Type 1 to 3 subset (N =18), very similar groupings to the full dataset are observed although (a) the patterns are in most cases stronger, (b) the list of determinands is greater and (c) groupings 1 and 4 with the full dataset combine to form a single group. In detail, the correlations are
1. The sea-salts (excluding Mg) plus Si, Al, pH, CO3, OH,
Al and reduced-S. High correlations (r = 0.77 to 0.99) occur for the same determinands as with the full dataset except that the correlation with lithium is slightly lower (r 0.60) and the correlation with strontium is lost. Relative to the full dataset, this group is augmented by Si, Al, pH and reduced-S and these components are negatively correlated with Mg (r -0.79) and HCO3 (r -0.84).
2. Ca and Sr. Calcium and Sr are strongly related (r = 0.82) and to a lesser degree by B (r 0.54) and SO4 (r 0.47). This group is negatively correlated with alkalinity (r -0.64).
3. Mg, alkalinity, EpCO2, HCO3 and Ba. This is the same
grouping as for the full dataset with correlation coefficients in the range 0.67 to 0.90. This group is negatively correlated with many determinands in the sea-salt group (Na, Cl, SO4, B and Br, (r = 0.67 to -0.79) as well as pH (r -0.68).
Factor analysis
As with the correlation study, the factor analysis is undertaken on the full dataset and the Type 1 to 3 subsets. For the full dataset, four factors explain 88% of the variance:
z Factor 1. This is represented by the sea-salt components (excluding Mg): Na, K, Cl, SO4, B, Br, I, Li and Sr, and 41% of the variance is explained. For this group, there is a negative relationship between the sea-salt components and Mg, alkalinity, HCO3 and Ba. z Factor 2. Mg and HCO3 represent this, with a negative
relationship for pH, CO3, OH and reduced-S and 26% of the variance is explained.
z Factor 3. This is represented by alkalinity and 14% of the variance is explained.
z Factor 4. Chromium represents this and 7% of the variance is explained.
For the Type 1 to 3 components, three factors explain 82% of the variance:
z Factor 1. This is represented by the sea-salt components (excluding Mg): Na, K, Cl, SO4, B, Br, I, Li and Sr, augmented by pH, CO3, OH, Al, and reduced-S. These components are negatively related to Mg and HCO3. This factor explains 55% of the variance.
z Factor 2. This is represented by alkalinity and is negatively related to Ca and Sr. This factor accounts for 19% of the variance.
z Factor 3. Chromium represents this and 8% of the variance is explained.
Plotted data
A visual analysis of determinand plots shows clear correlations between the sea-salt components, including Mg, although, as in the previous case, the Type 4 and 5 components provide outlier points. Considering the Type 1 to 3 data (Fig. 3), three features emerge.
1. The patterns for the sea-salts, excluding Mg, are linear and positive. There is also a positive and linear, but scattered relationship between the sea-salt components (except Mg) and pH.
2. Mg exhibits an inverse relationship with the other sea-salts and with pH.
3. There is a positive and curvilinear relationship for pH with Al and reduced-S: the relationship is exponential. Table 5 provides a statistical analysis of determinand relationships with chloride.
Summary
The statistical and graphical analysis (Figs. 3 and 4) shows that the waters split broadly into the groupings outlined at the start of the results section. The analysis also shows that there are linear or curvilinear relationships between particular determinands.
Broadly, the results show the following patterns. 1. Surface waters are of a dilute magnesium bicarbonate
type.
2. Within the rock, the waters lose their magnesium component and in the process pick up sea-salt components (other than Mg). In the process, pH, OH, ~~ ~~ ~~ ~~ ~~ ~~ ~~ ~~
CO3, Al and reduced-S increases while bicarbonate decreases.
3. As salinity increases further, to the level of brines, sodium-chloride and calcium-sulphate waters are generated that do not have the high pH, OH, CO3, Al and reduced-S character of the intermediate salinity group.
MINERAL SATURATION LEVELS
The salient information on the saturation index, for the waters studied, is presented in Tables 6, 7 and 8 as a series of specific mineral groupings linked to primary minerals in the rock and secondary weathering products. The details of the tables are as follows
z The primary Mg-Al-silicate minerals and zeolites (Table 6). This table provides information on the
primary minerals within the various rocks of the area and zeolites that occur as secondary minerals within the lavas. The primary minerals considered are the two end-members of the plagioclase feldspars, albite (NaAlSi3O8) and anorthite (CaAl2Si2O8), analcime (NaAlSi2O6:H2O), the pyroxenes clinoenstatite (MgSiO3) and diopside (CaMgSi2O6), and the olivine
forsterite (Mg2SiO4). The zeolites included are laumontite (CaAl2Si4O12:4H2O) and phillipsite (Ca2Al2Si3O10(OH)2; prehnite (Ca2Al2Si3O10(OH)2) is also included.
z Secondary calcium sulphate, carbonate minerals and oxides/hydroxides (Table 7). This table provides
information on (a) the calcium sulphate minerals anhydrite (CaSO4) and gypsum (CaSO4:2H2O), (b) the carbonate minerals aragonite (CaCO3), calcite (CaCO3), dolomite (CaMg(CO3)2), magnesite (MgCO3), huntite (CaMg3(CO3)4) and strontianite (SrCO3) and (c) the oxides/hydroxides brucite (Mg(OH)2), gibbsite (Al(OH)3) and quartz (SiO2).
z Secondary magnesium and aluminium bearing silicate minerals (Table 8). This group comprises
chrysotile (Mg3Si2O5(OH)4), 14Å-chlorite (Mg5Al2Si3 O10(OH)8), Illite (K0.6Mg0.25Al2.3Si3.5O10(OH)2), Ca-Montmorillonite (Ca0.165Al2.33Si3.67O10(OH)2), kaolinite (Al2Si2O5(OH)4), sepiolite (Mg2Si3O7.5OH:3H2O), talc (Mg3Si4O10(OH)2) and pyrophyllite (Ca2Al2Si3O10 (OH)2)
The salient features for the main mineral groupings are as follows.
Primary Mg-Al-silicate minerals
In most cases, the waters are undersaturated with respect to the primary Mg-Al-silicate minerals although for the hyperalkaline waters, the waters approach saturation or exceed it in the case of forsterite and, in particular, clinoenstatite: for the more calcic waters, oversaturation with respect to diopside is observed. Thus, in general,
z The waters have the potential to dissolve the feldspars, pyroxenes and olivines except under hyperalkaline conditions.
z Under hyperalkaline conditions, the waters have the potential to dissolve feldspars but they are in approximate balance for clinoenstatite and forsterite. z Diopside is close to saturation in the waters of high
calcium concentration. Zeolites
For the zeolites, the waters are primarily undersaturated with a few exceptions and typically there is the potential for mineral solution. The possible exceptions are the more calcic waters of Types 1c and 2b when the waters are not hyperalkaline but aluminium concentrations are significant: while the extent of zeolites saturation increases with trivalent aluminium concentration, all other things being equal, the Table 5. Linear regression analysis for the chemical
determinands and chloride in Cyprus ophiolite waters: types 1 to 4. N=18. Grad Constant r2 Na 0.937 ± 0.069 5 ± 37 0.979 Br 2.58 ± 0.25 31 ± 134 0.964 I 0.681 ± 0.139 -10 ± 75 0.856 S 0.025 ± 0.005 -1.2 ± 2.8 0.849 K 0.034 ± 0.008 -1 ± 4 0.812 Al 0.629 ± 0.152 -23 ± 82 0.811 pH 0.007 ± 0.002 8.70 ± 1.05 0.764 OH 6.98 ± 2.11 -331 ± 1136 0.733 Li 1.58 ± 0.62 -82 ± 335 0.617 Mg -0.197 ± 0.098 54 ± 53 0.503 B 2.95 ± 1.57 208 ± 846 0.469 Si 0.0375 ± 0.0207 7 ± 11 0.451 SO4 0.606 ± 0.367 23 ± 198 0.405 Ba -0.005 ± 0.004 1.5 ± 2.0 0.325 Cr -0.037 ± 0.038 10 ± 21 0.190 Fe 0.014 ± 0.050 3 ± 27 0.022 Sr -0.0000 ± 0.0001 0.027 ± 0.068 0.012 Ca -0.028 ± 0.126 27 ± 68 0.012
Table 6. Saturation indices for primary Mg/Al-silicates and zeolites in surface and groundwaters of the Cyprus ophiolitic areas. The terms in italics represent upper limits of values of saturation indices values where there are issues of lowest quotable value: these saturations are provided for illustrative purposes only.
Primary Mg/Al-silicates Zeolites
Albite Anorthite Analcime Clinoenstat Diopside Forsterite Laumontite Phillipsite Prehnite
TYPE 1A: Mg-HCO3
10 -4.98 -9.78 -7.02 -0.74 -0.07 -3.85 -4.96 -4.04 -8.50
11 -4.43 -9.36 -6.63 -1.56 -1.71 -5.65 -4.23 -3.54 -8.90
12 -5.68 -10.47 -7.44 -0.47 0.14 -3.03 -6.18 -4.76 -9.23
TYPE 1B: Mg-HCO3WITH CR
6 -5.52 -6.92 -6.43 -0.60 -0.16 -2.44 -4.37 -4.55 -5.86
7 -8.01 -8.88 -8.12 0.00 0.90 -0.44 -7.93 -7.07 -7.36
8 -5.58 -6.65 -6.54 -1.98 -2.41 -5.25 -3.97 -4.65 -6.44
9 -6.06 -10.57 -7.68 -1.10 -0.81 -4.14 -6.59 -5.17 -9.66
TYPE 1C: Mg-HCO3WITH NA-CL
5 -0.78 -2.67 -2.81 -0.52 1.69 -3.40 2.12 0.01 0.16 13 -6.08 -9.94 -7.57 0.66 3.83 -0.49 -6.22 -5.08 -6.16 TYPE 2A: Na-Cl-HCO3 1 -1.00 -4.83 -2.76 -1.17 0.98 -4.42 -0.56 -0.19 -2.06 2 -0.97 -4.96 -2.76 -1.35 0.72 -4.82 -0.64 -0.16 -2.27 21 -4.10 -10.61 -5.89 -1.66 0.44 -5.43 -6.30 -3.93 -7.89 TYPE 2B: Na-SO4-CL 15 -4.26 -1.91 -6.01 -1.29 2.95 -4.65 -5.07 -3.97 -4.43 14 -0.32 -3.12 -2.18 -1.18 2.67 -4.54 2.54 0.59 2.55 17 -1.00 -5.18 -2.77 -1.57 2.05 -5.24 1.16 -0.61 1.12
TYPE 3A: Na-Cl-SO4-OH-CO3
3 -3.33 -4.71 -3.81 0.65 5.20 0.49 -3.48 -2.47 -0.02
4 -2.53 -4.26 -3.28 0.48 4.78 -0.11 -2.48 -1.67 0.15
TYPE 3B: Na-Ca-Cl-SO4-OH
19 -5.10 -4.26 -5.19 -0.49 4.96 -1.39 -3.33 -4.59 1.81
TYPE 4: Na-Cl-SO4
18 -2.51 NA -4.36 -2.07 1.22 -6.31 -4.11 -2.15 -4.62
TYPE 5: Ca-NA-SO4
16 -3.78 -7.99 -5.69 -1.88 1.90 -6.03 -3.38 -3.34 -3.58
20 -0.70 -1.83 -2.38 -1.81 2.68 -5.63 2.37 -0.47 3.38
higher total aluminium concentrations in the hyperalkaline conditions is offset and counteracted by aluminium speciation changes which results in the dominance of aluminate anions under extreme high pH.
Gypsum and anhydrite
All the waters are undersaturated with respect to anhydrite
and gypsum except the highly sulphate rich ones where sulphate is the dominant anion. The sulphate rich waters (Types 4 and 5) are close to saturation with respect to both these minerals, particularly for gypsum. Thus, for Types 1 to 3, the waters have the potential to dissolve the calcium sulphate minerals and for Types 4 and 5 waters a calcium sulphate solubility control may be operative.
Table 7. Saturation indices for sulphates, carbonates and hydroxide phases in surface and groundwaters of the Cyprus ophiolitic areas. The terms in italics represent upper limits of values of saturation indices values where there are issues of lowest quotable value: these saturations are provided for illustrative purposes only.
Ca sulphates Carbonates Oxides/hydroxides
Anhydrite Gypsum Aragonite Calcite Dolomite Huntite Magnesite Strontianite Brucite Gibbsite Quartz
TYPE 1A: Mg-HCO3
10 -4.82 -4.59 -0.15 0.00 1.52 0.22 0.95 -2.02 -2.97 -3.09 0.71
11 -4.68 -4.45 -0.62 -0.47 0.59 -1.64 0.49 -2.47 -3.95 -2.55 0.86
12 -4.84 -4.61 0.07 0.22 2.29 2.10 1.51 -1.73 -2.42 -3.25 0.43
TYPE 1B: Mg-HCO3WITH Cr
6 -4.90 -4.67 0.05 0.20 2.29 2.12 1.52 -1.89 -1.70 -0.98 -0.43
7 -5.24 -5.01 0.26 0.41 2.85 3.37 1.87 -1.48 0.30 -1.79 -1.23
8 -4.66 -4.43 -0.14 0.01 1.41 -0.15 0.83 -2.11 -3.13 -0.42 -0.37
9 -4.66 -4.42 -0.13 0.01 1.58 0.36 0.99 -2.06 -2.91 -3.08 0.29
TYPE 1C: Mg-HCO3WITH Na-Cl
5 -2.44 -2.21 1.00 1.15 2.50 0.86 0.78 -1.42 -2.74 -0.30 0.69 13 -3.03 -2.80 1.49 1.63 3.70 3.49 1.50 -0.37 -1.02 -4.14 0.16 TYPE 2A: Na-Cl-HCO3-0.89 1 -4.40 -4.17 -0.09 0.06 -0.25 -5.24 -0.89 -2.05 -3.12 -1.21 0.43 2 -4.51 -4.28 0.06 0.21 -0.07 -4.97 -0.85 -1.88 -3.33 -1.25 0.46 21 -3.91 -3.68 0.03 0.18 -0.47 -6.11 -1.22 -1.74 -3.63 -4.09 0.45 TYPE 2B: Na-SO4-CL 15 -1.66 -1.43 0.87 1.02 -4.50 -8.09 -2.16 -1.76 -3.23 -1.43 0.41 14 -1.68 -1.45 0.83 0.98 -0.14 -6.72 -1.69 -1.78 -3.23 -0.65 0.52 17 -1.68 -1.45 0.55 0.69 -0.87 -8.35 -2.14 -1.86 -3.53 -1.10 0.44
TYPE 3A: Na-Cl-SO4-OH-CO3
3 -3.45 -3.22 -0.35 -0.21 -1.45 -7.99 -1.75 -2.60 -0.03 -1.95 -0.85
4 -4.05 -3.82 0.00 0.15 -0.52 -6.36 -1.25 -2.17 0.54 -1.70 -0.59
TYPE 3B: Na-Ca-Cl-SO4-OH
19 -1.54 -1.31 1.46 1.61 0.24 -6.87 -1.95 -0.82 0.23 -1.74 -1.24 TYPE 4: Na-Cl-SO4 18 -0.31 -0.09 1.10 1.24 0.07 -6.63 -1.75 -1.69 -3.23 -3.67 0.51 TYPE 5: Ca-Na-SO4 16 0.03 0.26 1.22 1.36 0.00 -7.08 -1.94 -2.57 -4.11 -3.67 0.60 20 -0.46 -0.23 1.15 1.30 -0.77 -8.24 -2.64 -1.76 -4.01 -0.79 0.35 Carbonates
A variety of patterns is observed according to both the water types involved and the chemistry of the carbonate minerals. The patterns are as follows.
z CaCO3: aragonite and calcite. The waters are close to
saturation for Types 1a, 1b, 2a and 3a, and oversaturated
for the other Types. Thus, some of the waters may have calcium carbonate solubility controls operative while most others have the potential to precipitate aragonite and calcite.
z CaMg(CO3)2: dolomite. The waters show a variable
saturation with respect to dolomite. Some waters, particularly those high in magnesium are oversaturated (Types 1a, 1b, 1c), some are approximately saturated
Table 8. Saturation indices for secondary silicates (clays and layer lattice silicates) in surface and groundwaters of the Cyprus ophiolitic areas. The terms in italics represent upper limits of values of saturation indices values where there are issues of lowest quotable value: these saturations are provided for illustrative purposes only.
Chrysotile Chlorite (14Å) Illite Kaolinite Ca-Mont Sepiolite Talc Pyrophyllite
TYPE 1A: Mg-HCO3
10 3.00 1.26 -6.48 -3.95 -6.08 2.35 7.19 -0.54
11 0.38 -2.06 -5.27 -2.55 -4.40 0.86 4.89 1.18
12 4.08 2.78 -7.54 -4.83 -7.44 2.61 7.73 -1.97
TYPE 1B: Mg-HCO3WITH Cr
6 4.54 8.45 -4.79 -1.99 -5.17 1.49 6.47 -0.85
7 7.14 11.41 -8.72 -5.22 -9.79 1.88 7.47 -5.67
8 0.35 2.56 -4.20 -0.78 -3.84 -1.22 2.39 0.47
9 2.35 0.34 -7.88 -4.78 -7.60 1.21 5.70 -0.85
TYPE 1C: Mg-HCO3WITH Na-Cl
5 3.66 7.96 0.64 1.61 0.64 2.76 7.83 5.00 13 7.76 7.29 -9.30 -7.16 -10.05 4.60 10.85 -4.87 TYPE 2A: Na-Cl-HCO3 1 1.99 3.44 -1.56 -0.75 -2.43 1.22 5.64 2.12 2 1.41 2.38 -1.62 -0.77 -2.44 0.87 5.10 2.14 21 0.50 -4.81 -9.18 -6.46 -9.07 0.25 4.18 -3.56 TYPE 2B: Na-SO4-Cl 15 1.65 -3.70 -9.79 -7.36 -9.80 0.96 5.62 -4.53 14 1.86 4.30 0.05 0.55 -0.52 1.28 5.69 3.60 17 0.77 1.62 -1.97 -0.51 -1.90 0.41 4.42 2.36
TYPE 3A: Na-Cl-SO4-OH-CO3
3 8.72 13.60 -5.57 -4.79 -8.25 3.56 9.80 -4.49
4 7.95 12.74 -4.31 -3.76 -6.79 3.50 9.57 -2.93
TYPE 3B: Na-Ca-Cl-SO4-OH
19 5.71 9.12 -7.44 -5.15 -8.98 0.91 6.01 -5.63 TYPE 4: Na-Cl-SO4 18 -0.80 -6.15 -7.30 -5.51 -7.69 -0.52 3.01 -2.49 TYPE 5: Ca-Na-SO4 16 -0.33 -5.44 -7.84 -5.38 -7.35 -0.05 3.65 -2.18 20 0.14 1.23 -1.64 -0.07 -1.35 -0.16 3.62 2.62
(Types 4 and 5) and some are saturated to undersaturated with respect to dolomite (Types 2a, 2b, 3a and 3b). Thus, for the different water types, there is the potential for solution or precipitation. In some cases, dolomite solubility controls may be operative.
z CaMg(CO3)4 and MgCO3: huntite and magnesite. The
waters show a variable saturation. The waters particularly high in magnesium are generally
oversaturated (Types 1a, 1b, 1c) while the other waters are saturated to unsaturated.
z SrCO3: strontianite. The waters are all undersaturated
with respect to this mineral. Oxides/hydroxides
undersaturation to oversaturation with respect to brucite. There is an approximate gradation from undersaturation to over saturation as pH increases and magnesium decreases in concentration. This feature coupled with the patterns shown in Fig. 4 for Mg and pH plotted against Cl, may well indicate that as pH increases, Mg is being lost from solution as brucite. However, there is no clear evidence that an equilibrium solubility control is operative.
z Al(OH)3: gibbsite. The waters are undersaturated with
respect to this phase and there is a clear potential for solubilisation.
z SiO2: quartz, chalcedony, chrystobalite and amorphous
silica. The degree of silica saturation varies according to the extent of atomic structuring of the silica minerals. The most crystalline form is quartz, intermediate crystallinity is for chalcedony and chrystobalite and the highest solubility is for amorphous silica. Only data for quartz are presented here (subtracting 0.44, 0.40 and 1.29 from the saturation index for quartz can, approximately, allow the assessment of the saturation values for chalcedony, chrystobalite and amorphous silica, respectively). There is no clear pattern to quartz saturation: the waters vary between under- and over-saturated. For chalcedony and chrystobalite, the waters are approximately saturated for the Type 1a, 2a, 2b, 4 and 5 waters and undersaturated for the other water Types. The waters are undersaturated with respect to amorphous silica.
SECONDARY Mg/Al BEARING SILICATES
The solubility of this group of minerals is very variable and, in most cases, the minerals are either consistently oversaturated or consistently undersaturated. The saturation index relationships are as follows.
z Chrysotile and sepiolite. The waters are oversaturated with respect to these minerals for Types 1 and 2 with the largest oversaturation occurring for Types 3a and 3b. For Types 4 and 5, approximate saturation is encountered.
z 14Å chlorite and talc. The waters are predominantly oversaturated with respect to these minerals. However, in the case of 14Å chlorite, large undersaturation occurs for the Type 2a, 2b, 4 and 5 waters when the aluminium concentrations are particularly low.
z Illite, kaolinite and montmorillonite. These clay types are mainly undersaturated.
Of these minerals, chrysotile, sepiolite, chlorite and talc occur within the ophiolite sequence and clearly there is the
potential for further precipitation. Illite, kaolinite and montmorillonite comprise the main clay mineral types within sedimentary rocks and soils and these phases are usually soluble.
Discussion
THE EVOLUTION OF WATER QUALITY IN THE OPHIOLITES
The water quality of surface and groundwaters associated with the Cyprus ophiolites is of an alkaline type that is very variable in terms of pH and dissolved salt content. This variability can occur even within localised areas (e.g. springs 1 to 5 are relatively close together). The stable isotopes (δ2H
and δ18O) ratios also show a range, generally becoming
heavier from Type 1 to Type 4 (Fig. 5). The isotopic ratios in precipitation show a negative correlation with elevation (Jacovides, 1979) and may partially explain the trend of δ18O with salinity within the groundwaters (Fig. 4). The
chemistry of the waters is determined by the extent and nature of the weathering/hydrolysis of the ophiolite and mixing with groundwaters already present in the bedrock. There are broadly three main aspects.
1. Where CO2 from the atmosphere and the soil is freely available, the weathering of the primary minerals (magnesian silicates) leads to the production of magnesium bicarbonate type waters of moderate alkalinity and pHs around 8.5. In some cases, chromium is leached from the rock to solution. Correspondingly,
Fig. 5. Relationship between δ2H and δ18O for the Troodos
groundwaters. Local meteoric water line from Jacovides (1979). The sample of Type 4 water is not plotted because of a potential spurious analysis for δ2H.
for components such as aluminium, the formation of secondary minerals ensures that concentrations are close to or below the limits of detection. For these waters, dissolved carbon dioxide levels vary around saturation by about a factor of ten and this is probably quite normal for surface waters where photosynthesis and respiration are active. Nonetheless, for the springs, some uptake of CO2 seems to have taken place and calcium carbonate or calcium-magnesium carbonate solubility controls may be active. The magnesium carbonate waters have low concentrations of Cl and SO4 indicating that the major geochemical control is water-rock interaction. The low total dissolved solids in these waters is consistent with tritium and stable isotope studies which showed that the Mg-HCO3 waters are relatively young and derived from local catchment areas (Jacovides, 1979). 2. Within the groundwater system, an evolutionary series of water types occurs (Neal and Stanger, 1984; Stanger, 1986), for a system that is partially/effectively “closed”. The primary minerals within the rock dissolve partially to increase the calcium levels and to consume hydrogen ions. In the process, the pH rises as CO2 is not freely available to buffer hydrogen ion consumption. In turn, this leads to conversion of dissolved carbon dioxide and bicarbonate to carbonate, the water becomes undersaturated with respect to carbon dioxide and saturated/oversaturated with respect to Ca, Ca-Mg and Mg carbonates. Furthermore, the waters increase in hydroxyl concentration and this leads to oversaturation with respect to Mg(OH)2, while carbonate buffering is lost. Due to this process, magnesium is progressively
lost from solution (Fig. 3), while releases of calcium from primary mineral dissolution are compensated partly by secondary precipitation of carbonates. For the very high pHs encountered, aluminium is present mainly as aluminate anions that are relatively stable in solution. Because of this, the total aluminium concentration increases with increasing pH (Fig. 3). This is in contrast to Al+3 concentrations that decline sharply as pH
increases.
3. Within the groundwater, there is an increase in salinity (e.g. from formation waters, fluid inclusions or evaporites). Increases in salinity commonly occur due to mixing with a deeper formation water, through the dissolution of evaporite minerals (e.g. gypsum/ anhydrite, halite) or evaporation. The relative proportions of dissolved components to Cl can be used to discriminate the origin of salinity in groundwater systems. However, in the case of non-conservative parameters, an understanding of water-rock interactions is essential in determining the relative importance of the above processes e.g. the precipitation or dissolution of Ca and Mg salts or ion-exchange reactions may modify simple mixing patterns.
The composition of Mg-HCO3 and hyperalkaline waters
in Cyprus, a comparison with other areas.
Mg-HCO3 type waters
Table 9 provides a summary of the Mg-HCO3 waters from the different ophiolite study areas. For the table, the Cyprus data is split into low- and high-salt categories. The low salt Table 9. A comparison of magnesium bicarbonate waters for Cyprus (this study), Greece
(Papastamataki, 1977), Northern Oman (wadis with catchments wholly in ultramafic areas: Neal and Stanger, 1994) and the western USA (average data from Barnes and O’Neil, 1971 as summarized by Drever, 1997). The units are all mg-element l-1 except
for sulphate (mg-SO4 l-1) and pH (dimensionless).
Site Cyprus Cyprus Greece Northern Western
‘low sea salt’ ‘high sea salt’ Oman USA
pH 7.9 – 9.8 8.7 – 9.5 7.9 – 8.4 8.1 – 10.4 8.6 Na 3.2 – 5.1 12 – 52 4.1 – 11.5 11 – 110 7.2 K 0.2 – 0.3 0.9 – 1.5 0.0 1 – 6 0.7 Ca 1.5 – 5.1 37 – 41 12 – 39 7 – 34 7.9 Mg 55 – 112 31 – 45 81 – 117 17 – 59 126 Cl 7 – 9 28 – 45 7 – 11 11 – 181 12 SO4 2.1 – 3.6 15 – 46 6.7 – 12.5 11 – 84 11 Si 0.3 – 19.5 6 – 14 – 1.9 – 8.4 19
category combines Types 1a and 1b that are very similar, other than in terms of the trace levels of Cr in the waters, while the high-salt category is represented by Type 1c waters.
All of the Cyprus Mg-HCO3 waters are similar to the other ophiolite study areas, but the high-salt group is closer to that for Northern Oman, while the low-salt group is similar to that for Greece and the Western USA.
Hyperalkaline waters
Table 10 provides a summary of the water chemistry of the hyperalkaline waters in Cyprus and elsewhere. The Cyprus hyperalkaline waters are split into two groups based on low-and high-calcium contents. The low calcium grouping has low calcium concentrations relative to all the study areas and this may well reflect a greater extent of carbonate precipitation or ion exchange. However, in most other respects (pH, sea-salt and sulphate concentration) the Cyprus hyperalkaline waters are similar except for potassium where there is a marked enrichment in the case of Type 3a. In comparing the information for the different study areas, two features emerge. Firstly, the Cyprus hyperalkaline waters have a much higher salt content than for the other Mediterranean areas as well as New Caledonia and the USA. Secondly, the waters are similar to those found in Northern Oman, the exception being the low calcium Cyprus Type 3a group which is also enriched in silica.
From these observations and earlier publications: 1. Cyprus hyperalkaline springs are similar to those in
Northern Oman with respect to the “sea-salt” components. These require an additional “sea-salt” component compared to the other areas.
2. The Cyprus hyperalkaline springs can show particularly high sulphate concentrations.
3. The Cyprus data is consistent with the pioneering work of Barnes et al. (1978), who explained hyperalkaline springs in terms of low temperature serpentinisation reactions. In detail, the evolution of the waters is probably closest to that described by Neal and Stanger (1984) and Stanger (1986) for Northern Oman. The origin of increased salinity in the Cyprus groundwaters
The groundwaters display both an extremely large range in Cl concentration as well as in the relative abundances of major elements (Figs. 2–4). Extensive evaporation cannot explain the stable isotope signatures (Fig. 4), the low Cl in Type 1 waters or the trends in groundwater chemistry (evaporation would lead to loss of major components e.g. Ca, Mg, due to precipitation reactions). The most saline sample (Type 4) was collected from the pillow lavas, which are known to have restricted groundwater circulation. This groundwater has a Br/Cl ratio slightly lower than that of sea-water but too high to be derived from the dissolution of halite. There is a good correlation of Br with Cl in all waters, which is similar to the sea-water dilution curve (Fig. 4). The most likely origin, therefore, for this saline water is a dilute sea-water which has not been sufficiently flushed from the aquifer. This is also consistent with the general correlation of δ18O and salinity, variations from this trend
being due to different recharge history. However, the groundwater has been significantly modified from that of sea-water by chemical reactions (e.g. gypsum/anhydrite dissolution) as well as dilution, giving rise to higher or lower solute concentrations in non-conservative parameters (Fig. 3) and should be described as a formation water rather than a connate water (thus avoiding any generic connotation).
The water types display generally good trends when Table 10. A comparison of hyperalkaline data for Cyprus (this study), Greece (Papastamataki,
1977), Bosnia (Derkovic, 1973), Oman (Neal and Stanger, 1984), New Caledonia and USA (Barnes
et al., 1978). The units are all mg-element l–1 except for sulphate (mg-SO
4 l–1) and pH (dimensionless).
Cyprus Cyprus Greece Bosnia Oman New Western
Type 3a Type 3b Caledonia USA
pH 11.5 11.2 11.0 – 11.7 11.7 11.0 – 11.9 10.8 11.5 Na 385 163 22 – 25 35 66 – 331 15 19 K 15.1 1.2 0.4 – 2.0 1.5 6.0 – 15.6 3 1 Ca 1 93 33 – 35 29 23 – 91 14 40 Mg 0.3 0.5 0.1 – 0.5 7 0.0 – 2.6 2.3 0.3 Cl 420 190 16 – 18 20 160 – 415 22 63 SO4 251 207 0 – 5 2 0 – 45 0.8 0.4 Si 24 3.4 1.6 – 2.1 0.9 0.2 – 6.1 0.4 0.4
plotted against Cl indicating that mixing between young recharge waters and an end-member similar to the type 4 water can largely explain the increase in salinity the Troodos groundwaters. However, many elements fall off a potential mixing line (Fig. 4) and this feature highlights the importance of additional geochemical reactions for these hydrogeochemically reactive elements in the evolution of the waters.
The Type 1 waters have been considered in detail above and represent relatively young waters, but some mixing with of a more saline water has occurred for Type 1c. The Type 2a and 2b waters plot in different fields on a PIPER diagram (Fig. 2). The Type 2a waters have relatively high Na/Cl ratios, high HCO3 and low Ca concentrations. Their compositions are consistent with a reaction pathway that involves cation exchange of Ca for Na. In contrast, the Type 2b waters have much higher Ca and SO4 and lower HCO3, and can be best explained by dissolution of gypsum: since the waters are saturated with respect to calcite, any dissolution of gypsum would force calcite to precipitate (hence lower than expected Ca and HCO3 proportions). Likewise the Type 3a and 3b waters show contrasting behaviour on the PIPER diagram (Fig. 2). The Type 3 waters can also be explained by gypsum/anhydrite dissolution with the Type 3a waters having undergone ion exchange (in this case probably driven by gypsum dissolution). Silicate hydrolysis reactions are also extremely important for Type 3 waters, leading to high pH, has been discussed previously. It has been suggested that high SO4 in groundwaters of the Troodos are due to sulphide mineral oxidation (Wagner et al., 1990). Sulphide minerals are present in certain parts of the ophiolite sequence (up to 1.26 wt. %), particularly the upper dyke sequence, as are gypsum and anhydrite (Alt, 1994). Sulphide oxidation produces significant amounts of H+ which would lower the pH (acid waters are known in
parts of the ophiolite where this has occurred) and the good correlation of Ca with SO4 makes it much more likely that gypsum or anhydrite is the dominant control on the excess Ca and SO4 in these groundwaters. The final group, the Type 5 waters are of Ca-(Na)-SO4 type. These have very high Ca and SO4 concentrations and Ca/Cl and SO4/Cl ratios (Fig. 4) indicating extensive gypsum/anhydrite dissolution as well as a high component of formation water.
Conclusion
The ophiolites of Cyprus represent a highly dynamic phase of hydrothermal and earth surface temperature alteration of ocean floor rocks. The water quality of surface and groundwaters reflects this variability. The evolution of the waters is tied strongly to the basic/ultrabasic character of
the rocks that weather to consume hydrogen ions to increase pH. This, in turn, leads to the removal of dissolved carbon dioxide as calcium and/or Ca-Mg carbonates. The geochemical evolution of the waters is also strongly controlled by mixing involving an older formation water (with a salinity approximately 40% that of sea-water) and the dissolution of gypsum and/or anhydrite present within the ophiolite rocks. The water quality varies even over short distances and this implies a fracture flow system that is heterogeneous with respect to both hydrology and chemical reactivity.
Broadly, the water types encountered in Cyprus are similar to those found in other ophiolitic areas and hydrogeochemical processes described in earlier publications can be invoked to account for their compositions (Barnes and O’Neil, 1971; Barnes et al., 1967, 1972, 1978; Neal and Stanger, 1984, 1985; Stanger, 1986). However, salinity is much higher in some groups of the Cyprus ophiolite groundwaters due to mixing with a saline end-member and dissolution of evaporite minerals. Indeed, the Cyprus ophiolitic environment seems to provide a wide range of alkaline to hyperalkaline water types that hopefully will shed new light on the evolution of water quality in ophiolitic areas. Thus, the water chemistry may well provide important clues to the history of the Cyprus ophiolites regarding groundwater circulation, mixing and sulphide oxidation.
The data from this and an earlier study (Pantazis, 1978) contribute to an understanding of the hydrogeochemistry of a remarkable ophiolite. Several areas can be highlighted where further research would help in the management of water resources in the Cyprus ophiolite. The spatial and depth variations with regard to the occurrence of saline water are not clearly understood. A more regionally extensive study of groundwaters, particularly with regard to chemical stratification with depth would help to highlight the mechanisms of groundwater mixing. The application of stable isotopes (d2H and d18O) and dating (e.g. using CFCs)
should further constrain mixing processes and the age of the different groundwaters. The relative inputs of sulphate from different sources (e.g. sulphides, sulphates) needs to be quantified in more detail and this should be possible by a study of sulphur isotopes which show significant differences between these mineral phases. There is also little data on the concentrations of trace elements that may have statutory limits in these groundwaters, and may also help elucidate geochemical processes and reactions in the aquifer. It is hoped that the study stimulates further work in the area.